

Abstract
Background
Network analysis has been used to elucidate the relationships among depressive symptoms, but this approach has not been typically used in persons with stroke.
Method
Using a sample of 835 persons with stroke from Stroke Recovery in Underserved Populations 2005–2006 dataset, this study used network analysis to (1) examine changes in relationships between depressive symptoms over time, and (2) test whether baseline network characteristics were prognostic for depression persistence. Network analysis was performed on depressive symptoms collected at discharge from inpatient rehabilitation and at 3-months and 12-months post-discharge.
Results
The depressive symptom network at discharge was less connected than at both post-discharge follow-ups. Trouble focusing and feeling good as others were the most predictable symptoms at post-discharge, even though they were less connected to other depressive symptoms. Among participants with elevated baseline depression severity, those whose depression persisted 12 months later had more strongly connected networks at discharge than those who recovered 12 months later.
Limitations
This study was unable to determine the directionality of edges. The depression scale was administered differently across time points.
Conclusion
These results suggest that baseline network connectivity can predict the course of post-stroke depression, similar to non-stroke populations. More broadly, the study highlights the importance of examining relationships between individual depressive symptoms rather than only sum-scores.
Keywords: stroke, depression, emotion, network-analysis
1. Introduction
Over 80 million people living globally have had a stroke, with 13.7 million new strokes each year (Feigin et al., 2017; Gorelick, 2019). Post-stroke depression (PSD) impacts roughly one-third of stroke survivors. In a meta-analysis of 61 studies with 25488 persons with stroke, the pooled frequency of PSD was 31% but decreased to 25% one- to five-years post-stroke (Hackett & Pickles, 2014). Studies have also found the incidence of subthreshold depression to range from 20% to 60% (Ashaie et al., 2019; Saxena et al., 2007) in persons with stroke. PSD negatively impacts motor and cognitive functioning, social relationships, and rehabilitation outcomes (Robinson & Jorge, 2016; Towfighi et al., 2017) and increases the risk of mortality (House et al., 2001) and stroke recurrence (Sibolt et al., 2013).
The severity of PSD has typically been measured by summing symptom scores on various scales such as the Center for Epidemiological Studies Depression Scale (CESD) and the Hamilton Depression Rating Scale (Hamilton, 1960; Radloff, 1977). It is possible that individuals may have similar sum scores on depression scales but have a different constellation of qualitatively different symptoms. Relatedly, summing symptom scores assumes that symptoms are interchangeable, but, for example, sleep disturbance is unlikely to be interchangeable with lack of motivation (Fried & Nesse, 2014; Funkhouser et al., 2019). One way to better characterize depression is to adopt a symptom network framework to analyze specific symptoms and the relationships among these symptoms rather than summing the number of symptoms (Borsboom, 2017). In this framework, symptoms are viewed as components of a complex network and the relationship among these components is nonlinear and dynamic, representing a diverse pattern of interactions (Borsboom & Cramer, 2013).
A network approach to understanding depression allows for investigation of putative causal pathways among different symptoms and how these symptoms may reinforce each other and possibly form feedback loops (e.g., insomnia → fatigue→ not feeling good → insomnia) (McNally et al., 2015). In this approach, some symptoms may play a more central role than other symptoms (McNally et al., 2015). This is especially relevant in persons with stroke, where the presence of underlying cognitive and motor impairments may increase some depressive symptoms and make them more central and connected to other depressive symptoms. Therefore, identifying a symptom network for depression can lead to interventions that target specific symptoms, which may then impact other symptoms connected to them. For example, if a person with stroke has high levels of fatigue, an intervention focused on fatigue may then alleviate symptoms connected to fatigue (e.g., restless sleep). In sum, a symptom network approach can provide a better understanding of the phenotypic structure of depression in persons with stroke and offer insight into designing specific treatments that target individual depressive symptoms and, more generally, aid in identifying personalized medicine approaches.
A network approach to analyzing depressive symptoms may also provide prognostic indicators for persistent depression (Funkhouser et al., 2020). Indeed, van Borkulo et al. (2015) compared the network structures of 515 neurologically healthy individuals with depression that later either remitted or persisted, and found that the baseline network connectivity (i.e., the sum of associations between different symptoms) was higher in those with persistent depression, a finding that has been replicated (McElroy et al., 2019; Schweren et al., 2018). Importantly, it is unclear whether the association between network connectivity and course of depression generalizes to PSD.
This study employed network analysis of depressive symptoms based on secondary analysis of CESD from the Stroke Recovery in Underserved Populations (SRUP) 2005–2006 study to understand the interplay among depressive symptoms over time in persons with stroke. Aim 1 first examined cross-sectional depressive symptom networks in persons with stroke at discharge from inpatient rehabilitation facilities and 3-months and 12-months post-discharge. In a subsample of participants who had elevated depressive symptoms at discharge, aim 2 then compared the baseline network structures of those who (a) remitted at the 12-month discharge to (b) those whose depressive symptoms persisted. To our knowledge, this is the first instance of network analysis being employed to understand depression symptomology as well as the prognostic viability of network connectivity in predicting the course of depression symptoms in persons with stroke.
2. Method
2.1. Participants
Participants were from the SRUP 2005–2006, an observational follow-up study of persons who had a stroke and received inpatient medical rehabilitation services during 2005–2006 (Ostir et al., 2008, 2016). Eleven inpatient medical rehabilitation facilities from diverse regions of the United States participated in the study: specifically, California, Florida, Iowa, Illinois, Kentucky, New Jersey, New York (2), Texas (2), and Washington DC. All participants provided informed consent prior to participation. To mitigate the loss of data and maximize power, individuals who had missing symptom scores at any of the three time points were excluded from analysis, resulting in 835 participants in the present study. Depressive symptom data from three time-points were used: discharge from inpatient medical rehabilitation services, 3-months post-discharge, and 12-months post-discharge. Age, sex, years of education, stroke diagnosis, stroke type, length of stay at the hospital, number of comorbidities (e.g., diabetes), number of stroke symptoms (e.g., speech difficulties, hemiplegia), and the total Functional Independence Measure [FIM; (Keith, 1987)] were also extracted from the dataset and used to characterize the sample. FIM measures the level of disability of a person with stroke, with higher scores indicating higher level of functioning (Keith, 1987).
2.2. Depression Measure
Depressive symptoms in the SRUP study were assessed using the CESD, a 20-item self-report scale assessing depressive symptoms over the preceding week. A meta-analysis of various depression instruments in 2907 patients with stroke found CESD to be an optimal depression screening instrument (Meader et al., 2014). CESD has also been routinely used in network analyses of depressive symptoms in non-stroke populations (e.g., Robinaugh et al., 2014; Santos et al., 2018). CESD items are scored from 0 (rarely or none of the time) to 3 (most or almost all the time), with positive items reverse scored. A sum score ≥ 9 on the 20-item CESD was used to indicate the presence of depression for aim 2 (Moon et al., 2017) Individuals with subthreshold depression were included in aim 2 as previous research has highlighted the clinical importance of subthreshold depression (Lewinsohn et al., 2004; Shankman et al., 2009).
There is considerable variability in network analysis literature about how to determine whether items measure the same construct (i.e., if correlations between items are due to items measuring the same construct or not) (Fried & Cramer, 2017). Therefore, based on Burger et al.’s (2020) recommendation, items were combined if they showed correlations ≥ 0.50 and if the items were deemed to measure the same construct. In this study, CESD items “I couldn’t shake off the blues,” “I felt depressed,” and “I felt sad” were correlated > .50 and had conceptual overlap. Therefore, they were combined into a single item: depressed. Additionally, CESD items “I felt hopeful about the future,” “I felt happy,” and “I enjoyed life” were also correlated > .50 and had conceptual overlap. Therefore, they were combined into a single item: happy. Thus, the present network analysis was done on 16 CESD items. Tables I to VI in the supplementary materials contain a list of the 16 CESD items and item statistics for all the analyses done in this study.
2.3. Data Analysis
Analyses for aim 1 (i.e., network comparisons across the three time points) included all participants in the present sample (N = 835). Analyses for aim 2 included the 397 patients who met the CESD cut-off of 9 for depression symptoms at discharge from in-patient rehabilitation. These patients were further split into two groups based on patients whose depression symptoms persisted (perMDD; N = 203) or remitted at 12-months post discharge (remMDD; N = 194). This facilitated the comparison of baseline networks of persistent and remitted depression symptoms for aim 2.
2.3.1. Network Estimation
In network models, nodes represent specific symptoms and edges represent the link between nodes (i.e., symptoms). These network models are based on partial correlations between nodes while controlling for all other nodes in the network. The graphical lasso (GLASSO) method with the extended Bayesian information criterion (EBIC) was used to generate regularized Gaussian graphical models (GGMs) (Chen & Chen, 2008; Friedman et al., 2014). The GLASSO algorithm reduces the likelihood of false positives and results in sparser network structures by shrinking edges that are likely to be spurious to exactly zero. The networks were visualized using the Fruchterman–Reingold algorithm, in which strongly connected nodes are closer to each other and nodes with the most connections are at the center of the network. Thicker edges in figures represent stronger association between symptoms, with blue edges indicating positive associations and red edges indicating negative associations. A detailed tutorial on network analysis is available by Epskamp et al. (2018). Networks were based on Spearman correlations and estimated and visualized using the R packages qgraph (Epskamp et al., 2012) and bootnet (Epskamp & Fried, 2015).
2.3.2. Node Centrality
Centrality analysis was also performed to investigate the importance of each depressive symptom in the networks. Expected influence, strength, betweenness, and closeness centrality indices were calculated. Expected influence centrality is the sum of all edges connected to a node. Strength centrality is the sum of all absolute values of edges connected to a node. Betweenness centrality is the number of times a node lies on the shortest path between two other nodes, and closeness centrality refers to the inverse sum of the lengths of the shortest paths from a node to all other nodes. Betweenness and closeness have demonstrated poor reliability in psychopathology network studies (Epskamp & Fried, 2015), and recent research (De Haan et al., 2020; Robinaugh et al., 2016) has suggested that expected influence may be more reliable and interpretable than strength because it considers both positive and negative edges. Therefore, expected influence centrality is reported in the main analysis and the other centrality measures are reported in the supplementary materials.
In addition to computing centrality, each symptom’s predictability was estimated. Predictability is an absolute measure of interconnectedness of a node indicating the variance of each node that is explained by surrounding nodes. Furthermore, if it is assumed that all undirected edges are directed towards a given node, then predictability can suggest how much that node is impacted by surrounding nodes (Haslbeck & Waldorp, 2018). A value of 0% suggests that a node is not predictable by surrounding nodes, while a value of 100% suggests that a node is fully predictable by its surrounding nodes. Predictability is visualized as a ring-shaped pie chart around a node and was estimated with the R package mgm (van Borkulo et al., 2017).
2.3.3. Network Stability and Accuracy
A case-dropping subset bootstrapping approach was used to determine how many cases can be dropped before the network results become unstable. This method calculates a correlational stability (CS) coefficient, which ranges from 0 to 1. A CS-coefficient above .25 implies the network is moderately stable but it is preferable if the CS-coefficient is above .50 (Epskamp et al., 2018). CS-coefficients for all four centrality measures (i.e., expected influence, strength, closeness, and betweenness) were calculated. We also calculated 95% confidence intervals (CIs) around the edge weights using non-parametric bootstrapping to assess edge weight accuracy. Narrower CIs represent more accurate estimation of edges while larger CIs represent less accurate estimation of edges. Significant differences between edge weights and expected influence centrality measures were also tested. Network stability and accuracy were estimated using R package bootnet (Epskamp & Fried, 2015).
2.3.4. Structural Similarity Between Networks
The permutation-based NetworkComparisonTest (NCT) package (van Borkulo et al. 2017) in R to was used investigate network differences in persons with stroke (a) at discharge vs. 3-months post-discharge; discharge vs. 12-months post-discharge; 3-months post-discharge vs. 12-months post-discharge (aim 1), and (b) between perMDD vs. remMDD patients at discharge (aim 2). The NCT compares two networks at a time on the following three measures: (a) network connectivity, (b) network structure (i.e., matrices of edge weights), and (c) individual edge weights. All networks were compared using 1000 random permutations. The similarity of the networks’ structures were also investigated by correlating the adjacency matrices of different networks and correlating the expected influence centrality measures of different networks (Santos, Kossakowski, Schwartz, Beeber, & Fried, 2018). A correlation close to 1 would indicate that networks are highly similar, while a correlation of 0 would indicate that the networks are dissimilar.
3. Results
3.1. Sample Characteristics
The average age of the 835 participants in the dataset was 68.2 years with 52% of participants being female. The majority (74.25%) of the participants were diagnosed as having an ischemic stroke. Participants had an average count of 2.78 comorbidities and 1.38 stroke symptoms. Participants’ average length of stay at the rehabilitation facility was 20.19 (SD = 10.97) days. The average FIM score at discharge was 84.10 (SD = 22.07), which was significantly less than the score at 3-months post-discharge (M = 106.10, SD = 20.23) and 12-months post-discharge (M = 107.13, SD = 20.89) [F(1.61, 1331.46) = 1085.80, p < .0001]. Post-hoc comparison showed that the FIM scores were not significantly different between the two post-discharge periods. There was no difference in FIM scores at discharge between the perMDD and the remMDD groups examined in analysis 2 (mean = 79.64 vs. 81.93). Table 1 summarizes the participant characteristics.
Table 1.
Participant Characteristics at Admission
| N (%) or mean (SD) | N = 835 |
|---|---|
| Age | 68.20 (12.94) |
| Education | 12.43 (2.78) |
| Female | 435 (52.10) |
| Race | |
| White | 635 (76.05) |
| Black | 145 (17.37) |
| Hispanic | 39 (4.67) |
| Other | 16 (1.92) |
| Number of comorbidities | 2.78 (1.27) |
| Number of symptoms | 1.38 (1.04) |
| Length of stay in the hospital | 20.19 (10.97) |
| Stroke Diagnosis | |
| Hemorrhagic stroke | 135 (16.17) |
| Ischemic stroke | 620 (74.25) |
| Other stroke (transient, ill-defined, late effects) | 51 (6.11) |
| Other circulatory disease | 4 (0.48) |
| Other medical condition | 25 (2.99) |
| Stroke type | |
| Left-body stroke | 334 (40.00) |
| Right-body stroke | 335 (40.12) |
| Bilateral stroke | 34 (4.07) |
| No paresis stroke | 81 (9.70) |
| Other stroke | 51 (6.11) |
| Center for Epidemiological Studies Depression | |
| Discharge | 11.30 (10.90) |
| At 3-months post-discharge | 10.73 (9.49) |
| At 12-months post-discharge | 9.59 (8.87) |
| Functional Independence Measure | |
| At Admission* | 57.19 (19.06) |
| At Discharge* | 84.10 (22.07) |
| At 3-months post-discharge** | 106.10 (20.23) |
| At 12-months post-discharge*** | 107.13 (20.89) |
Data from 834 participants,
Data from 832 participants
Data from 831 participants
3.2. (Aim 1) Depressive Symptom Networks at the Three Time points
3.2.3. Network Structure
Three networks were constructed based on the 16 CESD symptom measures at discharge, 3-months post-discharge, and 12-months post-discharge (Figure 1). At the time of discharge from inpatient rehabilitation, 82 out of 120 possible edges had a nonzero edge weight, with a mean weight of .054. All edges were positive (highlighted in blue). At 3-months post-discharge, 84 out of 120 possible edges had a nonzero edge weight, with a mean weight of .039. Most edges were positive (n = 72, 86%, highlighted in blue); few edges were negative (n = 12, 14%, highlighted in red). At 12-months post-discharge, 95 out of 120 possible edges had a nonzero edge weight, with a mean weight of .040. Many edges were still positive (n = 81, 85%, highlighted in blue); few edges were negative (n = 14, 15%, highlighted in red). Figures I–III in the supplementary materials show bootstrapped 95% confidence intervals (CIs) around the edge weights.
Figure 1.
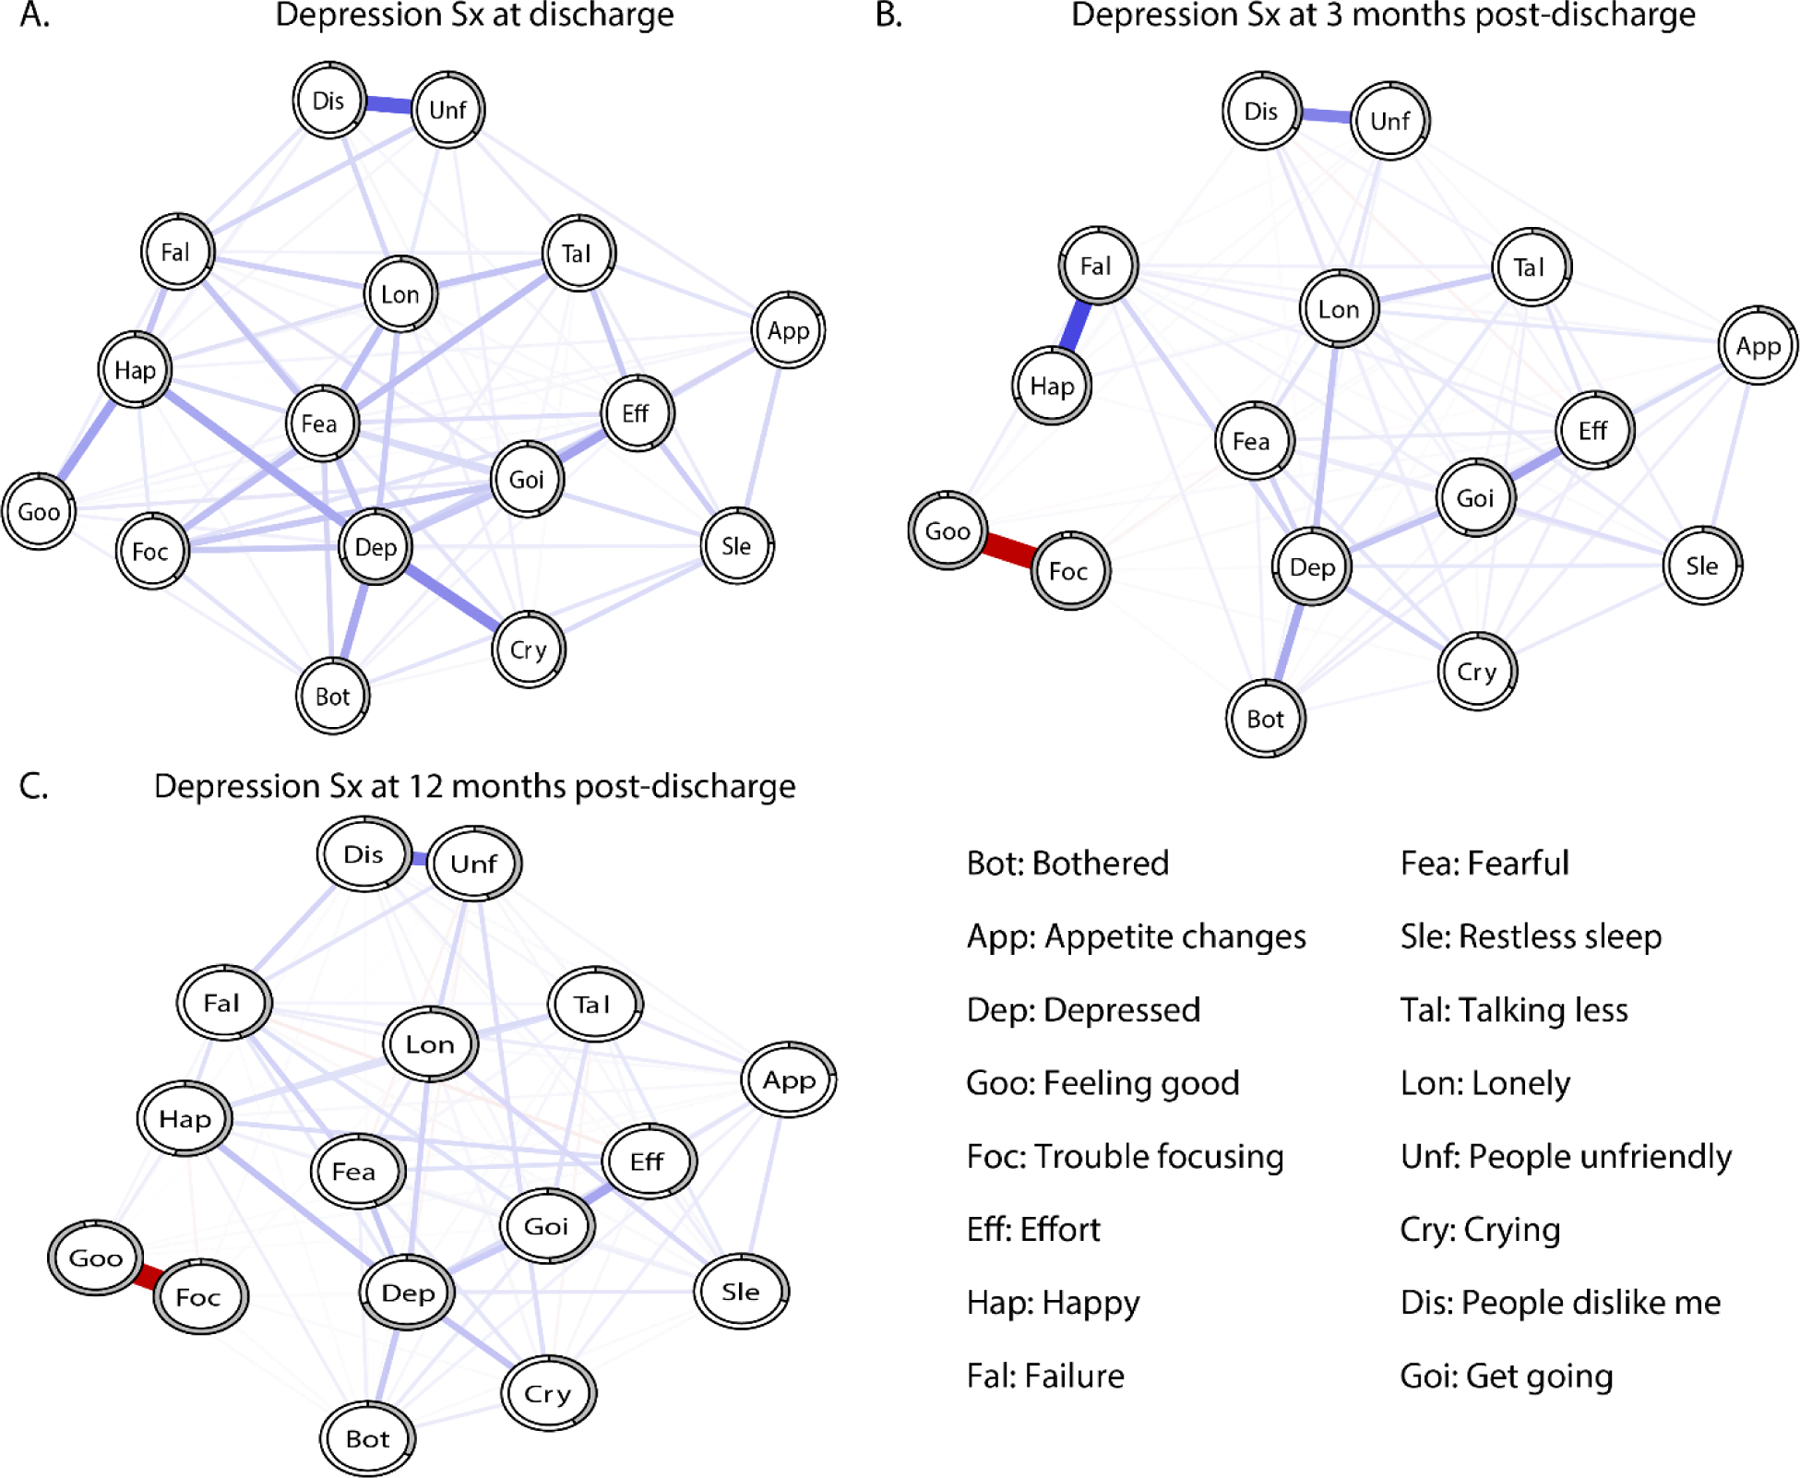
Depressive symptom networks of participants at three different time points
A) Depressive symptoms at discharge, B) at the 3-months post-discharge, C) at the 12-months post-discharge. Blue lines indicate positive relationships among the symptoms while red lines indicate negative relationships. Pie shaped ring chart around nodes (circles) indicate predictability of each node.
3.2.4. Node Centrality and Predictability
The CS coefficient for expected influence was .75 for all three time points, suggesting that expected influence was consistently a stable centrality measure. Depressed had the highest expected influence in all three networks, suggesting it was the most central symptom and more connected to other items in each network (Figure 2). Depressed had moderate connection with Crying (.31) and Bothered (.22) at discharge, moderate connection with Bothered (.30) at 3-months post-discharge, and moderate connection with Crying (.22) at 12-months post-discharge. Feeling good had the lowest expected influence at discharge while Trouble Focusing had the lowest expected influence in both post-discharge networks, suggesting fewer connections to other depressive symptoms (Figure 2). The other three centrality measures of strength, closeness, and betweenness are presented in Figure IV in the supplementary materials. Figures V–VII in the supplementary materials show edge weight difference tests and Figures VIII–X show centrality difference tests for expected influence.
Figure 2.
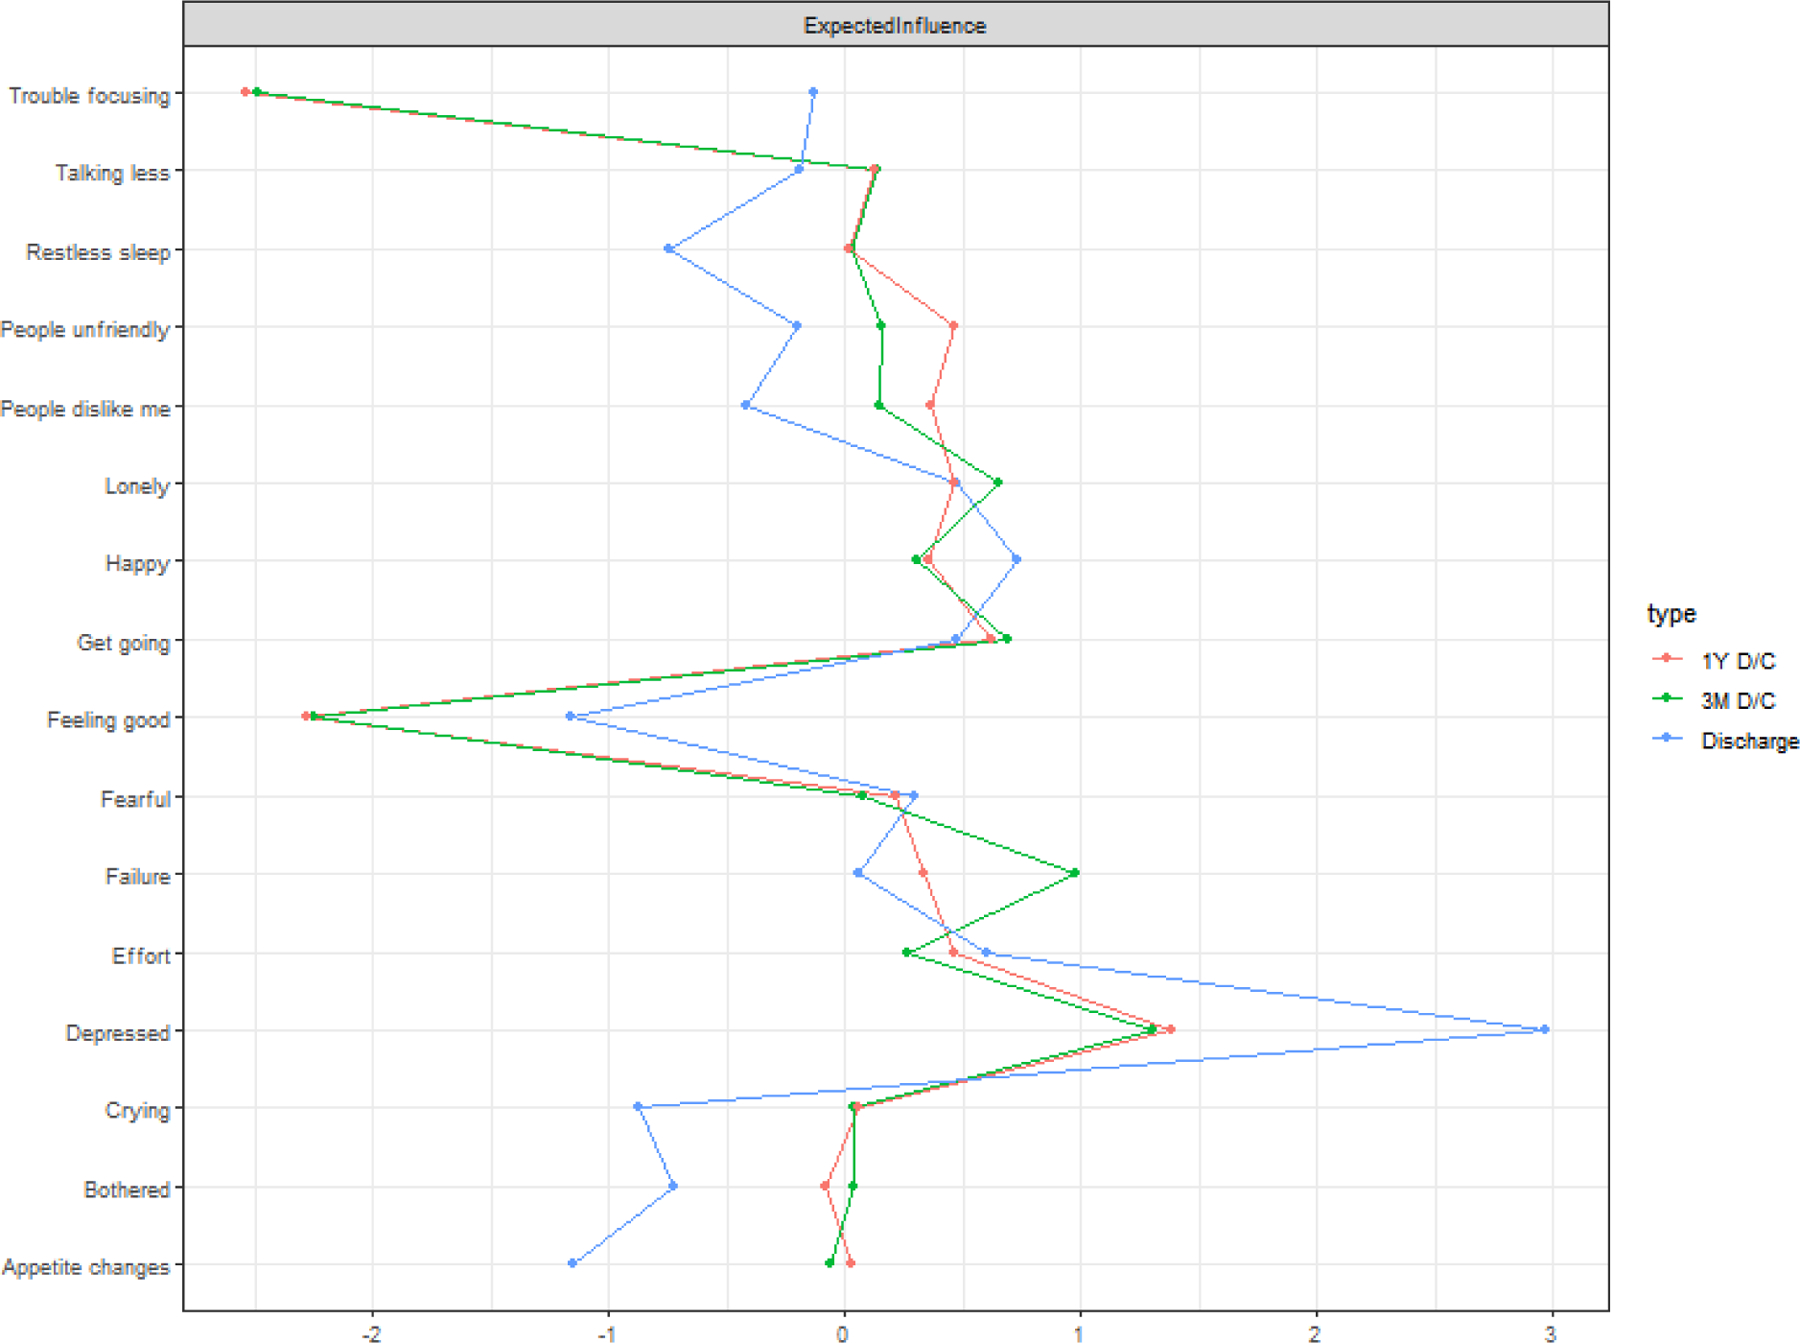
Expected Influence Centrality at Discharge and 3- and 12-months post-discharge.
Depressed mood had the highest expected influence at all three time points.
The mean node predictability was 37% at discharge, 51% at 3-months post-discharge, and 49% at 12-months post-discharge. Using the network at discharge as an example, this means that on average, 37% of the variance of each node across the data sets was explained by its neighbors. Across the three time points, Appetite Changes was consistently the least predictable node, sharing on average only 19% of its variance with surrounding nodes. With the discharge network being the only exception, Trouble Focusing and Feeling Good were the most predictable nodes post-discharge, sharing on average 96% and 96% of their variance with surrounding nodes, respectively. It is possible that high predictability values for the two nodes for the two post-discharge networks is due to the presence of a strong negative edge between them. Depressed was consistently highly predictable across networks, sharing on average 70% of its variance with surrounding nodes.
3.2.5. Structural Similarity of Networks
As discussed above, the NCT package only allows a comparison of two networks at a time. Therefore, we compared the networks at (a) discharge vs. 3-months post-discharge, (b) discharge vs.12-months post-discharge, and (c) 3-months post-discharge vs. 12-months post-discharge. The network connectivity differed significantly between the network at discharge and the two post-discharge networks (discharge: 6.58 vs. 3-months post-discharge: 7.17, p = .012, discharge: 6.58 vs. 12-months post-discharge: 7.13, p = .018), such that the 3-and 12-month post-discharge networks were more strongly connected than the network at discharge. Network connectivity was not significantly different between the 3-month post-discharge and the 12-month post-discharge networks. The network structure was also significantly different between the network at discharge and the 3-month post-discharge network (maximum difference in edge weight = .956, p < .0001). Post-hoc tests revealed that 12 edges (10%) had significantly different weights in the two networks. Furthermore, structure also differed between the discharge and 12-month post-discharge networks (maximum difference in edge weight = .953, p < .0001). Post-hoc tests revealed 7 edges (6%) had significantly different weights in the network. Lastly, the 3-month post-discharge and 12-month post-discharge networks also differed structurally (maximum difference in edge weight = .59, p < .0001). Post-hoc tests revealed 2 edges (1.5%) had significantly different weights across the networks. The edge changes were mainly related to the node, Trouble Focusing. Compared to the network at time of discharge, both post-discharge networks featured a strong negative edge between Feeling Good and Trouble Focusing and a few small edges either not connected to or negatively connected to Trouble Focusing. The adjacency matrices also revealed considerable differences (Spearman’s rho = .312 for discharge vs. 3-months post-discharge; Spearman’s rho = .49 for discharge vs. 3-months post-discharge; Spearman’s rho = .53 for 3-months post-discharge vs. 12-months post-discharge). However, expected influence centrality revealed considerable similarity across the three networks (Spearman’s rho = .72–.89).
3.3. (Aim 2) Network Characteristics Associated with Persistent versus Remitted Depression
In comparing the network models for the perMDD (n=203) and remMDD (n=194) groups at discharge, the two groups had 72 and 36 nonzero edges, respectively, the majority of which were positive (92% and 88%, respectively) (also see figure 3). Figures XI and XII in the supplementary materials show bootstrapped 95% CIs around the edge weights.
Figure 3.
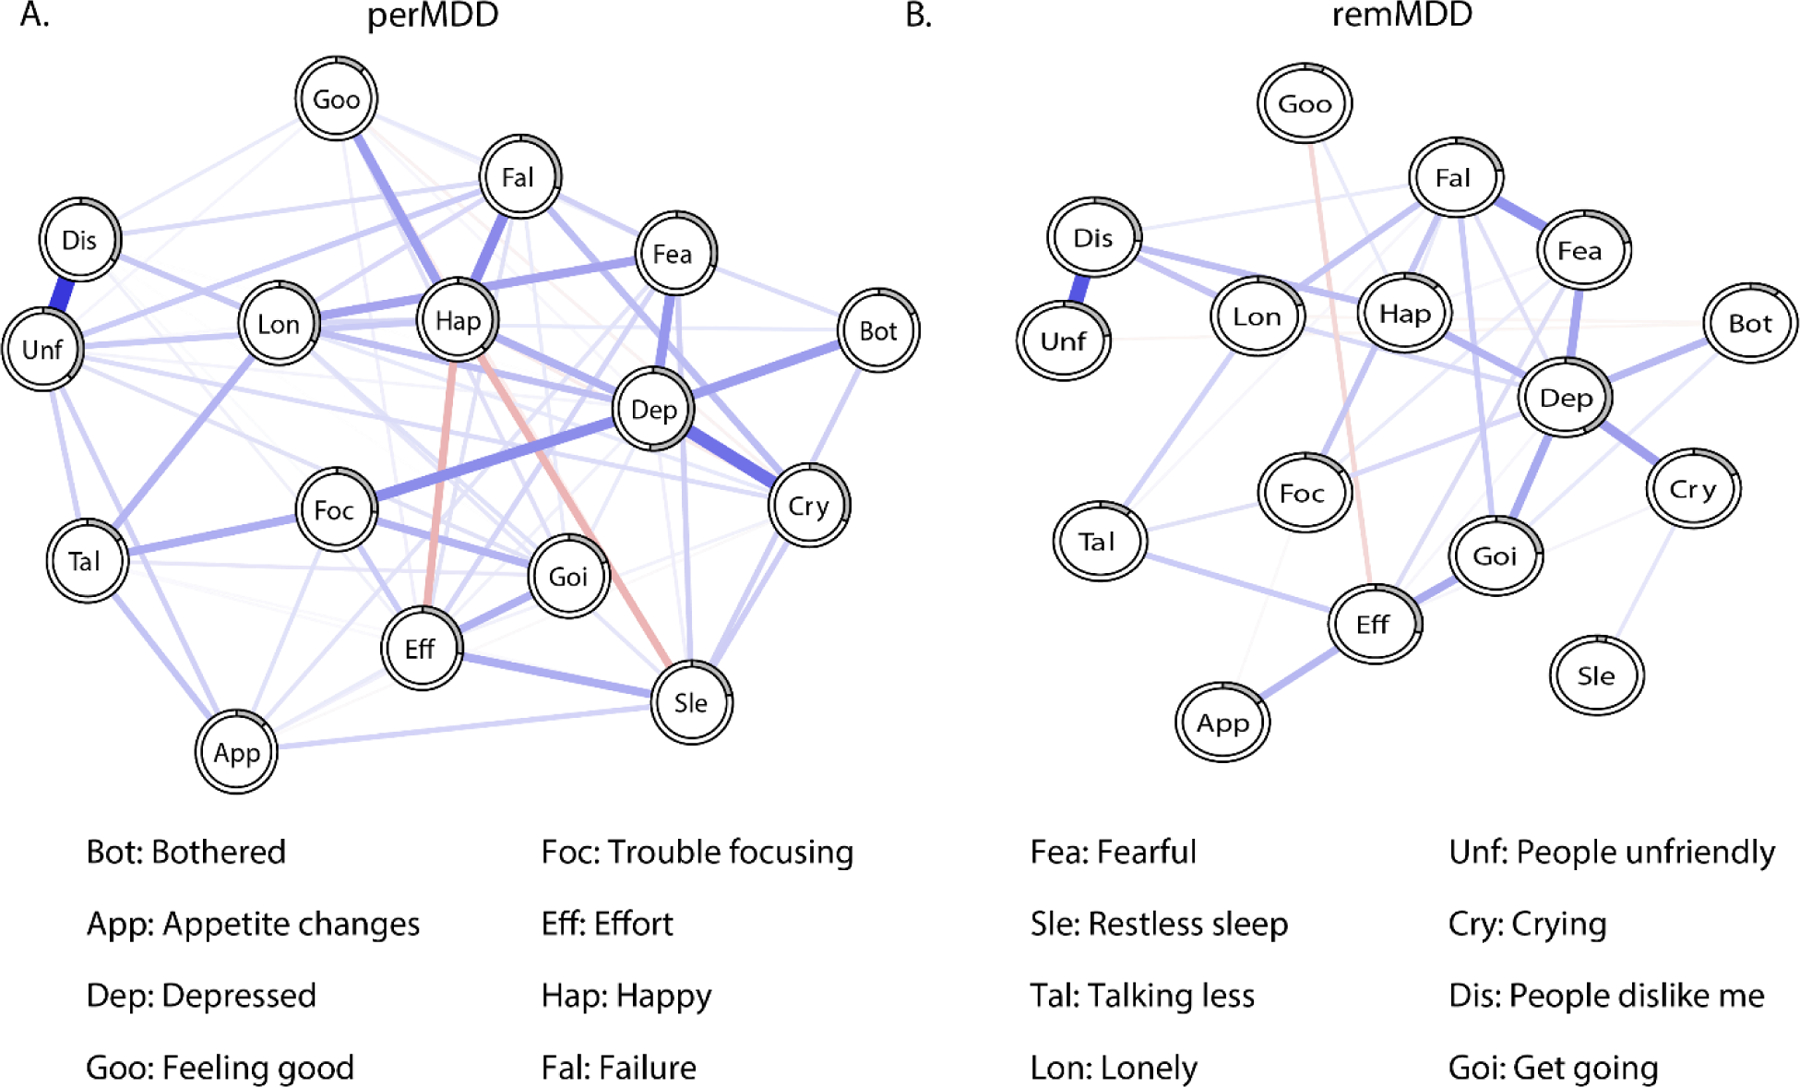
Depression networks at discharge of persons who show persistent or remitted depression at 12 months
Baseline (i.e., discharge) networks of those with A) persistent depression symptoms (perMDD) at 12-months post-discharge, and B) remitted depression symptoms (remMDD) at 12-months post-discharge. Blue lines indicate positive relationships between the symptoms while red line indicate negative relationships. Pie shaped ring chart around nodes (circles) indicate predictability of each node.
3.3.1. Node Centrality and Predictability.
The CS coefficients for expected influence in the perMDD and remMDD networks were .44 and .36, respectively, suggesting moderate stability within the two groups. Depressed had the highest expected influence in both networks (Figure 4), suggesting it was the most central and connected node. Unfriendly people and Loneliness had the second and third highest expected influence in the perMDD network, while Failure and Get Going had the highest expected influence in the remMDD network. Depressed had moderate connection with Crying (.19) in the remMDD network. Feeling Good had the lowest expected influence across both networks (see Figure 4). The other three centrality measures of strength, closeness, and betweenness are presented in Figure XIII in the supplementary materials. Figures XIV–XV show edge weight difference tests and Figures XVI–XVII show centrality difference test for expected influence in the supplementary materials.
Figure 4.

Expected Influence Centrality of those with remitted or persistent depression.
Depressed mood had the highest expected influence in both networks.
Mean node predictability was 27% for perMDD and 18% for remMDD. Appetite Changes was the least predictable node in both networks, sharing on average only 14% of its variance with surrounding nodes. Depressed was the most predictable node across networks, sharing on average 47% of variance with surrounding nodes.
3.3. 2. Structural Similarity of Networks
Network comparison test showed that the perMDD network was significantly more connected than the remMDD network (6.38 vs. 3.74, p = .031), meaning that symptoms were more strongly interconnected in individuals whose depression persisted 12 months later compared to those whose depression remitted 12 months later. There was no significant structural difference, meaning that no individual edges differed significantly between the perMDD and remMDD networks. The adjacency matrices also revealed considerable differences between the perMDD and remMDD networks (Spearman’s rho = .38). However, expected influence centrality of the perMDD network was similar to that of the remMDD network (Spearman’s rho = .70).
4. Discussion
This is the first study that used network analysis to examine relationships between individual depressive symptoms in persons with stroke over time, providing important insights into the extent to which findings from non-stroke populations generalize to persons with stroke. Moreover, comparisons between networks estimated from data at discharge from inpatient rehabilitation and at 3-month and 12-month post-discharge follow-ups revealed how this network changed over time. Importantly, we also investigated the prognostic utility of network analysis in predicting the course of depression by comparing the baseline networks of those with perMDD versus remMDD.
4.1. Depressive Symptom Networks at the Three Time points
Depressed mood was the most central symptom across the three networks. This result is not surprising as the Diagnostic and Statistical Manual of Mental Disorders (DSM-5) criteria places depressed mood or anhedonia as a required symptom for the diagnosis of MDD. It is also consistent with symptom network studies of neurologically healthy individuals and those with cancer that also showed depressed mood to be a highly important symptom (Boschloo et al., 2016; Fried et al., 2016; Schellekens et al., 2019). Taken together, depressed mood may be the most central symptom of MDD across both neurological healthy individuals and those with stroke.
However, at the 3-month and 12-month post-discharge follow-ups, Trouble Focusing and Feeling Good (as other people) became the most predictable nodes and were strongly negatively associated, even though they had few connections to other symptoms. We hypothesize that as persons with stroke realize they have difficulties with doing different cognitive tasks, their self-worth diminishes. It is also possible that external factors such as depending on family members and caregivers may further contribute to persons with stroke experiencing a decrease in their self-value.
The depressive symptom network at discharge was also significantly less connected than networks at both post-discharge follow-ups, suggesting that depressive symptoms in persons with stroke became more interconnected after discharge. It is possible that there are more cortical (and varied) changes occurring at discharge due to spontaneous neuroplasticity (Cramer & Riley, 2008), which may change the way specific symptoms are connected at discharge compared to the post-discharge periods. Furthermore, while there was no difference in network connectivity between the two post-discharge networks, there were differences in the strength of specific edges. For example, the connection between Failure and Happy was stronger at 3-months post-discharge compared to 12-months post-discharge. At 12-months post-stroke, individuals do not associate their happiness with failure because they have learned coping strategies which have impacted how they view their life (Lo Buono et al., 2017). However, further research needs to examine how factors such as coping impact individual depressive symptoms.
4.2. Differences in Baseline Symptom Networks between Those Who Go On To Have Persistent versus Remitted Depression
The present study highlights several significant important differences between the baseline network of those whose depression symptoms later remitted compared to the network of those whose depression symptoms later persisted, highlighting the predictive power of symptom network connectivity. While depressed mood was the most connected and predictable symptom in both the perMDD and remMDD network, the importance of other symptoms differed across the networks. For example, People were Unfriendly and Loneliness had higher expected influence in the perMDD network than the remMDD network, suggesting that different symptoms may play a different role in PSD that persists versus remits.
The finding that those with persistent depression symptoms had greater baseline network connectivity than those with remitted depression extend the results of van Borkulo et al. (2015) from neurologically healthy individuals to those with stroke. Higher network connectivity has been suggested to negatively reinforce other symptoms such that impairment in one symptom leads to impairment in other symptoms (e.g., “negative spirals”; e.g., insomnia → fatigue → concentration problems → psychomotor problems (Borsboom & Cramer, 2013). As van Borkulo et al. (2015) suggested, such findings could be understood through the clinical staging model (McGorry et al., 2006) in which disorders progress from subthreshold symptoms to full syndromal to persistent major depressive disorder with increased network connectivity aiding this progression. Although the overall network for perMDD had greater connectivity than for remMDD, there was no difference in the network structures (i.e., specific edges) between the two groups. This suggests that the difference in network connectivity was not driven by large differences in a few edges, but instead was likely due to many edges being slightly and non-significantly stronger in the perMDD network than in the remMDD network. Additionally, while the symptoms with the largest difference in centrality between the perMDD and remMDD networks were People were Unfriendly and Loneliness, van Borkulo et al. (2015) reported that fatigue and guilt most strongly differentiated persisters and remitters. Interpersonal sensitivity and loneliness were not included in the symptom assessment used by van Borkulo et al. (2015), however, making cross-study comparisons difficult.
4.3. Clinical and Treatment Implications
Network approaches suggest that by identifying and subsequently intervening on key nodes or edges, it may be possible to modify the whole network. Thus, targeting specific nodes or edges could result in a healthier network. Our results suggest that network connectivity and the relationship between symptoms change across time in persons with stroke. Therefore, attention needs to be paid to when depressive symptom networks are more connected so that intervening on one symptom may most positively impact other symptoms. Our study also replicated the prognostic viability of baseline network connectivity at discharge in predicting depression persistence in persons with stroke 12-months post-discharge. Focusing on patients at discharge allows for targeted intervention of specific depression symptoms early in the stroke rehabilitation process and therefore has greater clinical implications (Paolucci et al., 2001). However, further work is needed to investigate how baseline networks predict depression at different time points and time intervals and whether this approach is valid at the individual level.
4.4. Strengths and Limitations
Strengths of our study include a large sample of persons with stroke at three different time points and establishing the accuracy and reliability of the different networks. Our results also replicated many findings from network studies of neurologically healthy individuals, with depressed mood being the most central symptom and baseline networks with more connectivity predicting persistence of depression at 12-months post-discharge. Limitations include the study’s inability to determine the directionality of edges and generalize findings to individuals, the assessment of nodes using individual items, and that the CESD was administered differently across time points (e.g., in-person interviews at baseline vs. phone interviews at follow-ups). As this study used existing data sets, there is no information on clinical diagnosis of depression using structured interviews and the frequency of deviations from standard CESD administration is unclear. Thus, future research in persons with stroke would benefit from using interview assessments of depression and stroke factors that are specifically geared towards network analysis.
4.5. Conclusion
Depressed mood was the most central symptom across all the three time points (i.e., discharge from inpatient rehabilitation, 3-, and 12-months post-discharge). However, certain symptoms (e.g., trouble focusing) became more predictable 3- and 12-months post-discharge. Depressive symptom networks also differed in their connectivity and structure at discharge and the two post-discharge periods. More broadly, valuable information is lost when relying on total sum scores as they do not provide a fine-grained picture of the differential importance of particular depressive symptoms and how associations between symptoms change over time. Additionally, our study demonstrated that baseline network connectivity predicted the course of depression, such that persons with stroke whose depression symptoms persisted 12-months post-discharge had greater network connectivity at discharge compared to those whose depression symptoms remitted 12-months post-discharge. Stronger associations between symptoms may be an important prognostic indicator of depression persistence in persons with stroke.
Supplementary Material
Highlights.
Depressed mood was the most central symptom in the depression networks in persons with stroke.
Network connectivity in depression symptoms in persons with stroke increased post-discharge.
Depressed participants whose depression symptoms persisted had a more connected network at baseline than depressed participants who later recovered.
Funding:
Sameer Ashaie was funded by the Switzer Merit Research Fellowship #90SFGE0014 from the National Institute on Disability, Independent Living, and Rehabilitation Research (NIDILRR). Stewart Shankman was funded by NIMH grant R01 MH119771. Leora R. Cherney was funded by The Coleman Foundation.
Footnotes
Declaration of Interest: None
References
- Ashaie SA, Hurwitz R, & Cherney LR (2019). Depression and subthreshold depression in stroke-related aphasia. Archives of physical medicine and rehabilitation, 100(7), 1294–1299. [DOI] [PubMed] [Google Scholar]
- Borsboom D (2017). A network theory of mental disorders. World psychiatry, 16(1), 5–13. [DOI] [PMC free article] [PubMed] [Google Scholar]
- Borsboom D, & Cramer AO (2013). Network analysis: an integrative approach to the structure of psychopathology. Annu Rev Clin Psychol, 9, 91–121. doi: 10.1146/annurev-clinpsy-050212-185608 [DOI] [PubMed] [Google Scholar]
- Boschloo L, van Borkulo CD, Borsboom D, & Schoevers RA (2016). A Prospective Study on How Symptoms in a Network Predict the Onset of Depression. Psychotherapy and Psychosomatics, 85(3), 183–184. doi: 10.1159/000442001 [DOI] [PubMed] [Google Scholar]
- Burger J, Stroebe MS, Perrig-Chiello P, Schut HA, Spahni S, Eisma MC, & Fried EI (2020). Bereavement or breakup: Differences in networks of depression. Journal of Affective Disorders, 267, 1–8. [DOI] [PubMed] [Google Scholar]
- Chen J, & Chen Z (2008). Extended Bayesian information criteria for model selection with large model spaces. Biometrika, 95(3), 759–771. [Google Scholar]
- Cramer SC, & Riley JD (2008). Neuroplasticity and brain repair after stroke. Current opinion in neurology, 21(1), 76–82. [DOI] [PubMed] [Google Scholar]
- De Haan A, Landolt MA, Fried EI, Kleinke K, Alisic E, Bryant R, … Dalgleish T (2020). Dysfunctional posttraumatic cognitions, posttraumatic stress and depression in children and adolescents exposed to trauma: a network analysis. Journal of Child Psychology and Psychiatry, 61(1), 77–87. [DOI] [PMC free article] [PubMed] [Google Scholar]
- Epskamp S, Borsboom D, & Fried EI (2018). Estimating psychological networks and their accuracy: A tutorial paper. Behav Res Methods, 50(1), 195–212. doi: 10.3758/s13428-017-0862-1 [DOI] [PMC free article] [PubMed] [Google Scholar]
- Epskamp S, Cramer AO, Waldorp LJ, Schmittmann VD, & Borsboom D (2012). qgraph: Network visualizations of relationships in psychometric data. Journal of Statistical Software, 48(4), 1–18. [Google Scholar]
- Epskamp S, & Fried E (2015). bootnet: Bootstrap methods for various network estimation routines. R-Package. Available at: https://rdrr.io/cran/bootnet. [Google Scholar]
- Feigin VL, Norrving B, & Mensah GA (2017). Global burden of stroke. Circulation research, 120(3), 439–448. [DOI] [PubMed] [Google Scholar]
- Fried EI, & Cramer AO (2017). Moving forward: challenges and directions for psychopathological network theory and methodology. Perspectives on Psychological Science, 12(6), 999–1020. [DOI] [PubMed] [Google Scholar]
- Fried EI, Epskamp S, Nesse RM, Tuerlinckx F, & Borsboom D (2016). What are ‘good’ depression symptoms? Comparing the centrality of DSM and non-DSM symptoms of depression in a network analysis. J Affect Disord, 189, 314–320. doi: 10.1016/j.jad.2015.09.005 [DOI] [PubMed] [Google Scholar]
- Fried EI, & Nesse RM (2014). The impact of individual depressive symptoms on impairment of psychosocial functioning. PLoS One, 9(2), e90311–e90311. doi: 10.1371/journal.pone.0090311 [DOI] [PMC free article] [PubMed] [Google Scholar]
- Friedman J, Hastie T, & Tibshirani R (2014). glasso: Graphical lasso-estimation of Gaussian graphical models. R package version, 1. [Google Scholar]
- Funkhouser CJ, Chacko AA, Correa KA, Kaiser AJ, & Shankman SA (2020). Unique longitudinal relationships between symptoms of psychopathology in youth: A cross-lagged panel network analysis in the ABCD study. Journal of child psychology and psychiatry. [DOI] [PMC free article] [PubMed] [Google Scholar]
- Funkhouser CJ, Correa KA, Gorka SM, Nelson BD, Phan KL, & Shankman SA (2019). The replicability and generalizability of internalizing symptom networks across five samples. Journal of Abnormal Psychology. [DOI] [PMC free article] [PubMed] [Google Scholar]
- Gorelick PB (2019). The global burden of stroke: persistent and disabling. The Lancet Neurology, 18(5), 417–418. [DOI] [PubMed] [Google Scholar]
- Hackett ML, & Pickles K (2014). Part I: frequency of depression after stroke: an updated systematic review and meta-analysis of observational studies. International Journal of Stroke, 9(8), 1017–1025. [DOI] [PubMed] [Google Scholar]
- Hamilton M (1960). A rating scale for depression. Journal of neurology, neurosurgery, and psychiatry, 23(1), 56. [DOI] [PMC free article] [PubMed] [Google Scholar]
- Haslbeck JM, & Waldorp LJ (2018). How well do network models predict observations? On the importance of predictability in network models. Behavior Research Methods, 50(2), 853–861. [DOI] [PMC free article] [PubMed] [Google Scholar]
- House A, Knapp P, Bamford J, & Vail A (2001). Mortality at 12 and 24 months after stroke may be associated with depressive symptoms at 1 month. Stroke, 32(3), 696–701. [DOI] [PubMed] [Google Scholar]
- Keith RA (1987). The functional independent measure: a new tool for rehabilitation. Advance in clinical rehabilitation, 2, 6–18. [PubMed] [Google Scholar]
- Lewinsohn PM, Shankman SA, Gau JM, & Klein DN (2004). The prevalence and co-morbidity of subthreshold psychiatric conditions. Psychological medicine, 34(4), 613–622. [DOI] [PubMed] [Google Scholar]
- Lo Buono V, Corallo F, Bramanti P, & Marino S (2017). Coping strategies and health-related quality of life after stroke. Journal of health psychology, 22(1), 16–28. [DOI] [PubMed] [Google Scholar]
- McElroy E, Napoleone E, Wolpert M, & Patalay P (2019). Structure and Connectivity of Depressive Symptom Networks Corresponding to Early Treatment Response. EClinicalMedicine, 8, 29–36. doi: 10.1016/j.eclinm.2019.02.009 [DOI] [PMC free article] [PubMed] [Google Scholar]
- McGorry PD, Hickie IB, Yung AR, Pantelis C, & Jackson HJ (2006). Clinical staging of psychiatric disorders: A heuristic framework for choosing earlier, safer and more effective interventions. Australian and New Zealand Journal of Psychiatry, 40(8), 616–622. doi: 10.1111/j.1440-1614.2006.01860.x [DOI] [PubMed] [Google Scholar]
- McNally RJ, Robinaugh DJ, Wu GW, Wang L, Deserno MK, & Borsboom D (2015). Mental disorders as causal systems: A network approach to posttraumatic stress disorder. Clinical Psychological Science, 3(6), 836–849. [Google Scholar]
- Meader N, Moe-Byrne T, Llewellyn A, & Mitchell AJ (2014). Screening for poststroke major depression: a meta-analysis of diagnostic validity studies. J Neurol Neurosurg Psychiatry, 85(2), 198–206. [DOI] [PubMed] [Google Scholar]
- Moon JR, Huh J, Song J, Kang IS, Park SW, Chang SA, … & Jun TG (2017). The center for epidemiologic studies depression scale is an adequate screening instrument for depression and anxiety disorder in adults with congential heart disease. Health and quality of life outcomes, 15(1), 1–7. [DOI] [PMC free article] [PubMed] [Google Scholar]
- Ostir GV, Berges IM, Ottenbacher ME, Clow A, & Ottenbacher KJ (2008). Associations between positive emotion and recovery of functional status following stroke. Psychosomatic medicine, 70(4), 404. [DOI] [PMC free article] [PubMed] [Google Scholar]
- Ostir G, Ottenbacher K, & Kuo YF (2016). Stroke Recovery in Underserved Populations 2005–2006 [United States]. [Google Scholar]
- Paolucci S, Antonucci G, Grasso MG, Morelli D, Troisi E, Coiro P, … & Bragoni M (2001). Post-stroke depression, antidepressant treatment and rehabilitation results. Cerebrovascular diseases, 12(3), 264–271. [DOI] [PubMed] [Google Scholar]
- Radloff LS (1977). The CES-D scale: A self-report depression scale for research in the general population. Applied psychological measurement, 1(3), 385–401. [Google Scholar]
- Robinaugh DJ, LeBlanc NJ, Vuletich HA, & McNally RJ (2014). Network analysis of persistent complex bereavement disorder in conjugally bereaved adults. Journal of abnormal psychology, 123(3), 510. [DOI] [PMC free article] [PubMed] [Google Scholar]
- Robinaugh DJ, Millner AJ, & McNally RJ (2016). Identifying highly influential nodes in the complicated grief network. Journal of Abnormal Psychology, 125(6), 747. [DOI] [PMC free article] [PubMed] [Google Scholar]
- Robinson RG, & Jorge RE (2016). Post-Stroke Depression: A Review. Am J Psychiatry, 173(3), 221–231. doi: 10.1176/appi.ajp.2015.15030363 [DOI] [PubMed] [Google Scholar]
- Santos HP Jr., Kossakowski JJ, Schwartz TA, Beeber L, & Fried EI (2018). Longitudinal network structure of depression symptoms and self-efficacy in low-income mothers. PLoS One, 13(1), e0191675. doi: 10.1371/journal.pone.0191675 [DOI] [PMC free article] [PubMed] [Google Scholar]
- Saxena SK, Ng TP, Yong D, Fong NP, & Koh G (2008). Subthreshold depression and cognitive impairment but not demented in stroke patients during their rehabilitation. Acta Neurologica Scandinavica, 117(2), 133–140. [DOI] [PubMed] [Google Scholar]
- Schellekens MP, Wolvers MD, Schroevers MJ, Bootsma TI, Cramer AO, & van der Lee ML (2019). Exploring the interconnectedness of fatigue, depression, anxiety and potential risk and protective factors in cancer patients: a network approach. Journal of behavioral medicine, 1–11. [DOI] [PMC free article] [PubMed] [Google Scholar]
- Schweren L, van Borkulo CD, Fried E, & Goodyer IM (2018). Assessment of Symptom Network Density as a Prognostic Marker of Treatment Response in Adolescent Depression. JAMA Psychiatry, 75(1), 98–100. doi: 10.1001/jamapsychiatry.2017.3561 [DOI] [PMC free article] [PubMed] [Google Scholar]
- Shankman SA, Lewinsohn PM, Klein DN, Small JW, Seeley JR, & Altman SE (2009). Subthreshold conditions as precursors for full syndrome disorders: a 15‐year longitudinal study of multiple diagnostic classes. Journal of Child Psychology and Psychiatry, 50(12), 1485–1494. [DOI] [PMC free article] [PubMed] [Google Scholar]
- Sibolt G, Curtze S, Melkas S, Pohjasvaara T, Kaste M, Karhunen PJ, … Erkinjuntti T (2013). Post-stroke depression and depression-executive dysfunction syndrome are associated with recurrence of ischaemic stroke. Cerebrovascular Diseases, 36(5–6), 336–343. [DOI] [PubMed] [Google Scholar]
- Towfighi A, Ovbiagele B, El Husseini N, Hackett ML, Jorge RE, Kissela BM, … Outcomes R (2017). Poststroke Depression: A Scientific Statement for Healthcare Professionals From the American Heart Association/American Stroke Association. Stroke, 48(2), e30–e43. doi: 10.1161/STR.0000000000000113 [DOI] [PubMed] [Google Scholar]
- van Borkulo C, Boschloo L, Borsboom D, Penninx BW, Waldorp LJ, & Schoevers RA (2015). Association of Symptom Network Structure With the Course of [corrected] Depression. JAMA Psychiatry, 72(12), 1219–1226. doi: 10.1001/jamapsychiatry.2015.2079 [DOI] [PubMed] [Google Scholar]
- van Borkulo CD, Boschloo L, Kossakowski J, Tio P, Schoevers RA, Borsboom D, & Waldorp LJ (2017). Comparing network structures on three aspects: A permutation test. Manuscript submitted for publication. [DOI] [PubMed] [Google Scholar]
Associated Data
This section collects any data citations, data availability statements, or supplementary materials included in this article.