

Abstract
Introduction
We investigated relationships among genetic determinants of Alzheimer's disease (AD), amyloid/tau/neurodegenaration (ATN) biomarkers, and risk of dementia.
Methods
We studied cognitively normal individuals with subjective cognitive decline (SCD) from the Amsterdam Dementia Cohort and SCIENCe project. We examined associations between genetic variants and ATN biomarkers, and evaluated their predictive value for incident dementia. A polygenic risk score (PRS) was calculated based on 39 genetic variants. The APOE gene was not included in the PRS and was analyzed separately.
Results
The PRS and APOE ε4 were associated with amyloid‐positive ATN profiles, and APOE ε4 additionally with isolated increased tau (A–T+N–). A high PRS and APOE ε4 separately predicted AD dementia. Combined, a high PRS increased while a low PRS attenuated the risk associated with ε4 carriers.
Discussion
Genetic variants beyond APOE are clinically relevant and contribute to the pathophysiology of AD. In the future, a PRS might be used in individualized risk profiling.
Keywords: Alzheimer's disease, APOE, ATN classification, biomarkers, dementia, polygenic risk score, subjective cognitive decline
1. BACKGROUND
Neuropathologically, Alzheimer's disease (AD) is defined by the presence of amyloid beta (Aβ) plaques and neurofibrillary tau tangles.1 In vivo, a research framework for AD proposed that individuals can be categorized based on biomarker evidence of pathology. According to the ATN system, each individual is rated for the presence of Aβ (A), hyperphosphorylated tau (T), and neurodegeneration (N), resulting in eight possible biomarker combinations.2 This categorization is independent of the cognitive stage of the individual, and therefore, cognitively normal individuals can be identified who already harbor the first pathophysiological changes associated with AD, which is referred to as preclinical AD or stage 2 AD.3
It is important to identify which cognitively normal individuals, with or without subjective cognitive decline (SCD), are at risk of future cognitive deterioration. Research interest of secondary prevention trials is shifting increasingly to these early stages, because these individuals could potentially benefit most from disease‐modifying therapy. The ATN biomarkers—particularly biomarkers for amyloid pathology—predict cognitive decline and clinical progression.4, 5, 6 Genetics also have potential for risk estimation of clinical progression. The APOE ɛ4 allele is a strong genetic risk factor for AD, and it has been consistently linked to a higher amyloid burden.7 Besides APOE, many other genetic variants have been identified in recent years that are also associated with AD.8, 9, 10 Each of these genetic variants has a small individual effect, but combined in a polygenic risk score (PRS) they are able to differentiate individuals with AD dementia from healthy controls in population‐based studies.11, 12, 13 The extent to which a PRS is associated with biomarkers is less clear, as previous studies have provided contradictory results.14, 15, 16, 17, 18, 19
Genetic variants were associated with amyloid‐positive amyloid/tau/neurodegeneration (ATN) profiles.
A polygenic risk score (PRS) and APOE predicted Alzheimer's disease (AD) dementia.
A low PRS attenuated the risk of incident dementia associated with APOE ε4.
Genetic variants beyond APOE contribute to the pathophysiology of AD.
Our aim was to investigate the relationship between genetic risk factors for AD and the ATN classification in cognitively normal individuals presenting with worries about their memory at a memory clinic. Furthermore, we aimed to explore the relationship between genetic risk factors and clinical progression to dementia.
RESEARCH IN CONTEXT
1 Systematic Review: We reviewed the literature using traditional sources. While it is well established that APOE is related to amyloid status and risk of dementia, literature provided contradictory results regarding the relationship between a polygenic risk score (PRS) and biomarkers or risk of progression to dementia.
2 Interpretation: Our results show that not only APOE, but also an independently constructed PRS was associated with amyloid‐positive ATN profiles, and that APOE was associated with an isolated abnormal tau status (A–T+N–). The PRS added predictive value to APOE for risk of Alzheimer's disease (AD) dementia, in such a way that a high PRS increased the effect of APOE ε4, while a low PRS attenuated the APOE ε4 effect.
3 Future Directions: Genetic variants beyond APOE directly contribute to the pathophysiology of AD and affect the risk associated with APOE. Future studies are needed to explore how these variants can be used for individualized risk profiling.
2. METHODS
2.1. Population
We retrospectively studied 829 cognitively normal individuals with SCD from the Amsterdam Dementia Cohort and SCIENCe project (Subjective Cognitive Impairment Cohort).20 We selected all individuals with a baseline SCD diagnosis with available array genotyping, and availability of either ATN biomarkers, and/or follow‐up information. In the selection process, we excluded 113 individuals due to non‐European ancestry (population outliers) or due to close family relations, which led to a total sample size of 829 individuals (Figure 1). All individuals received a standardized diagnostic workup, which included a medical and neurological investigation, neuropsychological assessment, cerebrospinal fluid (CSF) analysis, and brain magnetic resonance imaging (MRI).20, 21 The Dutch Verhage system is used for the rating of education.22 In a multidisciplinary consensus meeting, individuals received the label of SCD when they were cognitively normal; that is, there were no formal deficits in cognition according to neuropsychological test scores and criteria for mild cognitive impairment (MCI) or dementia were not met, and when there was no other neurological or psychiatric condition that could cause their cognitive complaints.
FIGURE 1.
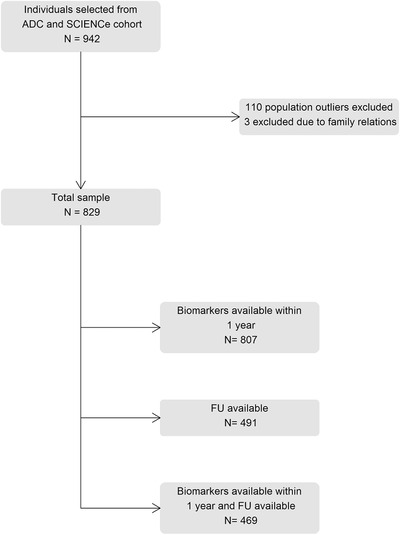
Flowchart of participant selection. ADC, Amsterdam Dementia Cohort; FU, follow‐up; SCD, subjective cognitive decline; SCIENCe, subjective cognitive impairment cohort
Eight hundred and seven individuals (97%) had any biomarker available within 1 year of baseline diagnosis (MRI, CSF, and/or positron emission tomography [PET]). For 491 individuals (59%), follow‐up assessments were available (4 ± 3 years). At follow‐up, clinical diagnoses were re‐assessed as SCD, MCI, AD dementia, or other types of dementia (including frontotemporal dementia [FTD], primary progressive aphasia [PPA], vascular dementia, dementia with Lewy bodies [DLB], progressive supranuclear palsy [PSP], and Huntington's disease).23, 24, 25, 26, 27, 28, 29 For 469 individuals (57%), both follow‐up diagnoses and baseline biomarkers were available. All patients gave written informed consent. The study was approved by the medical ethical committee of the VU University and was in accordance with the Declaration of Helsinki.
2.2. ATN classification
PET, CSF, and MRI procedures were similar to our previous study using the ATN classification in SCD.4 The following sections describe the procedures for the ATN classification in brief.
We used amyloid PET or CSF Aβ to define A, CSF hyperphosphorylated tau (p‐tau) to define T, and the medial temporal atrophy score (MTA) on MRI to define N. When both amyloid PET and CSF Aβ were available, the PET result was used to define A. We additionally clustered the eight biomarker profiles into three categories. The “normal AD biomarker” category consisted of the biomarker profile with all normal biomarkers (A–T—N–). “Non‐AD pathologic change” consisted of the remaining A– profiles (A—T–N+, A–T+N–, and A–T+N+). The “Alzheimer's continuum” consisted of all A+ profiles (A+T—N–, A+T–N+, A+T+N–, A+T+N+).1
Amyloid PET was available for 72 individuals within 1 year of baseline diagnosis ([18F]Florbetapir n = 13, [18F]Florbetaben n = 43, [18F]Flutemetamol n = 10 and [11C]‐PIB [Pittsburgh compound‐B]; n = 6). The following systems were used to acquire PET scans: Gemini TF PET‐CT, Ingenuity TF PET‐CT, and Ingenuity PET/MRI (Philips Healthcare). For [18F]Florbetapir30 and [11C]PIB imaging,31 a dynamic scanning protocol was used, for [18F]Florbetaben32 and [18F]Flutemetamol33 imaging, a static scanning protocol. A trained nuclear medicine physician (BvB) visually rated scans as “positive” or “negative.”
CSF was available in 644 individuals. A lumbar puncture was performed using a 25‐gauge needle and syringe. Concentrations of Aβ1‐42 were measured using an Innotest enzyme‐linked immunosorbent assay (ELISA; n = 636) or Elecsys assay (n = 8). The Innotest Aβ levels were corrected for the upward drift in CSF biomarker analyses that occurred over the years.34 We transformed the Aβ values obtained by Elecsys to the Innotest equivalent values using the following formula: Elecsys Aβ (pg/mL) = –365 + 1.87 × Innotest Aβ (pg/mL).35 Adjusted concentrations <813 pg/mL were considered abnormal. Tau phosphorylated threonine 181 (p‐tau) was measured using Innotest ELISAs (hTAU‐Ag and PhosphoTAU‐181p); concentrations >52 pg/mL were considered abnormal.
An MRI scan of the brain was available for 703 individuals (Siemens Avanto, n = 6; GE Discovery MR750, n = 14; Impact, n = 97; 3T Philips Ingenuity TF PET/MR system, n = 141; 1.5T GE Signa HDxt, n = 22; 3.0T GE Signa HDxt, n = 264; 1.5T Siemens Sonata, n = 25; 3T Toshiba Vantage Titan, n = 134). All scans were reviewed by an experienced neuroradiologist. Coronal T1‐weighted images were used for visual assessment of MTA (range 0 to 4). The left and right MTA scores were averaged, and age‐dependent cut‐off values were used. For individuals <65 years of age, an MTA score ≥1 was considered abnormal; for individuals ≥65 years, an MTA score ≥1.5 was considered abnormal.36
2.3. Genotyping and imputation procedures
We selected 39 genetic variants for which there was evidence of a significant association with AD from previous genome‐wide association studies (GWAS) and candidate‐gene studies (Table S1 in supporting information).8, 9, 10 All genetic variants in our cohort were determined by standard genotyping or imputation methods and we applied established quality control methods.37 All individuals were genotyped using Illumina Global Screening Array (GSAsharedCUSTOM_20018389_A2). We used high‐quality genotyping in all individuals (individual call rate >98%, variant call rate >98%). All individuals’ reported sex matched with their genetic sex. Variants that departed from Hardy–Weinberg equilibrium were excluded at P < 1 × 10⁻⁶. Genotypes were prepared for imputation using provided scripts (HRC‐1000G‐check‐bim.pl, https://www.well.ox.ac.uk/~wrayner/tools/) to compare variant ID, strand, and allele frequencies to the Haplotype Reference Panel (HRC v1.1, April 2016).38 Finally, all autosomal variants were submitted to the Sanger imputation server (https://imputation.sanger.ac.uk/). The server uses MACH3 to phase data and imputation to the reference panel was performed with Positional Burrows‐Wheeler Transform (PBWT).39 APOE was determined based on imputation.
We calculated a weighted individual PRS based on the 39 genetic variants that showed genome‐wide significant evidence of association with AD (Table S1). APOE was analyzed separately and was not included in the PRS. The selected variants were directly genotyped (median genotyping rate = 1) or imputed with high quality (median imputation score R² = 0.98). The PRSs were generated by multiplying the genotype dosage of each risk allele for each variant by its respective weight and then summing across all variants.40 We weighted this by the effect size from previous International Genomics of Alzheimer's Project (IGAP) studies (Table S1).8, 9 The PRS was normalized (mean = 0, standard deviation = 1).
2.4. Statistics
We performed logistic regression analysis to investigate the relationship between APOE ε4 or the PRS and biomarkers in the ATN classification. The first set of models included APOE ε4 (per allele) or PRS (z‐score) as predictor, and A status, T status, or N status as outcome (separate models). In addition, we performed multinomial logistic regression analyses with first the eight‐profile ATN classification as outcome, and second the three clustered ATN categories as outcome (A–T–N– reference for both analyses). We created a second set of logistic regression models that included both APOE ε4 and PRS as predictors in the same model. Next, we performed Cox proportional hazards analyses to assess the relationship between APOE ε4 or PRS and the risk of dementia. We studied progression to all‐type dementia, AD dementia, and non‐AD dementia as outcome separately. In the analyses with AD dementia as outcome, the individuals that progressed to other types of dementia were censored, and vice versa. We created a second set of Cox regression models that included both APOE ε4 and PRS as predictors in the same model.
We additionally investigated the combined predictive value of APOE ɛ4 and PRS. We first stratified the PRS into low and high (based on the median) and then constructed a four‐level variable: APOEε4−PRSlow (reference), APOEε4−PRShigh, APOEε4+PRSlow, APOEε4+PRShigh. We ran an additional analysis with this four‐level variable as predictor.
We corrected all logistic regression analyses for age, sex, and population substructure (principal components 1 to 10). The Cox proportional hazards models were additionally adjusted for baseline score on the Mini‐Mental State Examination (MMSE).
All analyses were done using R version 3.6.0. We used the survival package version 2.44.1‐1 for Cox proportional hazards analyses.
3. RESULTS
3.1. Demographics
At baseline, individuals were on average 60 ± 9 years old, 339 (41%) were female, and MMSE was 28 ± 2 (Table 1). The largest subgroup was that with normal AD biomarkers (57%), followed by non‐AD pathologic change (26%) and the Alzheimer's continuum (17%). Among the 491 individuals with available follow‐up, 41 (8%) received a diagnosis of dementia (AD dementia n = 25, other types of dementia n = 16).
TABLE 1.
Demographics
| Total | ||
|---|---|---|
| N = 829 | ||
| Demographics | Age, mean (SD) | 59.6 (8.8) |
| Sex, n (% female) | 339 (40.9) | |
| Education, median (IQR) | 6 (5‐6) | |
| MMSE, mean (SD) | 28.3 (1.6) | |
| Follow‐up | Follow‐up time in years, mean (SD) | 3.6 (2.8) |
| Progression to dementia | ||
| All‐type dementia, n (%) | 41 (8.4) | |
| AD dementia, n (%) | 25 (5.1) | |
| Other dementia, n (%) | 16 (3.3) | |
| Follow‐up information available n = 491 | ||
| Biomarkers | Amyloid status, n positive/n total (%) | 106/655 (16.2) |
| Tau status, n positive/n total (%) | 193/644 (30.0) | |
| Neurodegeneration status, n positive/n total (%) | 77/703 (11.0) |
Abbreviations: AD, Alzheimer's disease; IQR, interquartile range; SD, standard deviation; MMSE, Mini‐Mental State Examination.
Note: Baseline characteristics of the total sample.
3.2. Associations among the PRS, APOE ɛ4, and biomarkers
Using logistic regression models, we found that higher PRS was associated with increased likelihood of amyloid positivity (odds ratio [OR] 1.5 [95% confidence interval (CI) 1.2 to 2.0], Figure 2a), but not of tau positivity (OR 1.1 [0.9 to 1.4]) or positivity for neurodegeneration (OR 1.0 [0.8 to 1.3]). APOE ɛ4 was associated with both amyloid positivity (OR 3.5 [2.5 to 5.1], per allele) and tau positivity (OR 1.6 [1.2 to 2.1]), but not positivity for neurodegeneration (OR 1.4 [1.0 to 2.0]). When performing multinomial logistic regression with the eight‐profile ATN classification as outcome, we found that the PRS was associated with an increased likelihood of A+T–N– and A+T+N– compared to A–T–N– (OR 1.9 [1.3 to 2.9] and OR 1.8 [1.2 to 2.6], Figure 2b). APOE ɛ4 was associated with all A+ profiles, except for A+T+N+ (n = 6), as well as with an isolated abnormal tau (A–T+N–, OR 1.5 [1.0‐2.3]). Because the eight‐profile ATN classification comes with suboptimal power due to small sample sizes in certain profiles, we repeated the analyses with the three‐category ATN classification as outcome (Figure 2c). We found that a higher PRS was associated with higher odds of being classified in the Alzheimer's continuum (OR 1.6 [1.2 to 2.2]), but not with higher odds of non‐AD pathologic change (OR 1.1 [0.9 to 1.4]). APOE ɛ4 on the other hand, was associated with both Alzheimer's continuum (OR 4.2 [2.6 to 6.7]) and non‐AD pathologic change (1.5 [1.1 to 2.2]). When we repeated the analyses with APOE and PRS both as predictors in the models, results remained comparable (Table S2 in supporting information).
FIGURE 2.

Associations between genetic variants and biomarkers. Values given are odds ratio (95% confidence interval) corrected for age, sex, and population substructure, as estimated by logistic regression (predictor: APOE ε4 allele or normalized PRS; outcome: (A) dichotomous biomarker status for A, T, and N separately (reference = negative biomarker status), (B) eight‐profile ATN classification (reference = A–T–N–), (C) three‐category ATN classification (reference = Normal AD biomarkers). The odds ratio for the PRS reflects the odds of having an abnormal biomarker status or being classified in one of the ATN profiles with abnormal biomarkers, per one standard deviation increase in the PRS. APOE ε4 is per allele. * P‐value < .05. APOE, apolipoprotein E; ATN, amyloid/tau/neurodegeneration; OR, odds ratio; PRS, polygenic risk score
3.3. Progression to dementia
Next, we performed Cox proportional hazards analyses to investigate the association between genetic risk factors and the risk of dementia. A higher score on the PRS was not associated with a higher risk of all‐type dementia (hazard ratio [HR] 1.0 [95% CI 0.7 to 1.4], Table 2). However, when analyzing AD and non‐AD as separate outcomes, we found that a higher PRS predicted progression to AD dementia specifically (HR 1.7 [1.1 to 2.8], n progression = 25), while individuals with a higher PRS had a lower risk of non‐AD dementia (HR 0.5 [0.3 to 0.9], n progression = 16). Additionally, the APOE ɛ4 allele was associated with a higher risk of progression to all‐type dementia (HR 2.0 [1.3 to 3.2]). When AD dementia and other types of dementia were analyzed separately, the APOE ɛ4 allele was especially associated with a higher risk of AD dementia (HR 3.3 [1.7 to 6.3]), but not other types of dementia (HR 1.0 [0.4 to 2.3]). When we repeated the analyses with APOE and PRS both as predictors in the models, the relationship between the PRS and progression to AD dementia was not significant anymore, but results for APOE remained comparable (Table S3 in supporting information).
TABLE 2.
Association between genetic variants and risk of clinical progression
| PRS | APOE ε4 | ||||
|---|---|---|---|---|---|
| N | HR (95% CI) | P‐value | HR (95% CI) | P‐value | |
| Non‐dementia | 450 | ||||
| All‐type dementia | 41 | 1.0 (0.7–1.4) | 9.6 × 10⁻¹ | 2.0 (1.3–3.2) | 3.7 × 10⁻³ * |
| AD dementia | 25 | 1.7 (1.1–2.8) | 2.8 × 10⁻² * | 3.3 (1.7–6.3) | 4.6 × 10⁻⁴ * |
| Other dementia | 16 | 0.5 (0.3–0.9) | 2.2 × 10⁻² * | 1.0 (0.4–2.3) | 9.8 × 10⁻¹ |
Abbreviations: AD, Alzheimer's disease; APOE, apolipoprotein E; CI, confidence interval; HR, hazard ratio; MMSE, Mini‐Mental State Examination; PRS, polygenic risk score.
Notes: Values are obtained by Cox proportional hazard models, adjusted for age, sex, population substructure, and MMSE (predictor: APOE ε4 allele or normalized PRS, outcome: clinical progression to dementia). The HR associated with the PRS reflects the difference per one standard deviation increase in the PRS. APOE ε4 is per allele.
*P‐value < .05.
Next, we investigated the combined effect of APOE ε4 and PRS on risk of dementia. Based on a newly constructed four‐level variable (APOEε4−PRSlow as reference), we found that APOEε4+PRShigh had a higher risk of progression to AD dementia (Table 3, Figure 3). By contrast, in APOEε4+PRSlow the risk of progression was attenuated and became comparable to APOEε4−PRShigh. There were no associations with progression to all‐type dementia or non‐AD dementia.
TABLE 3.
Combined effect of APOE ɛ4 and PRS on risk of clinical progression to AD dementia
| Progression to all‐type dementia | Progression to AD dementia | Progression to non‐AD dementia | |||||
|---|---|---|---|---|---|---|---|
| Category | Total N | HR (95% CI) | P‐value | HR (95% CI) | P‐value | HR (95% CI) | P‐value |
| APOE ɛ4 non‐carrier low PRS | 158 | Ref | Ref | Ref | Ref | Ref | Ref |
| APOE ɛ4 non‐carrier high PRS | 134 | 0.5 (0.1–1.8) | 2.8 × 10⁻¹ | 1.7 (0.3–11.1) | 5.9 × 10⁻¹ | 0.1 (0.0–1.0) | 5.1 × 10‐2 |
| APOE ɛ4 carrier low PRS | 86 | 0.9 (0.3–2.3) | 7.6 × 10⁻¹ | 2.4 (0.3–18.0) | 3.9 × 10⁻¹ | 0.8 (0.2–3.2) | 7.5 × 10⁻¹ |
| APOE ɛ4 carrier high PRS | 109 | 1.7 (0.7–3.9) | 2.5 × 10⁻¹ | 4.8 (1.2–18.9) | 2.6 × 10⁻² * | 0.4 (0.1–1.8) | 2.2 × 10⁻¹ |
Abbreviations: AD, Alzheimer's disease; APOE, apolipoprotein E; CI, confidence interval; HR, hazard ratio; MMSE, Mini‐Mental State Examination; PRS, polygenic risk score.
Notes: Values are obtained by Cox proportional hazard models, adjusted for age, sex, population substructure, and MMSE (predictor: four‐level variable [1] APOE ɛ4 non‐carrier and low PRS, [2] APOE ɛ4 non‐carrier and high PRS, [3] APOE ɛ4 carrier and low PRS, and [4] APOE ɛ4 carrier and high PRS; outcome: clinical progression to dementia; reference: [1] APOE ɛ4 non‐carrier and low PRS). APOE ε4 status is determined by having one or two ε4 alleles, PRS status is based on median risk.
P‐value < .05.
FIGURE 3.
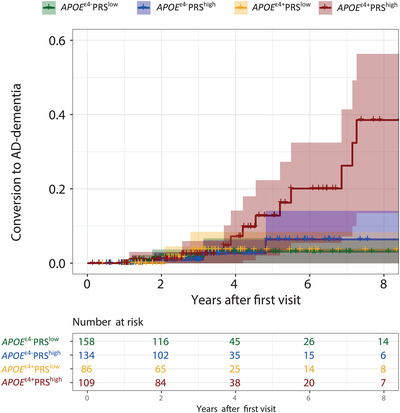
Combined effect of APOE ε4 and PRS on risk of clinical progression to AD dementia. Kaplan Meier curve showing the combined effects of APOE ε4 and the PRS on risk of progression to AD dementia, comparing (1) APOE ε4 non‐carrier and low PRS, (2) APOE ε4 non‐carrier and high PRS, (3) APOE ε4 carrier and low PRS, and (4) APOE ε4 carrier and high PRS. APOE ε4 status is determined by having one or two ε4 alleles, PRS status is based on median risk.AD, Alzheimer's disease; APOE, apolipoprotein E; PRS, polygenic risk score
4. DISCUSSIONS
The main finding of this study is that an AD PRS predicts biomarker pathology when distributed according to the ATN biomarker classification, independently of APOE. Furthermore, both APOE ɛ4 and the PRS are associated with risk of AD dementia. When combined we found that only carriers of the APOE ɛ4 allele who also had a high PRS specifically progressed to AD dementia, implying that the increased risk of APOE ɛ4 carriers can be “undone” by having a low PRS.
We found that a high AD PRS was associated with abnormal amyloid status and a higher risk of AD dementia. Former studies provided contradictory results about the relationship between the PRS and amyloid status. Discrepancies could be related to differences in disease stage, because amyloid positivity rates differ regarding diagnostic status. Furthermore, some studies found an association between a PRS without APOE and amyloid burden,15, 41, 42, 43 but in others the association was lost when APOE was not included in the PRS.14, 16, 44, 45 Similarly, literature is inconsistent about the relationship between the PRS and risk of AD dementia.11, 12, 13, 46, 47, 48, 49 Differences could be explained by the use of different populations, as studies that reported no increased risk of clinical progression used an MCI population,46 and others reported lower hazard ratios for MCI individuals compared to cognitively normal individuals.13, 49 Furthermore, the PRSs are not directly comparable, because a different number of single nucleotide polymorphisms (SNPs) is included in the different PRSs. The relationship between APOE and amyloid status has been firmly established.7, 14, 50 We extend those findings by showing not only an association between APOE and amyloid status, but also between APOE and tau status. As amyloid burden and p‐tau are closely related, the relationship between APOE and p‐tau could either be mediated through amyloid burden, or be amyloid independent. We found that APOE ε4 carriers have higher odds of being A–T+N– compared to A–T–N–. In line with literature, this suggests the additional involvement of amyloid‐independent pathways.51, 52, 53 Overall, our results provide evidence for the concept that genetic variants beyond APOE are associated with amyloid status, which is the crucial pathophysiological process underlying AD.
The risk of dementia associated with APOE and the PRS seemed to be additive, as individuals with both an ε4 allele and a high PRS had the highest risk of progression to AD dementia. In line with literature, carriers of the ε4 allele with a low PRS, or non‐carriers with a high PRS, had substantially lower risks. This implies that the genetic risk of AD dementia can be more accurately estimated when in addition to APOE, non‐APOE genetic variants are also considered. To date, genetic information, including APOE status, is not used for risk profiling in a clinical setting. Although it has been established that the ε4 allele is associated with a higher risk of dementia on a group level, these data do not easily translate to the individual, as not all ε4 carriers will develop dementia, while conversely also individuals without ε4 can develop dementia. We showed that taking into account all genetic variants associated with AD results in more accurate estimates of future AD dementia. In the future, taking into account one's genetic risk of AD could have clinical relevance, especially for individuals who present with worries about their memory at a memory clinic.
Limitations of our study include that the sample size in some ATN profiles was rather small. However, the three clustered ATN categories provided similar results, which confirms robustness of the findings. Furthermore, we based our PRS on current knowledge, but with increasing numbers of genetic studies, the number of variants in the PRS will also change. Comparing results across studies is complicated by the fact that each study uses a slightly different PRS. Using a more liberal threshold for inclusion of genetic variants in the PRS could lead to a higher disease prediction accuracy; however, an extremely liberal approach could also lead to the inclusion of non‐informative SNPs, which limits discrimination ability.54, 55, 56 In our PRS, we adopted a conservative approach and included only 39 genetic variants with genome‐wide significant evidence of association with AD. Also, the results might not be directly generalizable due to the fact that our population included solely individuals of European descent. Additionally, although the follow‐up duration in our study was relatively long, the conversion rates were low, as is expected in a cognitively normal population. It is important to note that the differences in conversion to dementia became apparent only after 3 to 4 years of follow‐up. With a longer follow‐up duration, the predictive value of genetic variants becomes more evident. Strengths of our study include that we have biomarker data used to define ATN categories in a large population of cognitively normal individuals. Individuals of the current study all presented at our memory clinic worrying about their memory and requesting information on likelihood of dementia in the future, which adds to the clinical relevance of our results. Our results are on a group level, but provide proof of principle that in the future, genetic information may inform individualized risk profiling. Furthermore, we tested the association between genetic variants and biomarkers using the ATN classification system, which has not been done before. With this approach, we used A–T–N– as a reference in our analyses, which enabled us to detect more specific associations than other studies that used a broader amyloid negative group as a reference, because this group could also include tau pathology or neurodegeneration.
In conclusion, we found that an AD‐specific PRS is associated with AD biomarkers, particularly amyloid positivity, independent of APOE ε4 in cognitively normal elderly. In addition, both PRS and APOE ɛ4 were associated with risk of AD dementia, in such a way that a low PRS attenuated the detrimental effect of APOE ε4. This could have implications for the selection of participants for trials, risk stratification, and personalized medicine. Genetic variants other than APOE should not be ignored, because they have a relevant contribution to the disease.
CONFLICTS OF INTEREST
Jarith L. Ebenau, Sven J. van der Lee, Marc Hulsman, Niccolò Tesi, Iris E. Jansen, Inge M.W. Verberk, and Mardou van Leeuwenstijn report no conflicts of interest. Charlotte E. Teunissen serves on the advisory board of Roche; performed contract research or received grants from AC‐Immune, ADxNeurosciences, Boehringer, Brainstorm Therapeutics, Celgene, EIP Pharma, PeopleBio, Vivoryon, Roche, Toyama Fujifilm, Esai, and Probiodrug; and received lecture fees from Biogen and Axon Neurosciences. Her research is supported by the European Commission (Marie Curie International Training Network, and JPND), Health Holland, the Dutch Research Council (ZonMW), Alzheimer Drug Discovery Foundation, The Selfridges Group Foundation, Alzheimer Netherlands, Alzheimer Association. CT is recipient of ABOARD, which is a public–private partnership receiving funding from ZonMW and Health∼Holland, Topsector Life Sciences & Health. ABOARD also receives funding from Edwin Bouw Fonds and Gieskes‐Strijbis fonds. CT has a collaboration contract with ADx Neurosciences and Quanterix. CT is editor at Alzheimer's Research & Therapy, Neurology: Neuroimmunology & Neuroinflammation and Medidact Neurology, and edited a volume in the series Neuromethods (Springer). Frederik Barkhof is a consultant for Biogen‐Idec, Bayer‐Schering, Merck‐Serono, Roche, NovartisIXICO, and Combinostics; has received sponsoring from European Commission‐Horizon 2020, National Institute for Health Research‐University College London Hospitals Biomedical Research Centre, TEVA, Novartis, and Biogen; and serves on the editorial boards of Radiology, Brain, Neuroradiology, Multiple Sclerosis Journal, and Neurology. Niels D. Prins is consultant to Boehringer Ingelheim, Aribio, and Amylyx. He is co‐PI of a study with Fuji Film Toyama Chemical. He serves on the DSMB of Abbvie's M15‐566 trial. NP has received a speaker fee from Biogen. Payments were made to his company. He is CEO and co‐owner of the Brain Research Center, the Netherlands. Philip Scheltens has acquired grant support (for the institution) from Biogen. In the past two years, he has received consultancy/speaker fees (paid to the institution) from Probiodrug Biogen, EIP Pharma, Merck AG. Henne Holstege received funding from Aegon, Health ∼ Holland, Hans und Ilse Breuer Stiftung, JPND research, 100‐plus enabling, and Alzheimer Nederland. All funding is paid to her institution. Bart N.M. van Berckel has received funding from ZonMW, the Netherlands Organization of Scientific Research, the Centre of Translational Molecular Imaging, and Avid Radiopharmaceuticals. All funding is paid to his institution. Wiesje M. van der Flier Research programs have been funded by ZonMW, NWO, EU‐FP7, EU‐JPND, Alzheimer Nederland, CardioVascular Onderzoek Nederland, Health∼Holland, Topsector Life Sciences & Health, stichting Dioraphte, Gieskes‐Strijbis fonds, stichting Equilibrio, Pasman stichting, Biogen MA Inc, Boehringer Ingelheim, Life‐MI, AVID, Roche BV, Fujifilm, Combinostics. WF holds the Pasman chair. WF has performed contract research for Biogen MA Inc and Boehringer Ingelheim. WF has been an invited speaker at Boehringer Ingelheim, Biogen MA Inc, Danone, Eisai, and WebMD Neurology (Medscape). WF is consultant to Oxford Health Policy Forum CIC, Roche, and Biogen MA Inc. WF is associate editor at Alzheimer's Research & Therapy. All funding is paid to her institution.
Supporting information
Supporting Information
ACKNOWLEDGMENTS
Research of the Alzheimer Center Amsterdam is part of the neurodegeneration research program of Amsterdam Neuroscience. The Alzheimer Center Amsterdam is supported by Stichting Alzheimer Nederland and Stichting VUmc fonds. The clinical database structure was developed with funding from Stichting Dioraphte. The SCIENCe project is supported by research grants from Gieskes‐Strijbis fonds and stichting Dioraphte. Wiesje van der Flier holds the Pasman chair. PET scans were funded by research grants from AVID and Piramal Neuroimaging. Frederik Barkhof is supported by the NIHR biomedical research center at UCLH. Genotyping was performed in the context of EADB (European Alzheimer DNA biobank) funded by the JPco‐fuND FP‐829‐029 (ZonMW projectnumber 733051061).
Ebenau JL, van der Lee SJ, Hulsman M, et al. Risk of dementia in APOE ε4 carriers is mitigated by a polygenic risk score. Alzheimer's Dement. 2021;13:e12229. 10.1002/dad2.12229
Jarith L. Ebenau and Sven J. van der Lee contributed equally to this study.
REFERENCES
- 1.Jack CR, Bennett DA, Blennow K, et al. NIA‐AA research framework: toward a biological definition of Alzheimer's disease. Alzheimers Dement. 2018;14:535‐562. [DOI] [PMC free article] [PubMed] [Google Scholar]
- 2.Jack CR, Bennett DA, Blennow K, et al. A/T/N: an unbiased descriptive classification scheme for Alzheimer disease biomarkers. Neurology. 2016;87:539‐547. [DOI] [PMC free article] [PubMed] [Google Scholar]
- 3.Jansen WJ, Ossenkoppele R, Knol DL, et al. Prevalence of cerebral amyloid pathology in persons without dementia: a meta‐analysis. JAMA. 2015;313:1924‐1938. [DOI] [PMC free article] [PubMed] [Google Scholar]
- 4.Ebenau JL, Timmers T, Wesselman LMP, et al. ATN classification and clinical progression in subjective cognitive decline: the SCIENCe project. Neurology. 2020;95:e46‐e58. [DOI] [PMC free article] [PubMed] [Google Scholar]
- 5.Jack CR Jr, Wiste HJ, Therneau TM, et al. Associations of amyloid, tau, and neurodegeneration biomarker profiles with rates of memory decline among individuals without dementia amyloid, tau, and neurodegeneration biomarker profiles and memory decline in individuals without dementia amyloid, tau, and neurodegeneration biomarker profiles and memory decline in individuals without dementia. JAMA. 2019;321:2316‐2325. [DOI] [PMC free article] [PubMed] [Google Scholar]
- 6.Soldan A, Pettigrew C, Fagan AM, et al. ATN profiles among cognitively normal individuals and longitudinal cognitive outcomes. Neurology. 2019;92:e1567‐e79. [DOI] [PMC free article] [PubMed] [Google Scholar]
- 7.Ali JI, Smart CM, Gawryluk JR. Subjective cognitive decline and APOE ɛ4: a systematic review. J Alzheimers Dis. 2018;65:303‐320. [DOI] [PubMed] [Google Scholar]
- 8.Kunkle BW, Grenier‐Boley B, Sims R, et al. Genetic meta‐analysis of diagnosed Alzheimer's disease identifies new risk loci and implicates Aβ, tau, immunity and lipid processing. Nat Genet. 2019;51:414‐430. [DOI] [PMC free article] [PubMed] [Google Scholar]
- 9.Sims R, van der Lee SJ, Naj AC, et al. Rare coding variants in PLCG2, ABI3, and TREM2 implicate microglial‐mediated innate immunity in Alzheimer's disease. Nat Genet. 2017;49:1373‐1384. [DOI] [PMC free article] [PubMed] [Google Scholar]
- 10.de Rojas I, Moreno‐Grau S, Tesí N, et al. Common variants in Alzheimer's disease and risk stratification by polygenic risk score. Nat Commun. 2021;12:3417. [DOI] [PMC free article] [PubMed] [Google Scholar]
- 11.Chouraki V, Reitz C, Maury F, et al. Evaluation of a genetic risk score to improve risk prediction for Alzheimer's disease. J Alzheimers Dis. 2016;53:921‐932. [DOI] [PMC free article] [PubMed] [Google Scholar]
- 12.van der Lee SJ, Wolters FJ, Ikram MK, et al. The effect of APOE and other common genetic variants on the onset of Alzheimer's disease and dementia: a community‐based cohort study. Lancet Neurol. 2018;17:434‐444. [DOI] [PubMed] [Google Scholar]
- 13.Tan CH, Hyman BT, Tan JJX, et al. Polygenic hazard scores in preclinical Alzheimer disease. Ann Neurol. 2017;82:484‐488. [DOI] [PMC free article] [PubMed] [Google Scholar]
- 14.Sleegers K, Bettens K, De Roeck A, et al. A 22‐single nucleotide polymorphism Alzheimer's disease risk score correlates with family history, onset age, and cerebrospinal fluid Aβ42. Alzheimers Dement. 2015;11:1452‐1460. [DOI] [PubMed] [Google Scholar]
- 15.Tan CH, Fan CC, Mormino EC, et al. Polygenic hazard score: an enrichment marker for Alzheimer's associated amyloid and tau deposition. Acta Neuropathol. 2018;135:85‐93. [DOI] [PMC free article] [PubMed] [Google Scholar]
- 16.Darst BF, Koscik RL, Racine AM, et al. Pathway‐specific polygenic risk scores as predictors of amyloid‐β deposition and cognitive function in a sample at increased risk for Alzheimer's disease. J Alzheimers Dis. 2017;55:473‐484. [DOI] [PMC free article] [PubMed] [Google Scholar]
- 17.Skoog I, Kern S, Najar J, et al. A non‐APOE polygenic risk score for Alzheimer's disease is associated with cerebrospinal fluid neurofilament light in a representative sample of cognitively unimpaired 70‐year olds. J Gerontol A Biol Sci Med Sci. 2021;76:983‐990. [DOI] [PMC free article] [PubMed] [Google Scholar]
- 18.Porter T, Burnham SC, Milicic L, et al. Utility of an Alzheimer's disease risk‐weighted polygenic risk score for predicting rates of cognitive decline in preclinical Alzheimer's disease: a prospective longitudinal study. J Alzheimers Dis. 2018;66:1193‐1211. [DOI] [PubMed] [Google Scholar]
- 19.Mormino EC, Sperling RA, Holmes AJ, et al. Polygenic risk of Alzheimer disease is associated with early‐ and late‐life processes. Neurology. 2016;87:481‐488. [DOI] [PMC free article] [PubMed] [Google Scholar]
- 20.van der Flier WM, Scheltens P. Amsterdam dementia cohort: performing research to optimize care. J Alzheimers Dis. 2018;62:1091‐1111. [DOI] [PMC free article] [PubMed] [Google Scholar]
- 21.van der Flier WM, Pijnenburg YA, Prins N, et al. Optimizing patient care and research: the Amsterdam Dementia Cohort. J Alzheimers Dis. 2014;41:313‐327. [DOI] [PubMed] [Google Scholar]
- 22.Verhage F, Van Der Werff JJ. An analysis of variance based on the groninger intelligence test scores. Ned Tijdschr Psychol. 1964;19:497‐509. [PubMed] [Google Scholar]
- 23.McKhann GM, Knopman DS, Chertkow H, et al. The diagnosis of dementia due to Alzheimer's disease: recommendations from the National Institute on Aging‐Alzheimer's Association workgroups on diagnostic guidelines for Alzheimer's disease. Alzheimers Dement. 2011;7:263‐269. [DOI] [PMC free article] [PubMed] [Google Scholar]
- 24.Rascovsky K, Hodges JR, Knopman D, et al. Sensitivity of revised diagnostic criteria for the behavioural variant of frontotemporal dementia. Brain. 2011;134:2456‐2477. [DOI] [PMC free article] [PubMed] [Google Scholar]
- 25.Gorno‐Tempini ML, Hillis AE, Weintraub S, et al. Classification of primary progressive aphasia and its variants. Neurology. 2011;76:1006‐1014. [DOI] [PMC free article] [PubMed] [Google Scholar]
- 26.Gorelick PB, Scuteri A, Black SE, et al. Vascular contributions to cognitive impairment and dementia: a statement for healthcare professionals from the american heart association/american stroke association. Stroke. 2011;42:2672‐2713. [DOI] [PMC free article] [PubMed] [Google Scholar]
- 27.McKeith IG, Boeve BF, Dickson DW, et al. Diagnosis and management of dementia with Lewy bodies: fourth consensus report of the DLB Consortium. Neurology. 2017;89:88‐100. [DOI] [PMC free article] [PubMed] [Google Scholar]
- 28.Höglinger GU, Respondek G, Stamelou M, et al. Clinical diagnosis of progressive supranuclear palsy: the movement disorder society criteria. Mov Disord. 2017;32:853‐864. [DOI] [PMC free article] [PubMed] [Google Scholar]
- 29.Reilmann R, Leavitt BR, Ross CA. Diagnostic criteria for Huntington's disease based on natural history. Mov Disord. 2014;29:1335‐1341. [DOI] [PubMed] [Google Scholar]
- 30.Slot RER, Verfaillie SCJ, Overbeek JM, et al. Subjective Cognitive Impairment Cohort (SCIENCe): study design and first results. Alzheimers Res Ther. 2018;10:76. [DOI] [PMC free article] [PubMed] [Google Scholar]
- 31.Ossenkoppele R, Zwan MD, Tolboom N, et al. Amyloid burden and metabolic function in early‐onset Alzheimer's disease: parietal lobe involvement. Brain. 2012;135:2115‐2125. [DOI] [PubMed] [Google Scholar]
- 32.de Wilde A, van Maurik IS, Kunneman M, et al. Alzheimer's biomarkers in daily practice (ABIDE) project: rationale and design. Alzheimer's Dement. 2017;6:143‐151. [DOI] [PMC free article] [PubMed] [Google Scholar]
- 33.Zwan MD, Bouwman FH, Konijnenberg E, et al. Diagnostic impact of [(18)F]flutemetamol PET in early‐onset dementia. Alzheimers Res Ther. 2017;9:2. [DOI] [PMC free article] [PubMed] [Google Scholar]
- 34.Tijms BM, Willemse EAJ, Zwan MD, et al. Unbiased approach to counteract upward drift in cerebrospinal fluid amyloid‐beta 1‐42 analysis results. Clin Chem. 2018;64:576‐585. [DOI] [PubMed] [Google Scholar]
- 35.Willemse EAJ, van Maurik IS, Tijms BM, et al. Diagnostic performance of Elecsys immunoassays for cerebrospinal fluid Alzheimer's disease biomarkers in a nonacademic, multicenter memory clinic cohort: the ABIDE project. Alzheimer's Dement. 2018;10:563‐572. [DOI] [PMC free article] [PubMed] [Google Scholar]
- 36.Rhodius‐Meester HFM, Benedictus MR, Wattjes MP, et al. MRI visual ratings of brain atrophy and white matter hyperintensities across the spectrum of cognitive decline are differently affected by age and diagnosis. Front Aging Neurosci. 2017;9:117. [DOI] [PMC free article] [PubMed] [Google Scholar]
- 37.Tesi N, van der Lee SJ, Hulsman M, et al. Centenarian controls increase variant effect sizes by an average twofold in an extreme case‐extreme control analysis of Alzheimer's disease. Eur J Hum Genet. 2019;27:244‐253. [DOI] [PMC free article] [PubMed] [Google Scholar]
- 38.McCarthy S, Das S, Kretzschmar W, et al. A reference panel of 64,976 haplotypes for genotype imputation. Nat Genet. 2016;48:1279‐1283. [DOI] [PMC free article] [PubMed] [Google Scholar]
- 39.Durbin R. Efficient haplotype matching and storage using the positional Burrows‐Wheeler transform (PBWT). Bioinformatics. 2014;30:1266‐1272. [DOI] [PMC free article] [PubMed] [Google Scholar]
- 40.Dudbridge F. Power and predictive accuracy of polygenic risk scores. PLos Genet. 2013;9:e1003348. [DOI] [PMC free article] [PubMed] [Google Scholar]
- 41.Cruchaga C, Del‐Aguila JL, Saef B, et al. Polygenic risk score of sporadic late‐onset Alzheimer's disease reveals a shared architecture with the familial and early‐onset forms. Alzheimers Dement. 2018;14:205‐214. [DOI] [PMC free article] [PubMed] [Google Scholar]
- 42.Sabuncu MR, Buckner RL, Smoller JW, Lee PH, Fischl B, Sperling RA. The association between a polygenic Alzheimer score and cortical thickness in clinically normal subjects. Cereb Cortex. 2012;22:2653‐2661. [DOI] [PMC free article] [PubMed] [Google Scholar]
- 43.Martiskainen H, Helisalmi S, Viswanathan J, et al. Effects of Alzheimer's disease‐associated risk loci on cerebrospinal fluid biomarkers and disease progression: a polygenic risk score approach. J Alzheimers Dis. 2015;43:565‐573. [DOI] [PubMed] [Google Scholar]
- 44.Ge T, Sabuncu MR, Smoller JW, Sperling RA, Mormino EC. Dissociable influences of APOE ε4 and polygenic risk of AD dementia on amyloid and cognition. Neurology. 2018;90:e1605‐e1612. [DOI] [PMC free article] [PubMed] [Google Scholar]
- 45.Leonenko G, Shoai M, Bellou E, et al. Genetic risk for alzheimer disease is distinct from genetic risk for amyloid deposition. Ann Neurol. 2019;86:427‐435. [DOI] [PMC free article] [PubMed] [Google Scholar]
- 46.Lacour A, Espinosa A, Louwersheimer E, et al. Genome‐wide significant risk factors for Alzheimer's disease: role in progression to dementia due to Alzheimer's disease among subjects with mild cognitive impairment. Mol Psychiatry. 2017;22:153‐160. [DOI] [PMC free article] [PubMed] [Google Scholar]
- 47.Rodríguez‐Rodríguez E, Sánchez‐Juan P, Vázquez‐Higuera JL, et al. Genetic risk score predicting accelerated progression from mild cognitive impairment to Alzheimer's disease. J Neural Transm. 2013;120:807‐812. [DOI] [PubMed] [Google Scholar]
- 48.Ahmad S, Bannister C, van der Lee SJ, et al. Disentangling the biological pathways involved in early features of Alzheimer's disease in the Rotterdam Study. Alzheimers Dement. 2018;14:848‐857. [DOI] [PubMed] [Google Scholar]
- 49.Adams HHH, de Bruijn RFAG, Hofman A, et al. Genetic risk of neurodegenerative diseases is associated with mild cognitive impairment and conversion to dementia. Alzheimers Dement. 2015;11:1277‐1285. [DOI] [PubMed] [Google Scholar]
- 50.Lopresti BJ, Campbell EM, Yu Z, et al. Influence of apolipoprotein‐E genotype on brain amyloid load and longitudinal trajectories. Neurobiol Aging. 2020;94:111‐120. [DOI] [PMC free article] [PubMed] [Google Scholar]
- 51.Slot RER, Kester MI, Van Harten AC, et al. ApoE and clusterin CSF levels influence associations between APOE genotype and changes in CSF tau, but not CSF Aβ42, levels in non‐demented elderly. Neurobiol Aging. 2019;79:101‐109. [DOI] [PubMed] [Google Scholar]
- 52.van der Kant R, Goldstein LSB, Ossenkoppele R. Amyloid‐β‐independent regulators of tau pathology in Alzheimer disease. Nat Rev Neurosci. 2020;21:21‐35. [DOI] [PubMed] [Google Scholar]
- 53.Sims R, Hill M, Williams J. The multiplex model of the genetics of Alzheimer's disease. Nat Neurosci. 2020;23:311‐322. [DOI] [PubMed] [Google Scholar]
- 54.Stocker H, Möllers T, Perna L, Brenner H. The genetic risk of Alzheimer's disease beyond APOE ε4: systematic review of Alzheimer's genetic risk scores. Transl Psychiatry. 2018;8:166. [DOI] [PMC free article] [PubMed] [Google Scholar]
- 55.Escott‐Price V, Sims R, Bannister C, et al. Common polygenic variation enhances risk prediction for Alzheimer's disease. Brain. 2015;138:3673‐3684. [DOI] [PMC free article] [PubMed] [Google Scholar]
- 56.Zhang Q, Sidorenko J, Couvy‐Duchesne B, et al. Risk prediction of late‐onset Alzheimer's disease implies an oligogenic architecture. Nat Commun. 2020;11:4799. [DOI] [PMC free article] [PubMed] [Google Scholar]
Associated Data
This section collects any data citations, data availability statements, or supplementary materials included in this article.
Supplementary Materials
Supporting Information