

Abstract
Consensus blood pressure guidelines vary in their recommended ambulatory blood pressure targets for children with chronic kidney disease (CKD) due to limited research in this area. We analyzed longitudinal ambulatory blood pressure monitoring data from 679 children with moderate CKD enrolled in the observational CKiD cohort by time-varying mean arterial pressure (MAP) percentile categories based on highest wake or sleep MAP percentile. Analyses were stratified by non-glomerular and glomerular diagnoses, with three models constructed: unadjusted, adjusted for age, gender, and race, and additional adjustment for proteinuria. The outcome of interest was time to renal replacement therapy or 50% decline in baseline renal function. We found that among children with non-glomerular CKD, MAP percentile was not associated with accelerated disease progression risk until after 4 years of follow-up at which point a high MAP (>90th percentile) was associated with a higher risk of progression to the composite endpoint (HR 1.88, CI 1.03, 3.44). Among those with glomerular CKD, differential risk for progression began from baseline with the highest risk in those with MAP >90th percentile (HR 3.23, CI 1.34, 7.79). These relationships were attenuated somewhat after adjustment for level of proteinuria but the trend for higher MAP being associated with higher risk of progression remained significant. Thus, in children with CKD, having ambulatory wake or sleep MAP >90th percentile was associated with higher risk of kidney disease progression with the highest levels of MAP associated with the greatest risk of progression.
Clinical Trials Registration: NCT00327860
Keywords: blood pressure monitoring, ambulatory, mean arterial pressure, disease progression, chronic kidney disease, pediatrics
Introduction
Hypertension is common in children with chronic kidney disease (CKD) with a prevalence of ambulatory hypertension of 49–63% in children in the Chronic Kidney Disease in Children (CKiD) study.1,2 Along with being a risk factor for left ventricular hypertrophy,3,4 and increased carotid intima-media thickness,5,6 hypertension is also an independent risk factor for kidney disease progression.7–9 Yet there is still debate about optimal blood pressure targets to slow kidney disease progression and recommendations vary across guidelines.10–12
The Effect of Strict Blood Pressure Control and ACE Inhibition on Progression of Chronic Renal Failure in Pediatric Patients (ESCAPE) trial provided the primary evidence for blood pressure management among children with hypertension and CKD. This randomized controlled trial with fixed dose angiotensin-converting enzyme inhibitor (ACEi) usage compared outcomes with intensified blood pressure control (<50th percentile) to conventional control (50th to 90th percentile) based on 24-hour mean arterial pressure (MAP) by ambulatory blood pressure monitoring (ABPM).9 In this study, intensified blood pressure control slowed kidney disease progression compared to conventional control at 5-year follow-up. The analysis was complicated somewhat by the fact that more than half of the patients in the conventional blood pressure group reached the intensified blood pressure target.9 Interestingly, based on post-hoc analysis of the data by the ESCAPE authors, subsequent target blood pressure recommendations from the European Society of Hypertension (ESH) suggest aiming for an ambulatory blood pressure of <75th percentile in children with CKD and the lower goal of <50th percentile only in children with CKD who also had proteinuria.12 However, results from this trial were not replicated by additional studies prior to adopting the blood pressure targets within various guidelines. In addition, it is not known if the same blood pressure targets are appropriate for a general CKD population including those who are hypertensive, controlled hypertensive, and naturally normotensive.
Early analysis of casual blood pressures of children in the CKiD study showed a similar trend with kidney disease progression. Children with baseline casual hypertension or who became hypertensive over follow-up had a faster rate of renal disease progression compared to those who did not have hypertension.13 Initial analysis of ABPM data from CKiD showed that a one standard deviation decrease in GFR over one year was associated with increased odds of having an abnormal ABPM.1 Additional longitudinal CKiD data are now available, and in light of findings from the ESCAPE trial, we sought to investigate what achieved levels of ambulatory blood pressure control were associated with a lower risk of kidney disease progression in the observational setting of the CKiD cohort. Specifically, the aim of this study was to describe the relationship between low-normal ambulatory MAP (<50th percentile), conventional MAP (50th to <75th and 75th to 90th percentiles) and high MAP (>90th percentile) with CKD progression in the CKiD study. To avoid misclassification of total (i.e., wake and sleep) MAP due to nocturnal blood pressure abnormalities, the primary exposure of interest was the highest wake or sleep MAP percentile category.
Methods
Study population
The CKiD cohort is an ongoing observational study of pediatric CKD based across 56 sites in the United States and Canada. 891 children aged 1 to 16 with a diagnosis of CKD and an estimated glomerular filtration rate (eGFR) between 30 and 90 mL/min per 1.73m2 were enrolled prior to April 2014. Annual study visits collected demographic, general health and clinical data including renal function, growth and cardiovascular health with data collection and storage at a central data coordinating center. The data that support the findings of this study are available from the data coordinating center upon reasonable request. The study design, methods and exclusion criteria have been described previously.14 The study was approved by the National Institute of Diabetes and Digestive and Kidney Diseases and the Institutional Review Boards at each participating site. Participating patients and/or families gave written informed consent and/or assent. CKiD provides available data to collaborators through the National Institute of Diabetes and Digestive and Kidney Diseases Central Repository (https://www.niddkrepository.org/home/).
Exposure
Twenty-four hour ABPM was conducted every 2 years (i.e., visit 2, 4, 6, etc. after study enrollment), using a SpaceLabs 90217 monitor (SpaceLabs Healthcare, Issaquah, WA). ABPM was coordinated and analyzed by a single ABPM center and a detailed description of the ABPM protocol has been previously described.1,15 Analysis of the main and current study are compared in Supplemental Table S1 (please see http://hyper.ahajournals.org). The primary exposure of interest was the highest wake or sleep MAP percentile category based on the normal population data16 and calculated for wake and sleep periods based on participant- or parent-reported diaries. We chose to analyze wake and sleep MAP separately given the known high prevalence of masked hypertension based on sleep blood pressure in CKD.1 MAP percentile categories were based on sex- and height-specific thresholds: <50th percentile, 50th to <75th percentile, 75th to 90th percentile and >90th percentile. The distributions of wake and sleep MAP percentile categories are provided in Supplemental Table S2 (please see http://hyper.ahajournals.org). In addition, the MAP category of each participant was allowed to vary over time (i.e., updated with each ABPM measurement), capitalizing on available longitudinal data.17,18 590 participants had an ABPM at the baseline visit. A total of 679 participants provided at least one MAP measurement. ABPM measurement compliance at each study visit is provided in Supplemental Figure S1 (please see http://hyper.ahajournals.org). There were 89 participants who contributed their first ABPM study at least two years after their baseline visit. Since this was a substantial period between two measurements, these participants were analytically handled through late entry methods.19 These standard methods were used to deal with survivorship bias for valid estimation of the survival functions and risk quantified by hazard ratios using Cox models. Specifically, handling left-truncated data appropriately reweighted the observed population as an imputation process to estimate an unobserved population of individuals who would have had an event prior to entering the study.20 Most participants (>80%) in each diagnosis group did not enter late, but this accounted for individuals who had rapid progression prior to the fourth year of study participation, when the second ABPM would have been obtained.
Outcome
The primary outcome was time from baseline to a composite event defined as the earliest occurrence of renal replacement therapy (RRT, either dialysis or kidney transplant) or 50% decline in eGFR21 from baseline. Those without the event were censored at the last observed event-free time. Baseline was based on participant entry into the CKiD study and was not time of diagnosis for the majority of participants. Baseline for the analysis was defined as the time at the first ABPM measurement by protocol, which in most cases was about 1 year after CKiD study entry by study design, and incorporated late entries for those whose first ABPM occurred 4 years after study entry. Since eGFR was determined at each annual study visit, the time at which 50% decline in baseline eGFR occurred was estimated from a linear interpolation between two adjacent eGFR measurements, in which the first and second eGFR were above and below the individual-specific threshold of 50% decline from baseline, respectively.
Covariates
CKD diagnosis was categorized as an underlying glomerular or non-glomerular pathology. A full list of diagnoses has been previously described22 and the distribution of the diagnoses for this analysis is provided in Supplemental Table S3 (please see http://hyper.ahajournals.org). Previous work has documented the distinct disease courses by diagnosis22,23 and all analyses were stratified by glomerular and non-glomerular groups. Key demographic variables included age at entry, sex and race. Proteinuria was defined as urine protein:creatinine ratio (mg/mg) and was measured at the same study visit as ABPM. Specific antihypertensive therapy use in the last 30 days was participant/family reported at each annual visit, and confirmed by study coordinators.
Statistical methods
Descriptive statistics of demographic, clinical and CKD-specific variables are presented as medians and interquartile ranges for continuous variables, and as percentages for categorical variables; these are compared across MAP categories at the time of first available visit (including those who entered late). P-values were based on Wilcoxon rank sum tests for continuous variables and Chi-squared tests (or Fisher’s exact test) for categorical variables.
Time to the composite outcome was described by Kaplan-Meier estimates and incorporated time-updated MAP categories. Semi-parametric Cox models summarized hazard ratios (HR) groups (with MAP 75–90th percentile as the reference category). Based on the Kaplan-Meier estimates, time-varying risk was identified and incorporated into Cox models for those with a non-glomerular diagnosis. The Kaplan-Meier plot indicated deviation from proportional hazards assumption among the non-glomerular group, thus needing to stratify by time. Specifically, the effect of the MAP exposure categories was allowed to vary by time: within 4 years from baseline and after 4 years from baseline. Within each window the hazards were assumed to be proportional across categories of MAP. Three Cox models were fit for each diagnosis group: the first was unadjusted (i.e., no covariates), the second was adjusted for age at baseline, gender, and race; and the third was additionally adjusted for proteinuria ( 0.5 vs. > 0.5 mg/mg creatinine to be consistent with the ESCAPE analysis). Unadjusted Kaplan-Meier and HR estimates provided an overview of these data and context for the influence of potential confounders.24 Proteinuria category was included as a time-varying variable.
Person-time was apportioned to the observed MAP category that corresponded with participant study visits and hazard ratios described risk associated with time-varying MAP category. 17,18,25
To describe the use of ACEi/ARB (angiotensin receptor blocker) therapy over time by blood pressure control in this population, graphical depictions of the proportions of therapy use by study visit and MAP categories were presented as diamond graphs.26
Statistical significance was assessed at the 0.05 level. All analyses and graphics were performed using SAS 9.4 statistical software (SAS Institute, Cary, NC) and R 3.4.2 (R Core Team, Vienna, Austria).
Results
Of 891 children enrolled in CKiD, 679 completed at least one research quality ABPM study. Of these, a total of 489 children (1036 person-visits, median length of follow-up: 4.3 [IQR 3.0, 7.2] years) had an underlying non-glomerular form of chronic kidney disease and 190 (313 person-visits, median length of follow-up: 2.4 [IQR 1.5, 4.0] years) had a glomerular diagnosis. Table 1 displays characteristics by CKD diagnosis and MAP categories at the first available visit with the vast majority (77% to 94%) occurring at 1 year after study enrollment. Among those with non-glomerular CKD, the median age was 11 years (65% boys) and for those with glomerular CKD, the median age was 15 years (50% boys). Children with glomerular CKD had a shorter duration of CKD (median time 5 vs. 11 years) compared to children with non-glomerular disease.
Table 1.
Clinical and demographic characteristics of study populations, stratified by non-glomerular and glomerular diagnosis and mean arterial pressure (MAP) percentile categories, at first available visit. Median [interquartile range] or % (N).
| Non-glomerular | Glomerular | |||||||||
|---|---|---|---|---|---|---|---|---|---|---|
| Variable | MAP < 50th N=91 |
MAP 50th – 75th N=88 |
MAP 75th – 90th N=116 |
MAP > 90th N=194 |
P Value | MAP < 50th N=51 |
MAP 50th – 75th N=35 |
MAP 75th – 90th N=33 |
MAP > 90th N=71 |
P Value |
|
| ||||||||||
| First ABPM by protocol (Visit 2) | 86.8% (79) | 77.3% (68) | 81.9% (95) | 88.7% (172) | 0.069 | 94.1% (48) | 94.3% (33) | 93.9% (31) | 90.1% (64) | 0.793 |
| Age, years |
12.1 [9.6, 14.9] |
12.7 [8.4, 15.4] |
10.4 [7.5, 13.9] |
11.4 [8.6, 15.3] |
0.038 | 15.7 [13.5, 16.9] |
14.3 [10.0, 17.0] |
15.3 [11.9, 17.2] |
15.5 [11.1, 17.0] |
0.688 |
| Male | 62.6% (57) | 65.9% (58) | 69.0% (80) | 63.4% (123) | 0.735 | 49.0% (25) | 45.7% (16) | 60.6% (20) | 46.5% (33) | 0.553 |
| African American race | 5.5% (5) | 14.8% (13) | 12.9% (15) | 26.8% (52) | <0.001 | 21.6% (11) | 22.9% (8) | 27.3% (9) | 33.8% (24) | 0.440 |
| Height percentile | 32.0 [7.9, 61.3] |
30.6 [9.3, 60.4] |
26.8 [10.9, 60.8] |
27.1 [7.4, 49.4] |
0.820 | 41.7 [18.3, 72.6] |
32.1 [11.7, 67.8] |
48.3 [24.1, 80.2] |
34.6 [13.4, 61.1] |
0.325 |
| Weight percentile | 40.9 [17.4, 76.8] |
49.5 [21.3, 84.2] |
45.7 [23.7, 79.2] |
41.9 [17.9, 71.7] |
0.435 | 73.3 [38.0, 94.1] |
65.9 [48.4, 90.6] |
77.5 [44.0, 94.5] |
59.4 [25.7, 89.4] |
0.569 |
| BMI percentile based on age & gender | 56.0 [29.3, 83.2] |
61.2 [29.2, 93.3] |
64.5 [31.3, 85.8] |
56.6 [30.3, 80.9] |
0.720 | 82.6 [51.8, 94.9] |
70.6 [46.3, 93.0] |
70.0 [46.5, 94.3] |
73.2 [39.1, 93.9] |
0.856 |
| Years since CKD onset | 11.3 [8.4, 14.4] |
11.2 [6.7, 15.0] |
10.1 [7.0, 13.4] |
11.1 [8.0, 14.8] |
0.165 | 4.8 [2.7, 8.4] |
3.4 [2.5, 6.7] |
5.9 [2.9, 8.9] |
4.8 [2.5, 8.2] |
0.561 |
| Estimated GFR (ml/min|1.73m2) | 47.6 [32.1, 59.8] |
47.8 [34.3, 62.6] |
51.1 [37.7, 64.2] |
50.6 [37.1, 59.1] |
0.449 | 61.3 [49.2, 79.1] |
59.4 [38.6, 83.2] |
62.5 [50.8, 69.8] |
61.5 [30.8, 81.6] |
0.542 |
| Urine protein:creatinine |
0.23
[0.10, 0.64] |
0.29
[0.10, 0.66] |
0.27
[0.10, 0.95] |
0.37
0.16, 1.00] |
0.009 |
0.33
[0.12, 0.71] |
0.37
[0.14, 1.64] |
0.60
[0.26, 1.00] |
1.00
[0.40, 2.81] |
<0.001 |
| Casual systolic BP percentile based on age, gender & height |
32.6
12.5, 58.9] |
41.8
[26.0, 63.7] |
63.6
[38.8, 79.5] |
70.8
[46.7, 92.1] |
<0.001 |
30.1
[12.8, 50.9] |
43.7
[21.0, 74.7] |
42.3
[21.5, 67.0] |
78.7
[58.2, 95.9] |
<0.001 |
| Casual diastolic BP percentile based on age, gender & height |
38.7
[20.6, 60.4] |
53.2
[30.8, 71.7] |
63.6
[45.2, 85.4] |
78.3
[53.5, 92.9] |
<0.001 |
43.5
[25.9, 57.9] |
61.1
[37.8, 75.8] |
53.6
[28.9, 74.8] |
81.7
[46.0, 93.4] |
<0.001 |
| Currently taking ACE inhibitor or ARB | 71.4% (65) | 55.7% (49) | 44.0% (51) | 41.2% (80) | <0.001 | 94.1% (48) | 77.1% (27) | 72.7% (24) | 66.2% (47) | 0.004 |
| Currently taking antihypertensive medication | 75.8% (69) | 58.0% (51) | 50.0% (58) | 59.8% (116) | 0.002 | 94.1% (48) | 82.9% (29) | 78.8% (26) | 90.1% (64) | 0.133 |
BMI: body mass index, BP: blood pressure
Among children with non-glomerular CKD, those with a higher MAP were younger (p = 0.038) and more likely to be African American (p < 0.001); however, these trends were not statistically significant among children with glomerular CKD. For children with either CKD diagnosis, those with a higher MAP had more proteinuria and were less likely to report antihypertensive therapy use. Both systolic and diastolic casual blood pressure percentiles were strongly associated with MAP categories (p < 0.001). For non-glomerular diagnoses, distributions of estimated GFR at first visit were very similar with medians ranging from 47.6 to 51.1 ml/min/1.73m2. Similarly, those with glomerular diagnoses did not have significantly different GFR distributions at first entry (59.4 to 62.5 ml/min|1.73m2). For both diagnostic groups, GFR was not significantly associated with MAP categories at the first ABPM measurement.
Figure 1 displays the Kaplan-Meier time to composite event (RRT or 50% decline in GFR) by MAP percentile category, stratified by diagnosis group. Among children with non-glomerular CKD, all MAP categories had a similar risk of the event within 4 years after the first ABPM measurement. In contrast, after 4 years from baseline, these survival estimates diverged with the MAP >90th percentile group having a much greater risk than children in the lower MAP categories. Among children with glomerular CKD, those with a MAP >90th percentile experienced the composite event earlier (highest risk), and children within the lowest MAP category had the lowest risk among the four exposure groups (log-rank P < 0.001).
Figure 1.
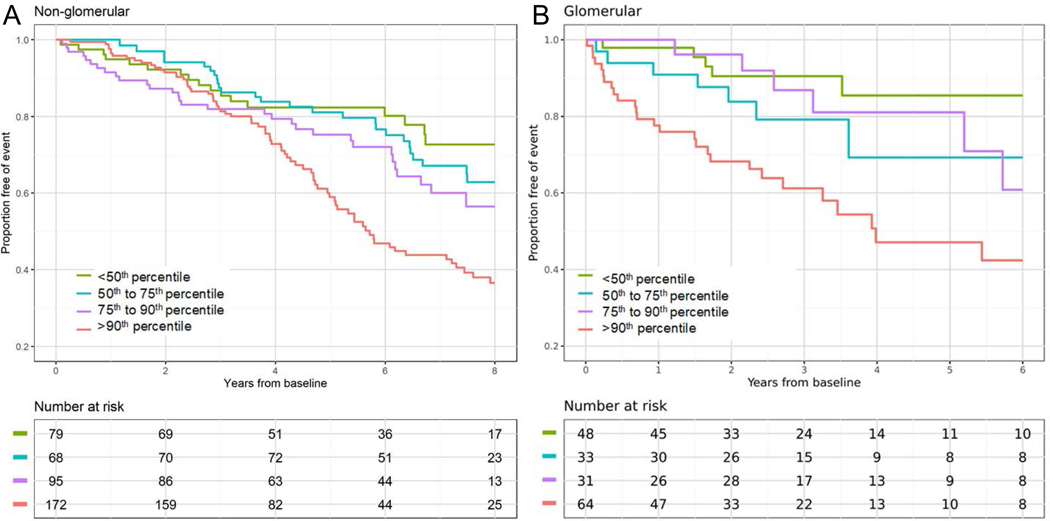
Survival functions of time to renal replacement therapy (RRT) or 50% decline in GFR by ambulatory MAP percentile category, stratified by non-glomerular and glomerular diagnoses.
Figure 2 presents results from the unadjusted and adjusted models. For the non-glomerular group, time-varying risk was characterized by reporting hazard ratios (HR) before and after 4 years. Among children with non-glomerular CKD and prior to 4 year from study entry, there were no significant differences in the risk of CKD progression among the MAP categories. After 4 years, however, there was an apparent dose-response effect of the MAP level on CKD progression. Compared to children with a MAP ranging from 75th to 90th percentile, those with a low MAP (< 50th percentile) had a significantly lower risk (HR = 0.35, 95% CI: 0.13, 0.96), those with a low normal MAP (50th-75th percentile) had a slightly lower risk (HR 0.67, 95% CI:0.32, 1.41), while those with a high MAP (> 90th percentile) had a significantly higher risk (HR = 1.88, 95% CI: 1.03, 3.44) for progression to the composite endpoint. These relationships were similar when adjusting for age, race and gender. The HR estimates were attenuated with further adjustment for proteinuria after 4 years, but the overall test for trend was highly significant (p= 0.003).
Figure 2.

Relative hazards of renal replacement therapy or 50% decline in GFR by MAP percentile categories, stratified by non-glomerular (◼) and glomerular (▲) diagnoses. Results are presented unadjusted, minimally adjusted for age, gender and race, and adjusted for age, gender, race and proteinuria level (uPrCr). For children with non-glomerular diagnosis, time-varying risk was characterized by ≤ 4 years and > 4 years from baseline. No significant time-varying risk was observed among children with glomerular diagnoses.
The far right column of Figure 2 describes the risk among children with glomerular CKD. No time-varying effects were assumed here and the HR describes the overall summary risk over the study period. In the unadjusted model, those within the highest MAP category had a 3.23 times higher hazard for the endpoint compared to children in the reference group (95%CI: 1.34, 7.79). Those with a MAP between the 50th and 75th percentile also had a higher hazard (HR = 1.72, 95% CI: 0.62, 4.75), but this effect was not significant. Similar results were observed when adjusting for age, race and gender. When the models additionally adjusted for proteinuria, the effect for MAP < 50th percentile was attenuated, but the other categories were similar to the unadjusted and minimally adjusted models. Children with the highest MAP still had the greatest risk and this association remained significant (HR: 3.27, 95% CI: 1.33, 8.02). The overall test for trend was significant for the unadjusted (p= 0.002) and minimally adjusted (p= 0.003) models, and was p= 0.048 for the model with the additional adjustment for proteinuria.
These models did not adjust for antihypertensive therapy, specifically ACEi/ARB medications, since the majority of children received this therapy. To describe the longitudinal use of antihypertensive therapies, Figure 3 displays the proportions of children on ACEi/ARB medications by MAP categories and visits, stratified by CKD diagnosis. In both groups, children with a lower MAP were more likely to be on medication compared to children with higher MAP. Children with a non-glomerular diagnosis were less likely to be on an ACEi/ARB compared to children with a glomerular diagnosis. There was no apparent trend on the change of proportions over study follow-up.
Figure 3.

Proportion of ACEi/ARB therapy use by MAP percentile category and visit, stratified by non-glomerular and glomerular diagnosis. Within each cell, the size of the shaded polygon is proportional to those using ACEi/ARB therapy. Darker shaded polygons indicate higher number of participants in each cell.
Discussion
In this longitudinal observational study of 679 children with moderate CKD, high wake or sleep MAP measured by ABPM was associated with faster progression of CKD to a composite endpoint of RRT or 50% decline in eGFR. There was a significant trend indicating a protective effect in the lower MAP categories. Those with a high MAP were more likely to be African American, have more proteinuria, and have higher casual blood pressure. Highlighting a potential area for clinical improvement, children with a high MAP were less likely to be receiving treatment with an ACEi or ARB. In children with non-glomerular CKD, the effect on progression by blood pressure level was not seen until after 4 years of follow-up while in children with glomerular diseases, the difference was present early on. With limited literature on ABPM in pediatric CKD, this large observational study of children under usual care conditions adds important and novel findings that, if widely adopted, may influence management and improve outcomes in this high-risk population.
There are several differences between the CKiD study and the ESCAPE trial. Most importantly, CKiD is an observational cohort study while the ESCAPE trial entailed a randomized controlled intervention.9,14 In ESCAPE, all participants were initially hypertensive and all received fixed dose ramipril. Participants in the CKiD study were more representative of a typical CKD population, with some children naturally normotensive, and others treated hypertensive, with use of an ACEi/ARB at the discretion of the treating physician. ABPM were performed every 6 months in the ESCAPE trial to modify therapy while they were completed every 2 years in CKiD participants. The participants in the ESCAPE trial were primarily Caucasian, while participants in CKiD are Caucasian, African American and Hispanic.
In addition, we chose to define elevated MAP by either high wake or sleep MAP to minimize misclassification or dilution of nocturnal abnormalities as may occur with using 24-hour MAP which was used in the ESCAPE trial. In the non-glomerular disease group, 373 person-visits had any MAP > 90th percentile and of these, 50% had a normal wake MAP but a sleep MAP > 90th percentile (Table S2, please see http://hyper.ahajournals.org). In the glomerular disease group, 112 person-visits had any MAP > 90th percentile and of these, 51% had a normal wake MAP but a sleep MAP > 90th percentile. We also analyzed 24-hour MAP categories, which did not differentiate between wake and sleep states, and found qualitatively similar results that were attenuated relative to our classification of categorization as fewer individuals were classified as high MAP (data not shown). This suggests that classifying wake and sleep states separately is more sensitive and may be a consideration for research and clinical categorization.
Despite these differences, both ESCAPE and this analysis of the CKiD participants demonstrate that elevated ambulatory MAP is strongly associated with an increased risk of kidney disease progression. However, the evidence for benefit of a low MAP in the present study was not as strong. There may be a difference in the risk of progression for those patients who are naturally normotensive compared to treated hypertensive, but given that ACEi/ARBs are also used to lower proteinuria among those without hypertension, it was difficult to identify and disentangle these differences.
Progression of CKD is influenced by a complex interplay of etiology, hypertension, proteinuria, use of ACEi/ARB and other factors. These factors are likely not independent and the exact role of each component is challenging to determine, especially in observational studies. In the ESCAPE trial, in which all participants were on a fixed dose ACE inhibitor, higher baseline proteinuria was associated with an increased risk of kidney disease progression.9 A recent post-hoc analysis of the proteinuria response to ACEi in the ESCAPE trial showed that ACEi responsiveness was protective, as patients with >60% reduction in baseline proteinuria were least likely to have kidney disease progression.27 In the CKiD population, Abraham et al. showed that the use of ACEi/ARB reduced the risk of end stage kidney disease by 21–37%, and continuous use of ACEi/ARB was beneficial compared to never use, particularly if used for 3 or more years.28 In the current study, higher proteinuria tracked with higher MAP in both the glomerular and non-glomerular CKD groups. Of interest, there was less use of ACEi/ARB among those with an elevated MAP suggesting an area for intervention and potential improvement in outcomes.
The use of ABPM over casual blood pressure in a CKD population is the more reliable method of diagnosing hypertension given the high rates of masked and nocturnal hypertension in this population. Samuels et al. examined initial ABPM data from the CKiD study and found that 35% of patients had masked hypertension and only 42% were normotensive.1 They also found that nocturnal hypertension (65%) was more common than daytime hypertension (33%). Barletta et al. analyzed more recent CKiD blood pressure data and found that hypertension continues to be undertreated with an increased prevalence of ambulatory hypertension (63%) and masked hypertension (49%) in the more recent time period.2
There are several limitations of our analysis, primarily due to the observational nature of this cohort study. The study population was a mixture of uncontrolled hypertensive, controlled hypertensive and normotensive individuals. We treated controlled hypertensive participants the same as normotensive individuals, which is a common analytic design, but these groups may have different disease trajectories. The population had a high use of ACEi/ARB, but data on therapy indication was not available (i.e., whether they were prescribed for hypertension, proteinuria or both). In addition, proteinuria explained a lot of the variability, but whether proteinuria was a cause or consequence of high blood pressure is not clear. This is an analytic challenge, especially if proteinuria is a mediator of the blood pressure to kidney disease progression relationship. If so, the minimally adjusted models were more valid to estimate the targeted relationship of interest. Also, although estimating the time-varying effect before and after 4 years in the non-glomerular group was a decision based on data, it makes some biological sense due to the progressive nature of the disease which is slower among those with non-glomerular diagnoses.19 As participants entered the study at different times, the percentage of patients who completed 8 years of follow-up decreased with time. Indeed, small risk sets late in study follow-up, as demonstrated in Figure 1, should be considered when interpreting these estimates of risk. Lastly, ABPM were performed every 2 years and this analysis incorporated time-varying MAP categories but did not take into account historical levels or unique patterns of longitudinal MAP. Specifically, the analysis assumed that a participant who transitioned from >90th percentile to <50th percentile, had the same risk as a participant who remained in the <50th MAP percentile. This is a typical assumption made in epidemiologic analyses of blood pressure, but further research is needed to determine whether duration of time with high MAP prior to resolution is associated with worse outcomes, although it is reasonable to hypothesize that this is the case.
Perspectives
Children with chronic kidney disease and an ambulatory MAP >90th percentile have a higher risk of more rapid progression of their renal disease. In this study, CKiD participants with high MAP had lower proportions reporting use of ACEi/ARB therapy compared to those with lower MAP percentiles highlighting a potential area for intervention. Having a MAP <50th percentile was not strongly associated with slower disease progression, especially among those with glomerular diseases, however the trend for lower blood pressures being associated with lower risk of progression was significant. In our study, the presence of high wake or sleep MAP by ABPM was strongly associated with kidney disease progression in the CKiD cohort although effects may not be seen for years, particularly in non-glomerular diseases.
Supplementary Material
Novelty and Significance
What is New?
This is the first large observational cohort study to examine the association of ambulatory mean arterial pressure (MAP) on the risk of chronic kidney disease (CKD) progression in a general pediatric CKD population.
What is Relevant?
Recommendations for blood pressure goals in children with CKD are discrepant in consensus guidelines and based on a single trial that included only hypertensive patients.
Summary:
A wake or sleep MAP >90th percentile was associated with an increased risk of renal disease progression.
There is a differential risk over time in children with non-glomerular CKD
A significant trend was observed with lower MAP percentiles being associated with lower risk of progression in both glomerular and non-glomerular CKD.
Acknowledgements
Data in this manuscript were collected by the Chronic Kidney Disease in children prospective cohort study (CKiD) with clinical coordinating centers (Principal Investigators) at Children’s Mercy Hospital and the University of Missouri - Kansas City (Bradley Warady, MD) and Children’s Hospital of Philadelphia (Susan Furth, MD, PhD), Central Biochemistry Laboratory (George Schwartz, MD) at the University of Rochester Medical Center, and data coordinating center (Alvaro Muñoz, PhD and Derek Ng, PhD) at the Johns Hopkins Bloomberg School of Public Health. The CKiD website is located at https://statepi.jhsph.edu/ckid.
Sources of Funding
The CKiD Study is supported by grants from the National Institute of Diabetes and Digestive and Kidney Diseases, with additional funding from the Eunice Kennedy Shriver National Institute of Child Health and Human Development, and the National Heart, Lung, and Blood Institute (U01-DK-66143, U01-DK-66174, U24-DK-082194, U24-DK-66116).
Footnotes
Disclosures
The authors have no conflicts to disclose.
References
- 1.Samuels J, Ng D, Flynn J, Mitsnefes M, Poffenbarger T, Warady B, Furth S for the Chronic Kidney Disease in Children Study Group. Ambulatory blood pressure patterns in children with chronic kidney disease. Hypertension 2012;60:43–50. [DOI] [PMC free article] [PubMed] [Google Scholar]
- 2.Barletta GM, Pierce C, Mitsnefes M, Samuels J, Warady BA, Furth S, Flynn J. Is blood pressure improving in children with chronic kidney disease? A period analysis. Hypertension 2018;71:444–450. [DOI] [PMC free article] [PubMed] [Google Scholar]
- 3.Mitsnefes M, Kimball T, Kartal J, Witt S, Glascock B, Khoury P, Daniels SR. Progression of left ventricular hypertrophy in children with early chronic kidney disease: 2-year follow-up study. J Pediatr 2006;149:671–675. [DOI] [PubMed] [Google Scholar]
- 4.Kupferman J, Friedman A, Cox C, Flynn J, Furth S, Warady B, Mitsnefes, the CKiD Study Group. BP control and left ventricular hypertrophy regression in children with CKD. J Am Soc Nephrol 2014;25:167–174. [DOI] [PMC free article] [PubMed] [Google Scholar]
- 5.Brady T, Schneider M, Flynn J, Cox C, Samuels J, Saland J, White CT, Furth S, Warady BA, Mitsnefes M. Carotid intima-media thickness in children with CKD: Results from the CKiD study. Clin J Am Soc Nephrol 2012;7:1930–1937. [DOI] [PMC free article] [PubMed] [Google Scholar]
- 6.Litwin M, Wühl E, Jourdan C, Niemirska A, Schenk JP, Jobs K, Grenda R, Wawer ZT, Rajszys P, Mehls O, Schaefer F. Evolution of large-vessel arteriopathy in paediatric patients with chronic kidney disease. Nephrol Dial Transplant 2008;23:2552–2557. [DOI] [PubMed] [Google Scholar]
- 7.Mitsnefes M, Ho P, McEnery P. Hypertension and progression of chronic renal insufficiency in children: A report of the North American Pediatric Renal Transplant Cooperative Study (NAPRTCS). J Am Soc Nephrol 2003;14:2618–2622. [DOI] [PubMed] [Google Scholar]
- 8.Wingen A, Fabian-Bach C, Schaefer F, Mehls O, for the European Study Group for Nutritional Treatment of Chronic Renal Failure in Childhood. Randomised multicentre study of a low-protein diet on the progression of chronic renal failure in children. Lancet 1997;349:1117–1123. [DOI] [PubMed] [Google Scholar]
- 9.Wuhl E, Trivelli A, Picca S, Litwin M, Peco-Antic A, Zurowska A, Testa S, Jankauskiene A, Emre S, Caldas-Afonso A et al. for the ESCAPE Trial Group. Strict blood-pressure control and progression of renal failure in children. N Engl J Med 2009;361:1639–1650. [DOI] [PubMed] [Google Scholar]
- 10.Kidney Disease: Improving Global Outcomes (KDIGO) Blood Pressure Work Group. KDIGO clinical practice guideline for the management of blood pressure in chronic kidney disease. Kidney Int Supp 2012;2:337–414. [Google Scholar]
- 11.Flynn JT, Kaelber DC, Baker-Smith CM, Blowey D, Carroll AE, Daniels SR, de Ferranti SD, Dionne JM, Falkner B, Flinn SK et al. for the Subcommittee on Screening and Management of High Blood Pressure in Children. Clinical Practice Guideline for Screening and Management of High Blood Pressure in Children and Adolescents. Pediatrics 2017;140(3) e20171904. [DOI] [PubMed] [Google Scholar]
- 12.Lurbe E, Agabiti-Rosei E, Cruickshank JK, Dominiczak A, Erdine S, Hirth A, Invitti C, Litwin M, Mancia G, Dall D, et al. 2016 European Society of Hypertension guidelines for the management of high blood pressure in children and adolescents. J Hypertens 2016;34:1887–1920. [DOI] [PubMed] [Google Scholar]
- 13.Warady BA, Abraham AG, Schwartz GJ, Wong CS, Munoz A, Betoko A, Mitsnefes M, Kaskel F, Greenbaum LA, Mak RH, Flynn J, Moxey-Mims MM, Furth S. Predictors of rapid progression of glomerular and nonglomerular kidney disease in children and adolescents: The Chronic Kidney Disease in Children (CKiD) Cohort. Am J Kidney Dis 2015;65:878–888. [DOI] [PMC free article] [PubMed] [Google Scholar]
- 14.Furth SL, Cole SR, Moxey-Mims MM, Kaskel F, Mak RH, Schwartz GJ, Wong C, Munoz A, Warady BA. Design and methods of the Chronic Kidney Disease in Children (CKiD) prospective cohort study. Clin J Am Soc Nephrol 2006;1:1006–1015. [DOI] [PMC free article] [PubMed] [Google Scholar]
- 15.Soergel M, Kirschstein M, Busch C, Danne T, Gellermann J, Holl R, Krull F, Reichert H, Reusz GS, Rascher W. Oscillometric twenty-four-hour ambulatory blood pressure values in healthy children and adolescents: a multicenter trial including 1141 subjects. J Pediatr 1997;130(2):178–84. [DOI] [PubMed] [Google Scholar]
- 16.Wuhl E, Witte K, Soergel M, Mehls O, Schaefer F; for the German Working Group on Pediatric Hypertension. Distribution of 24-h ambulatory blood pressure in children: normalized reference values and role of body dimensions. J Hypertens 2002;20:1995–2007. [DOI] [PubMed] [Google Scholar]
- 17.Anderson AH, Yang W, Townsend RR, Pan Q, Chertow GM, Kusek JW, Charleston J, He J, Kallem R, Lash JP, et al. Time-updated systolic blood pressure and the progression of chronic kidney disease: a cohort study. Ann Intern Med. 2015;162(4):258–265. [DOI] [PMC free article] [PubMed] [Google Scholar]
- 18.Reynolds BC, Roem JL, Ng DKS, Matsuda-Abedini M, Flynn JT, Furth SL, Warady BA, Parekh RS. Association of time-varying blood pressure with chronic kidney disease progression in children. JAMA Netw Open. 2020;3(2):e1921213-e1921213. [DOI] [PMC free article] [PubMed] [Google Scholar]
- 19.Ng DK, Matheson MB, Warady BA, Mendley SR, Furth SL, Muñoz A. Incidence of initial renal replacement therapy over the course of kidney disease in children. Am J Epidemiol 2019;188(12):2156–2164. [DOI] [PMC free article] [PubMed] [Google Scholar]
- 20.Cole SR, Edwards JK, Naimi AI, Muñoz A. Hidden Imputations and the Kaplan-Meier Estimator. Am J Epidemiol. 2020;189(11):1408–1411. doi: 10.1093/aje/kwaa086 [DOI] [PMC free article] [PubMed] [Google Scholar]
- 21.Schwartz GJ, Schneider MF, Maier PS, Moxey-Mims M, Dharnidharka V, Warady BA, Furth SL, Munoz A. Improved equations estimating GFR in children with chronic kidney disease using an immunonephelometric determination of cystatin C. Kidney Int 2012;82:445–453. [DOI] [PMC free article] [PubMed] [Google Scholar]
- 22.Flynn JT, Mitsnefes M, Pierce C, Cole SR, Parekh RS, Furth SL, Warady BA for the Chronic Kidney Disease in Children Study. Blood pressure in children with chronic kidney disease: A report from the Chronic Kidney Disease in Children Study. Hypertension 2008;52:631–637. [DOI] [PMC free article] [PubMed] [Google Scholar]
- 23.Pierce CB, Cox C, Saland JM, Furth SL, Muñoz A. Methods for characterizing differences in longitudinal glomerular filtration rate changes between children with glomerular chronic kidney disease and those with nonglomerular chronic kidney disease. Am J Epidemiol 2011;174:604–612. [DOI] [PMC free article] [PubMed] [Google Scholar]
- 24.Kaufman JS. Statistics, Adjusted Statistics, and Maladjusted Statistics. Am J Law Med. 2017;43(2–3):193–208. doi: 10.1177/0098858817723659 [DOI] [PubMed] [Google Scholar]
- 25.Fisher LD, Lin DY. Time-dependent covariates in the Cox proportional-hazards regression model. Annu Rev Public Health 1999;20:145–157. [DOI] [PubMed] [Google Scholar]
- 26.Li X, Buechner JM, Tarwater PM, Muñoz A. A diamond-shaped equiponderant graphical display of the effects of two categorical predictors on continuous outcomes. Am Stat 2003;1;57(3):193–199. [Google Scholar]
- 27.van den Belt SM, Heerspink HJL, Gracchi V, de Zeeuw K, Wuhl E, Schaefer F on behalf of the ESCAPE Trial Group. Early proteinuria lowering by angiontensin-converting enzyme inhibition predicts renal survival in children with CKD. J Am Soc Nephrol 2018;29:2225–2233. [DOI] [PMC free article] [PubMed] [Google Scholar]
- 28.Abraham AG, Betoko A, Fadrowski JJ, Pierce C, Furth S, Warady BA, Munoz A. Renin-angiotensin II-aldosterone system blockers and time to renal replacement therapy in children with CKD. Pediatr Nephrol 2017;32:643–649. [DOI] [PMC free article] [PubMed] [Google Scholar]
Associated Data
This section collects any data citations, data availability statements, or supplementary materials included in this article.