Abstract
The size of the transcriptional program of long non-coding RNAs in the mammalian genome has engendered discussions about their biological roles1, particularly the promoter antisense (PAS) transcripts2,3. Here we report the development of an assay— referred to as chromatin isolation by RNA-Cas13a complex—to quantitatively detect the distribution of RNA in the genome. The assay revealed that PAS RNAs serve as a key gatekeeper of a broad transcriptional pause release program, based on decommissioning the 7SK small nuclear RNA-dependent inhibitory P-TEFb complex. Induction of PAS RNAs by liganded ERα led to a significant loss of H3K9me3 and the release of basally recruited HP1α and KAP1 on activated target gene promoters. This release was due to PAS RNA-dependent recruitment of H3K9me3 demethylases, which required interactions with a compact stem-loop structure in the PAS RNAs, an apparent feature of similarly regulated PAS RNAs. Activation of the ERα-bound MegaTrans enhancer, which is essential for robust pause release, required the recruitment of phosphorylated KAP1, with its transfer to the cognate promoters permitting 17β-oestradiol-induced pause release and activation of the target gene. This study reveals a mechanism, based on RNA structure, that mediates the function of PAS RNAs in gene regulation.
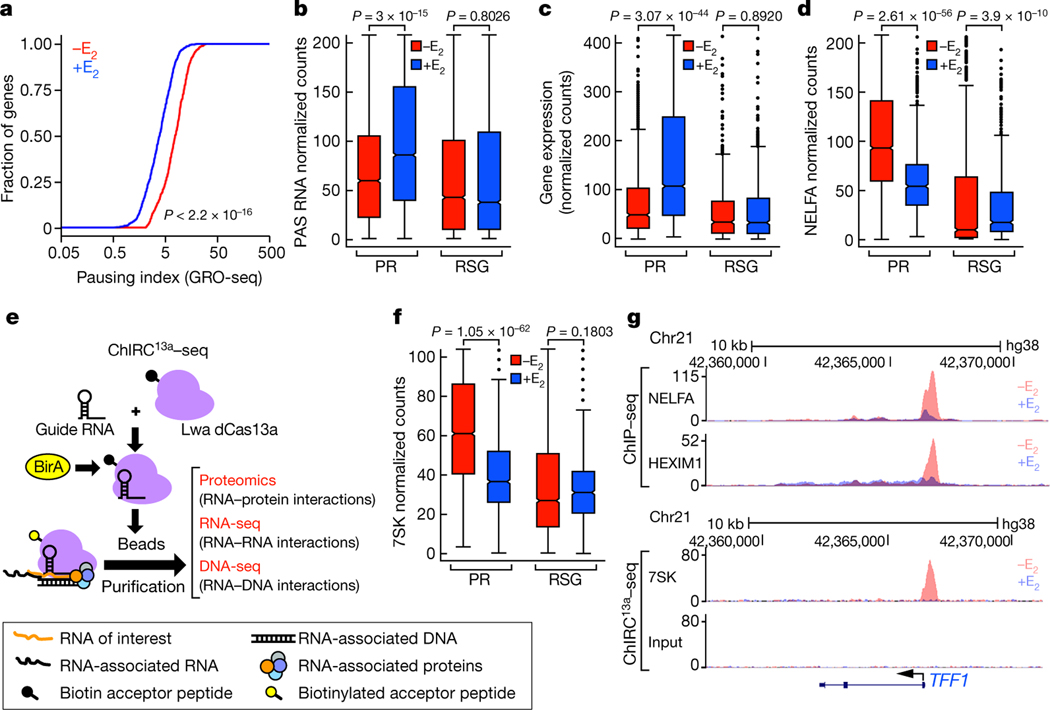
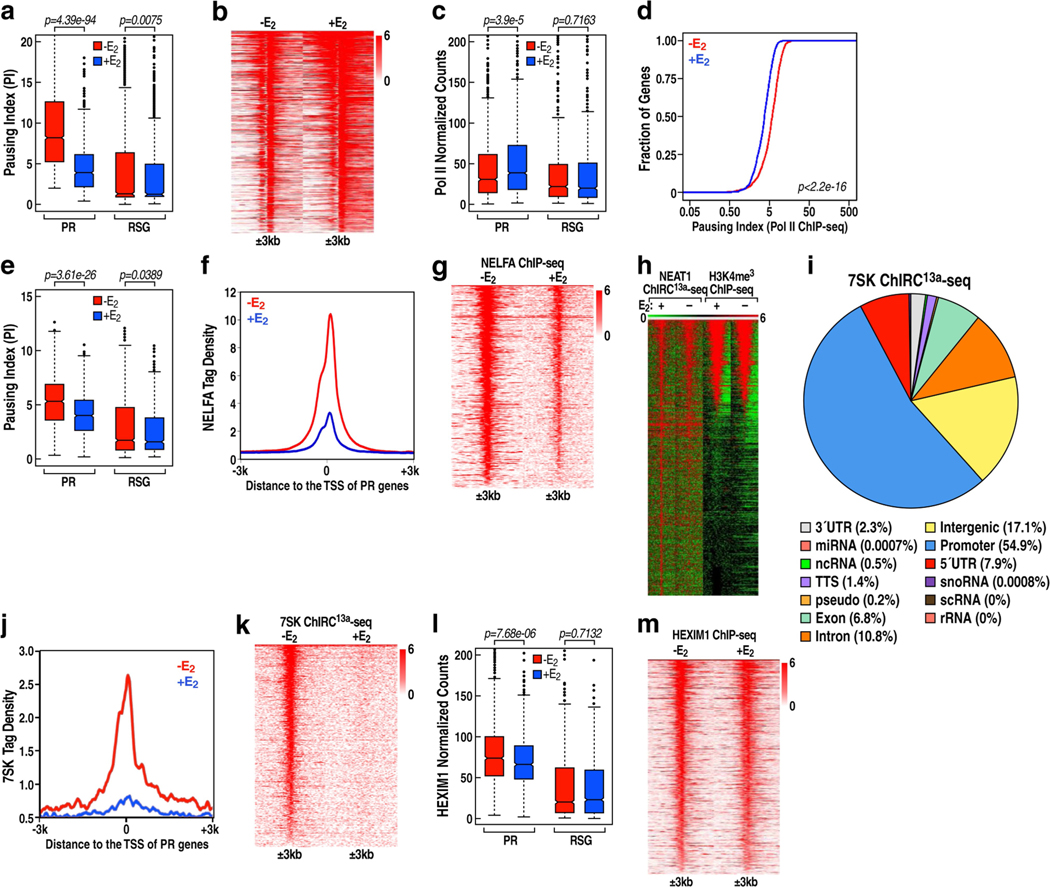
In contrast to the established function of many long non-coding RNAs (lncRNAs)4–14, there remains considerable debate about the potential functions of PAS transcripts1,15–18. To investigate the potential role of PAS RNAs, we initially focused on the activation of a large cohort of coding transcription units by oestrogen receptor-α (ERα), a ligand (oestrogen)-dependent sex steroid-regulated transcription factor19–26. Global run-on sequencing (GRO-seq) data indicated that 837 activated promoters have the signature of 17β-oestradiol (E2)-induced promoter-proximal pause release (referred to as PR gene promoters) and exhibited robust induction of corresponding PAS transcripts (Fig. 1a–c, Extended Data Fig. 1a, b). E2-induced RNA polymerase II (Pol II) pause release on PR genes was further supported by Pol II and NELFA chromatin immunoprecipitation followed by sequencing (ChIP–seq) analyses (Fig. 1d, g, Extended Data Fig. 1c–g). Promoter-proximal pause release is linked to activation of P-TEFb kinase27, requiring dismissal of the 7SK small nuclear ribonucleoprotein (snRNP) complex at promoters28.
Fig. 1 |. E2 induction of Pol II pause release and PAS RNA transcription.
a, Cumulative distribution of the Pol II pausing ratio based on GRO-seq analysis (n = 3 independent experiments) for PR genes. The P value was determined by two-sided Kolmogorov-Smirnov test. b, c, Box plot analysis of GRO-seq data showing PAS RNA expression (b) and gene expression (c) at the indicated genes in response to E2. Throughout the study, we used 837 randomly selected genes (RSG) as control for box plot analysis. d, f, Box plot analysis of NELFA ChIP-seq data (d) and 7SK ChIRC13a-seq data (f) representing the effect of E2 on NELFA and 7SK binding at the indicated promoters. e, A scheme of the ChIRC13a-seq method. Lwa, Leptotrichia wadei. g, Genome browser views of the TFF1 genomic region. Chr21, chromosome 21. In b-d, f, for the box plots, the middle line denotes the median, the box represents the interquartile range and the whiskers denote 5 times the interquartile range from the upper or lower quartiles (n = 2 independent experiments). The P values were determined by two-sided Wilcoxon test.
Reproducible detection and quantitation of genomic location has proved to be quite challenging for most RNAs, although oligonucleotide probe-based methods29–31 have allowed successful mapping of several RNAs. The recent discovery of Cas13a32,33 could potentially be exploited as a more uniformly applicable technology to detect lncRNAs. We have developed such a method, which we refer to as chromatin isolation by RNA-Cas13a complex followed by sequencing (ChIRC13a-seq). This method uses biotinylated, enzymatically dead Cas13a (dCas13a) that is still capable of binding target RNA and guide RNAs (gRNAs) specific for the RNA target of interest (Fig. 1e). We used ChIRC13a-seq with gRNAs directed against NEAT1 to evaluate its localization in the genome (Extended Data Fig. 1h), providing a considerably more robust coverage than that achieved using ChART-seq34.
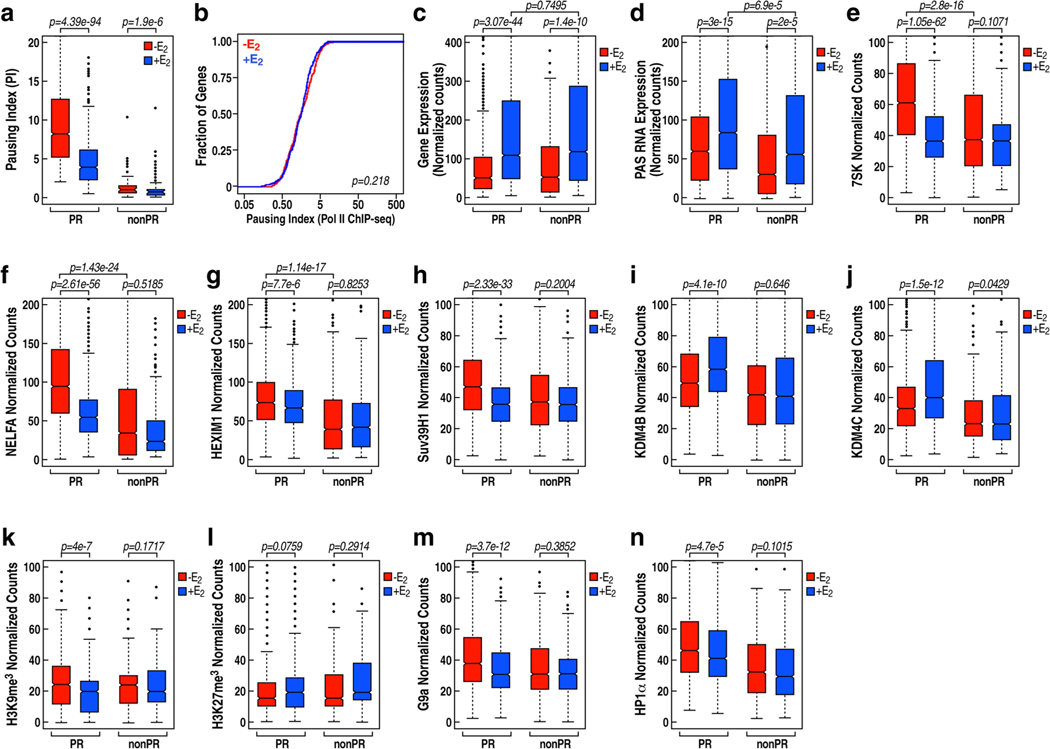
We thus applied ChIRC13a-seq to determine the genomic occupancy of 7SK (Extended Data Fig. 1i), and found that E2 treatment decreased the levels of promoter-bound 7SK snRNA (Fig. 1f, g, Extended Data Fig. 1j, k) and of HEXIM1, the direct inhibitor of P-TEFb kinase in the 7SK snRNP complex (Fig. 1g, Extended Data Fig. 1l, m). Analysis of a gene cohort that is upregulated by E2 but not regulated by pause release confirmed that E2-induced PAS RNAs and promoter-proximal pause release occurred specifically at PR genes (Extended Data Fig. 2). These findings provide an opportunity to gain further insights into the mechanisms that are responsible for promoter pausing and pause release, including the potential participation of PAS RNA.
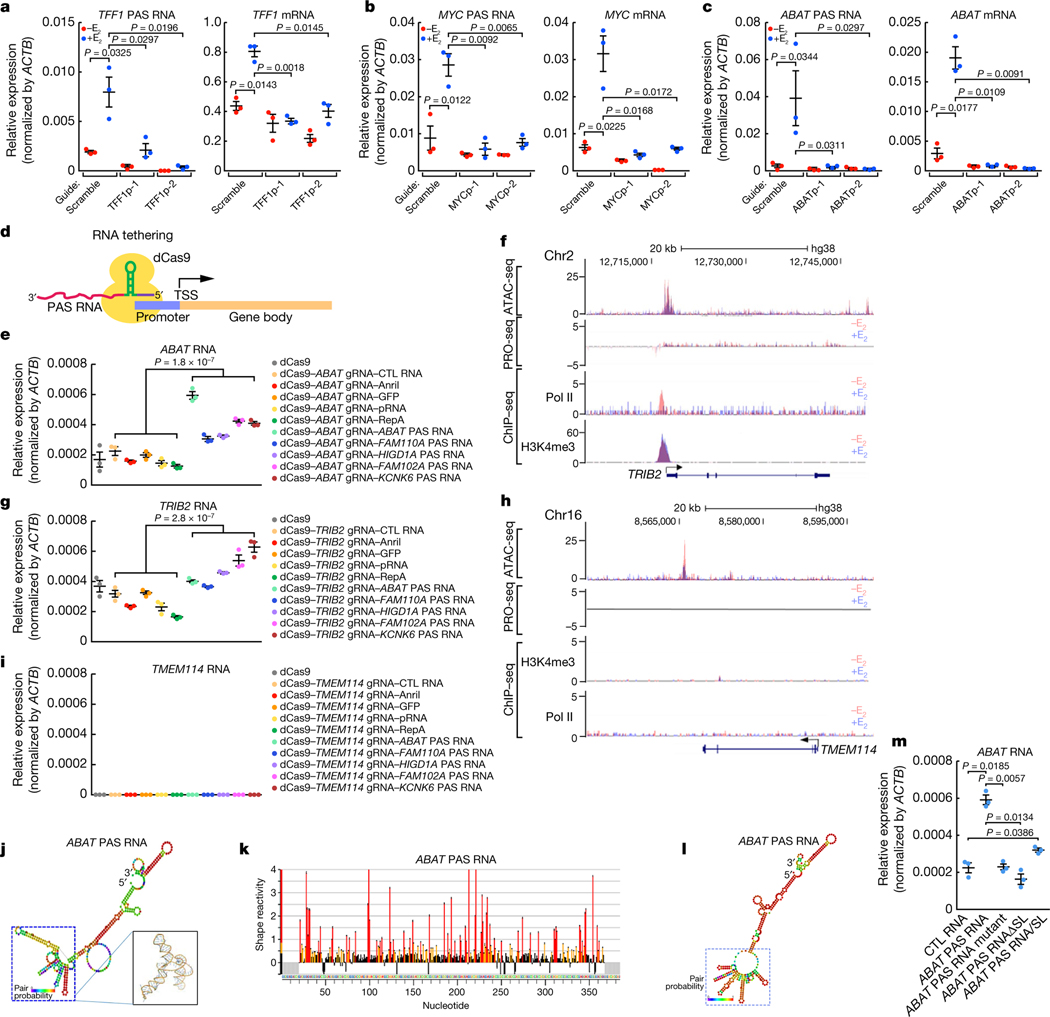
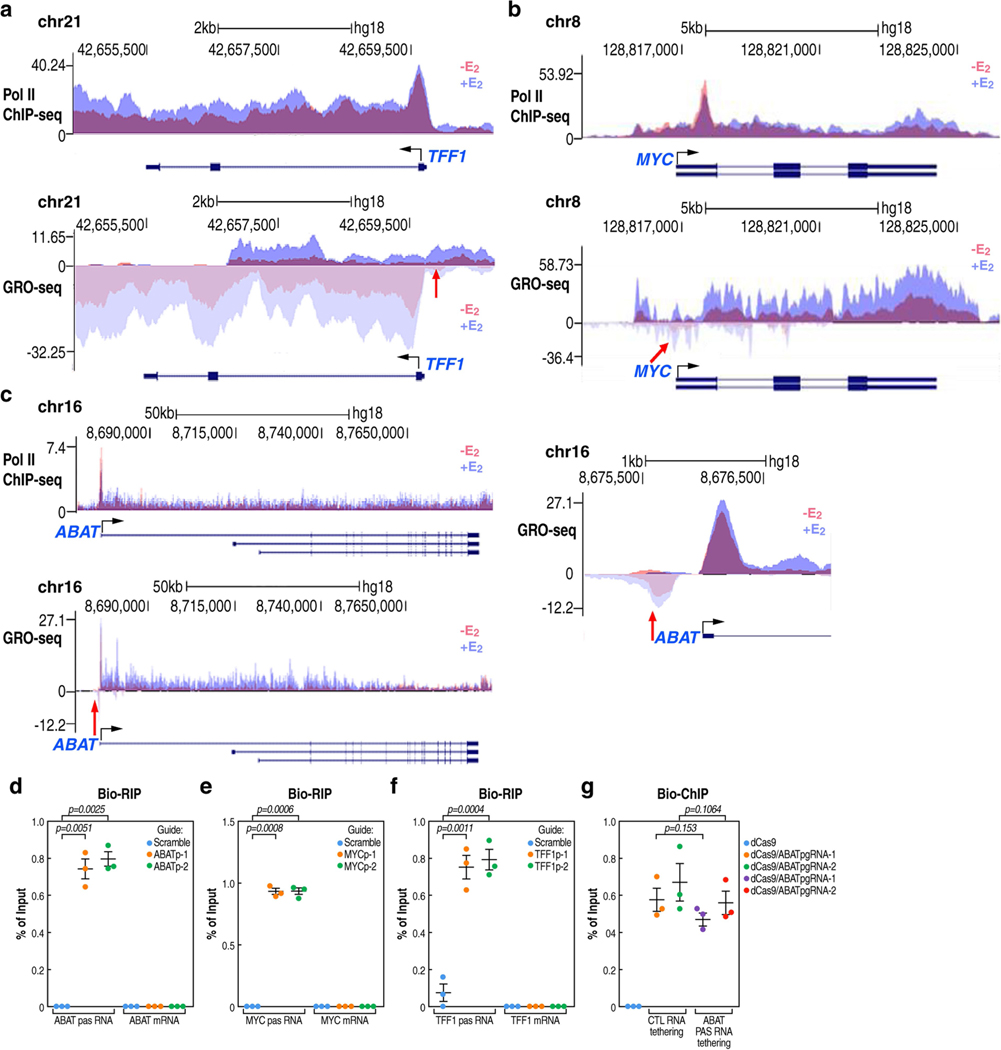
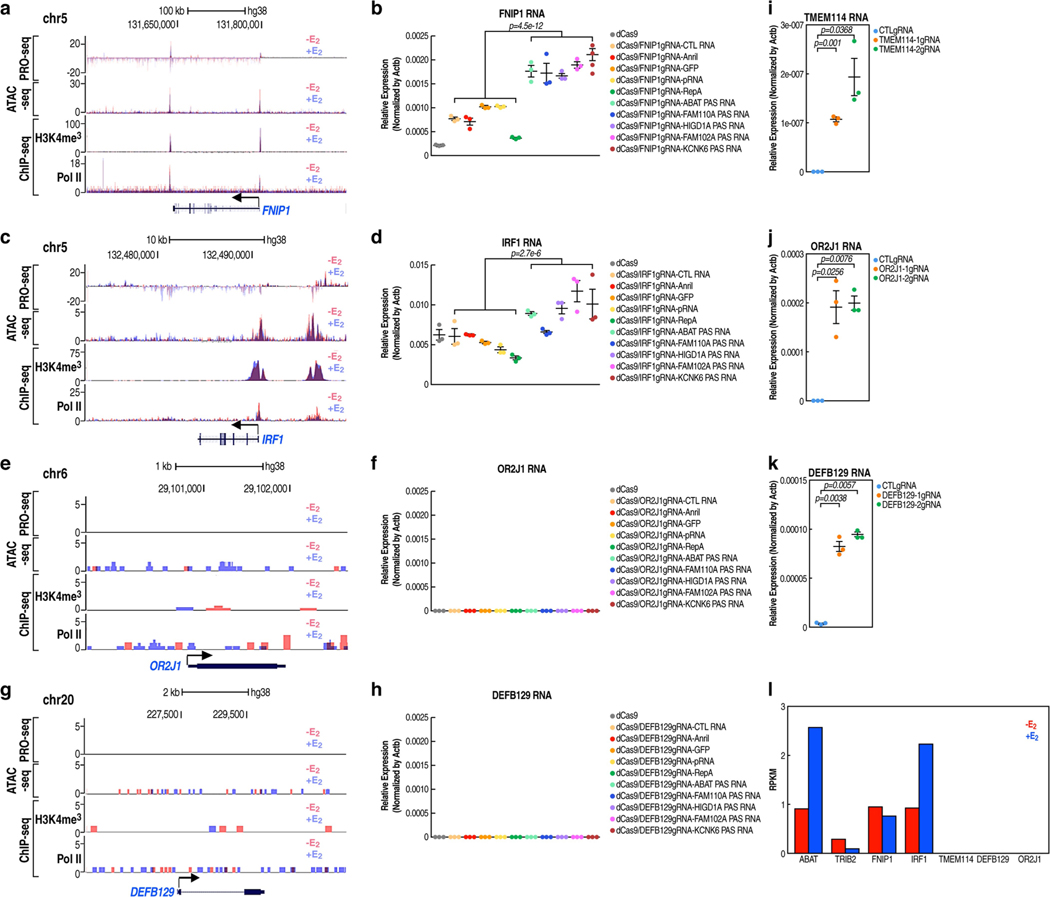
To explore the potential role of PAS transcripts, we selected three E2-regulated promoters (TFF1, MYC and ABAT) that exhibit E2 upregulation for investigation (Extended Data Fig. 3a–c). A CRISPR-Cas13a-based RNA cleavage strategy was used to selectively degrade the PAS transcript. The specificity of gRNAs was validated by the RNA immunoprecipitation assay (Extended Data Fig. 3d–f). In each case, knockdown of the PAS transcript was accompanied by a striking reduction of the coding transcript units (Fig. 2a–c). To independently confirm a regulatory role of PAS RNA in gene regulation, we used a CRISPR-dCas9-mediated RNA tethering strategy (Fig. 2d). Tethering ABAT PAS RNA did not affect dCas9-gRNA targeting, suggesting integrity of functional CRISPR-dCas9 complexes (Extended Data Fig. 3g). Five PAS RNAs and five control RNAs were chosen for all of the RNA tethering experiments. Tethering PAS RNAs, but not the control RNAs, to the ABAT promoter significantly increased the levels of ABAT RNA (Fig. 2e). Tethering PAS RNAs to the promoter of TRIB2, FNIP1 or IRF1, which are all paused genes, induced moderate, significant activation of each gene (Fig. 2f, g, Extended Data Fig. 4a–d). By contrast, tethering PAS RNAs to promoters characterized by no chromatin accessibility, no Pol II occupancy and no deposition of trimethylation of lysine 4 on histone H3 (H3K4me3) (Fig. 2h, Extended Data Fig. 4e, g)—TMEM114, OR2J1 or DEFB129—had no effect on the expression of each gene (Fig. 2h, i, Extended Data Fig. 4e–h). As a control, the use of a CRISPR activation (CRISPRa) strategy led to robust activation of each gene (Extended Data Fig. 4i–k). These data suggest promoter context-dependent regulation of PAS RNAs, implying that an accessible chromatin environment and basal promoter activity are required for a successful PAS RNA-based RNA tethering strategy. The reads per kilobase of transcript per million reads mapped (RPKM) of each gene to which dCas9-PAS RNAs are delivered are shown in Extended Data Fig. 4l.
Fig. 2 |. The effect of the shape of PAS RNA on transcription activation.
a-c, Reverse transcription with quantitative PCR (RT-qPCR) data showing the effect of PAS RNA knockdown on the respective gene expression (TFF1 (a), MYC (b) and ABAT (c)) following E2 treatment. d, A scheme of the CRISPR- dCas9-mediated RNA tethering method. TSS, transcription start site. e, g, i, RT-qPCR data showing the effect of tethering PAS RNAs or control RNAs to the indicated promoters. Data are shown as individual values, mean ± s.d. (n = 3). The P values were determined by two-sided Welch’s t-test. f, h, Genome browser views of the TRIB2 (f) and TMEM114 (h) genomic regions. ATAC-seq, assay for transposase-accessible chromatin using sequencing; PRO-seq, precision run-on sequencing. j, Predicted secondary structure of ABAT PAS RNA by the RNAfold webserver. The 3D structure dotted by the blue square is predicted by the RNAcomposer program. k, SHAPE-MaP reactivity profiles of ABAT PAS RNA. l, Secondary structure models based on SHAPE-MaP reactivities for ABAT PAS RNA. m, RT-qPCR data showing the effect of tethering ABAT PAS RNA or the relevant ABAT PAS RNA mutants to the ABAT promoter. ABAT PAS RNAΔSL, truncated ABAT PAS RNA lacking the clustered stem-loop structure; ABAT PAS RNA/SL, truncated ABAT PAS RNAs with the clustered stem-loop structure. In a-c, m, data are shown as individual values, mean ± s.d. (n = 3). The P values were determined by one-sided Student’s t-test.
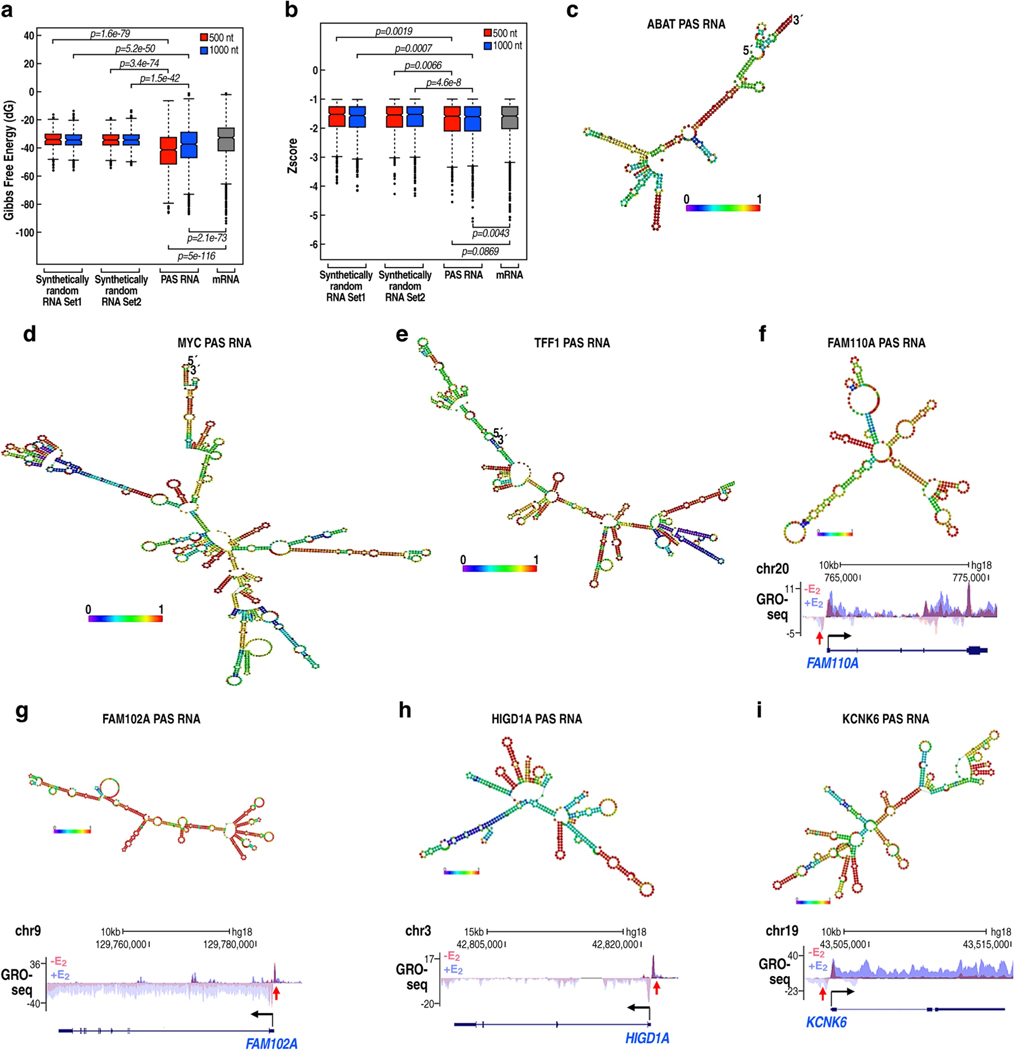
PAS RNAs in their native state have statistically significant lower minimum free energy and lower z-scores than their cognate mRNAs and synthetic random RNAs (Extended Data Fig. 5a, b; detailed information in the Methods section). We investigated the idea that PAS RNAs may tend to form more secondary structures (Extended Data Fig. 5c–i), focusing on the ABAT PAS RNA, for which computational analysis suggested that a clustered stem-loop structure was predicted to fold into a tight 3D structure (Fig. 2j). To validate that ABAT PAS RNA has such special topological structures, we performed selective 2-hydroxyl acylation analysed by primer extension and mutational profiling (SHAPE-MaP) experiments. On the basis of the SHAPE-MaP profile (Fig. 2k) and constrained secondary structure models (Fig. 2l, Supplementary Information), ABAT PAS RNA tended to form multiple stem-loop structures in the region predicted by computational analysis, prompting us to investigate their potential function in gene regulation. In contrast to the activating effects of tethering full-length ABAT PAS RNA, tethering ABAT PAS RNA mutants with disrupted stem-loop structure to the ABAT promoter markedly compromised activation of the ABAT gene (Fig. 2m). Together, these results indicate that the shape of PAS transcripts is of functional importance for regulated cognate coding gene expression.
Mechanisms of PAS RNA actions
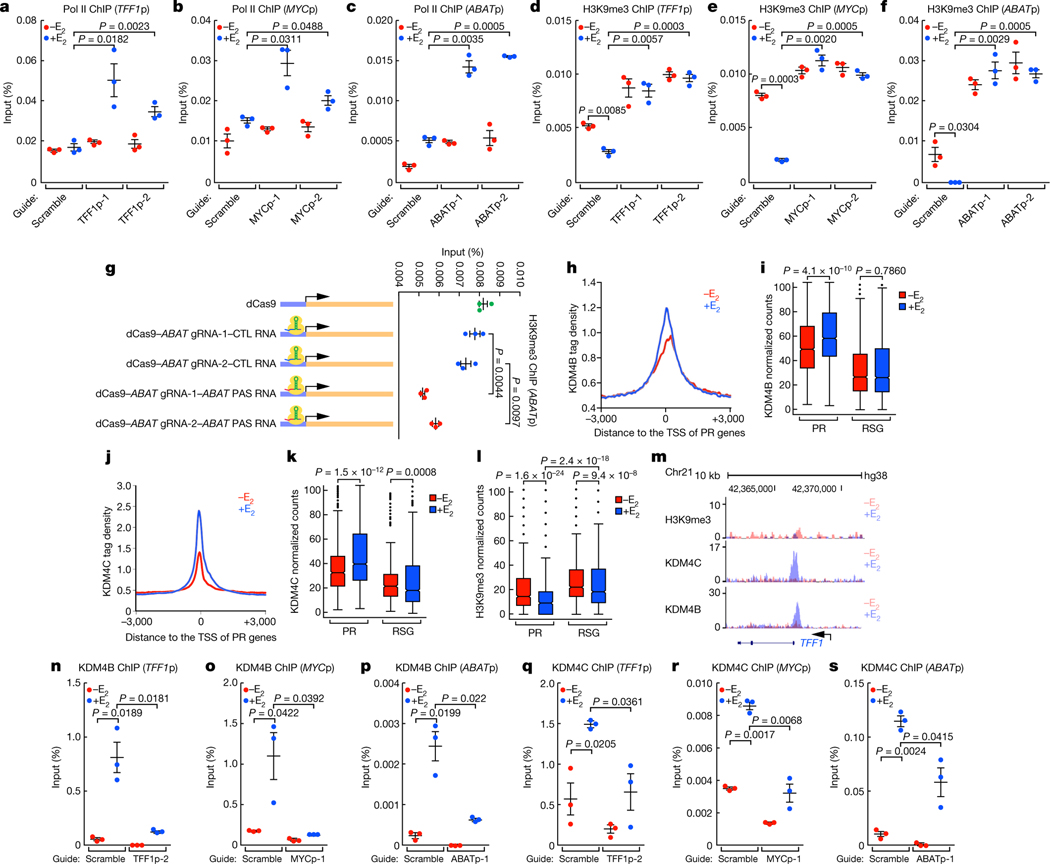
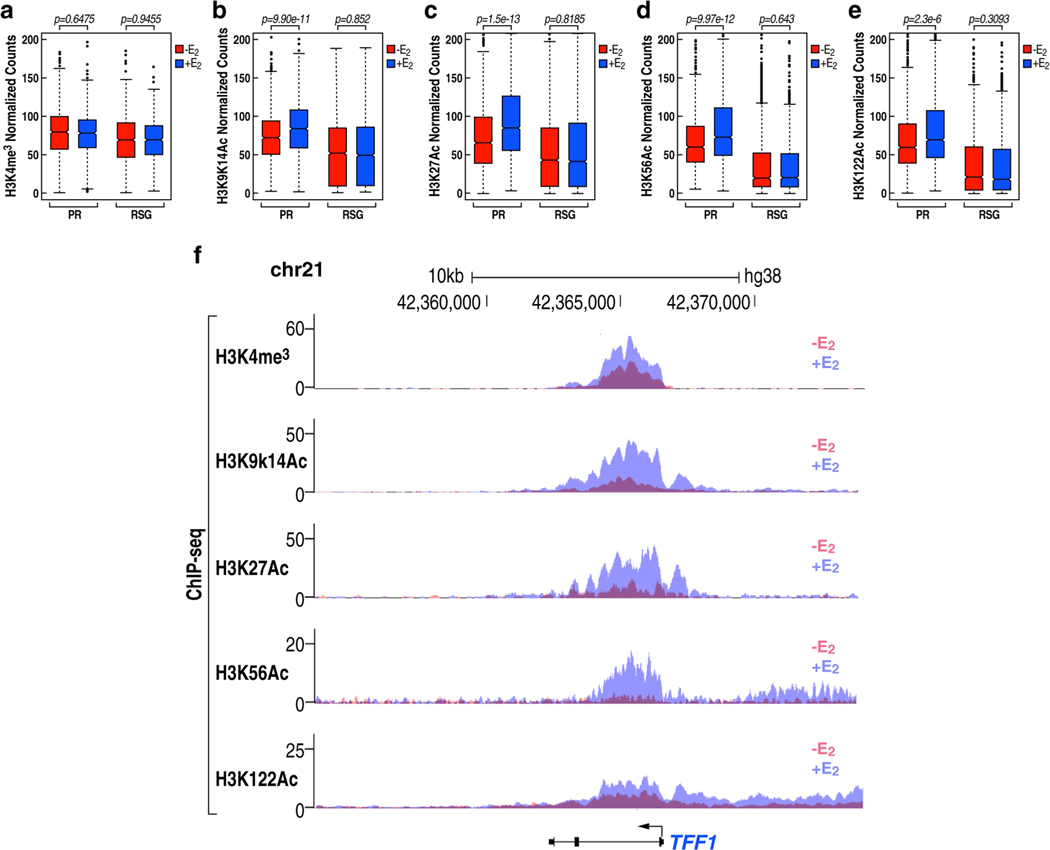
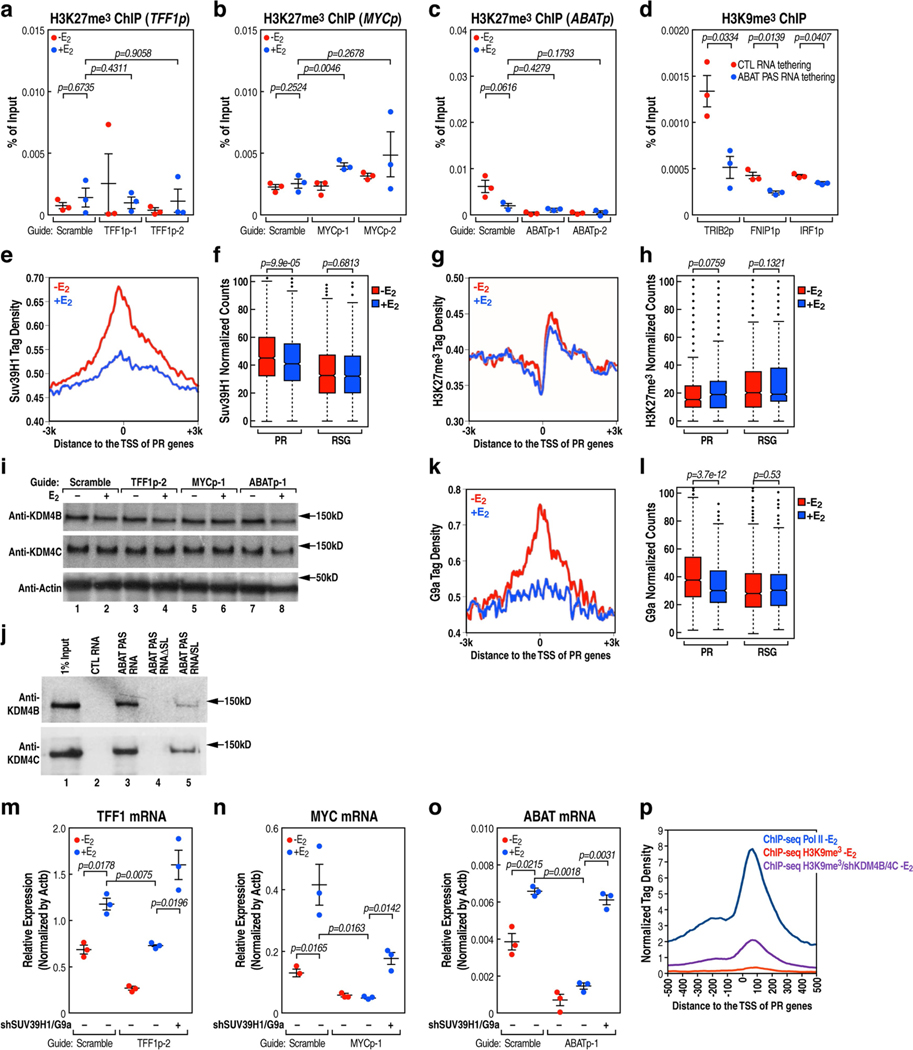
PR promoters are characterized by E2-induced recruitment of high levels of histone acetylation marks (Extended Data Fig. 6a–f). We found that, following the removal of PAS RNA, there was an increased accumulation of Pol II (Fig. 3a–c) and an increased level of H3K9me3 (Fig. 3d–f), but not H3K27me3 (Extended Data Fig. 7a–c), at these promoters. Notably, tethering ABAT PAS RNA to the promoters led to decreased promoter levels of H3K9me3 (Fig. 3g, Extended Data Fig. 7d). The H3K9me3 writer SUV39H1 was dismissed in response to E2 (Extended Data Fig. 7e, f), whereas the erasers of this H3K9me3 mark, KDM4B and KDM4C, were recruited at increased levels to the promoters after E2 treatment (Fig. 3h–k, m). These data suggest that the regulation of the H3K9me3 mark might serve as a key determinant of the inhibited gene transcription and as a mechanism that underlies promoter pausing controlled by PAS RNA. On PR gene promoters, we observed a significant decrease in the level of the H3K9me3 repressive mark (Fig. 3l, m), but not H3K27me3 (Extended Data Fig. 7g, h), following E2 treatment. The finding of an increased level of H3K9me3 at promoters after the removal of PAS RNA was not due to a change in KDM4B or KDM4C protein levels (Extended Data Fig. 7i), but was in line with the decreased binding of KDM4B or KDM4C at these promoters (Fig. 3n–s). In vivo affinity analysis indicated that both full-length and truncated ABAT PAS RNAs with a clustered stem-loop structure were capable of associating with KDM4B and KDM4C, whereas control RNA and the truncated RNA that lacked the clustered stem-loop structure failed to do so (Extended Data Fig. 7j), indicating that the clustered stem-loop structure of ABAT PAS RNAs is necessary and sufficient for interaction with KDM4B and KDM4C. G9a, an H3K9me2 methyltransferase, also showed a decline in binding to the promoters following E2 treatment (Extended Data Fig. 7k, l). Double knockdown of SUV39H1 and G9A (also known as EHMT2) substantially reversed the inhibitory effect of PAS RNA knockdown on cognate coding transcript expression (Extended Data Fig. 7m–o), confirming that PAS RNA regulates coding target gene expression by elimination of the H3K9me3 mark. Moreover, H3K9me3 showed substantial overlap with Pol II occupancy at promoters (Extended Data Fig. 7p), further implicating a direct role for H3K9me3 in Pol II pausing. The functional importance of KDM4B and KDM4C in the deposition of H3K9me3 at the PR promoters was further validated by demonstration of increased promoter levels of H3K9me3 upon knockdown of the genes encoding KDM4B and KDM4C (Fig. 4a, Extended Data Fig. 8a–c).
Fig. 3 |. H3K9me3 erasure at the promoter by PAS RNA.
a-f, ChIP-qPCR data showing the effect of PAS RNA knockdown on the accumulation of Pol II (a-c) and H3K9me3 (d-f) at the respective promoter. ‘p’ denotes promoter. g, ChIP- qPCR data showing the effect of tethering ABAT PAS RNA to the ABAT promoter on the accumulation of H3K9me3 at the ABAT promoter. h, j, ChIP-seq tag distribution analysis representing the effect of E2 on the binding of KDM4B (h) and KDM4C (j) at PR promoters. i, k, l, Box plot analysis representing the effect of E2 on the binding of KDM4B (i), KDM4C (k) and H3K9me3 (l) at the indicated promoters. The box plot parameters are the same as in Fig. 1 (n = 2 independent experiments). The P values were determined by two-sided Wilcoxon test. m, Genome browser views of the TFF1 promoter region. n-s, ChIP-qPCR data showing the effect of PAS RNA knockdown on the accumulation of KDM4B (n-p) and KDM4C (q-s) on the respective promoter. In a-g, n-s, data are shown as individual values, mean ± s.d. (n = 3). The P values were determined by one-sided Student’s t-test.
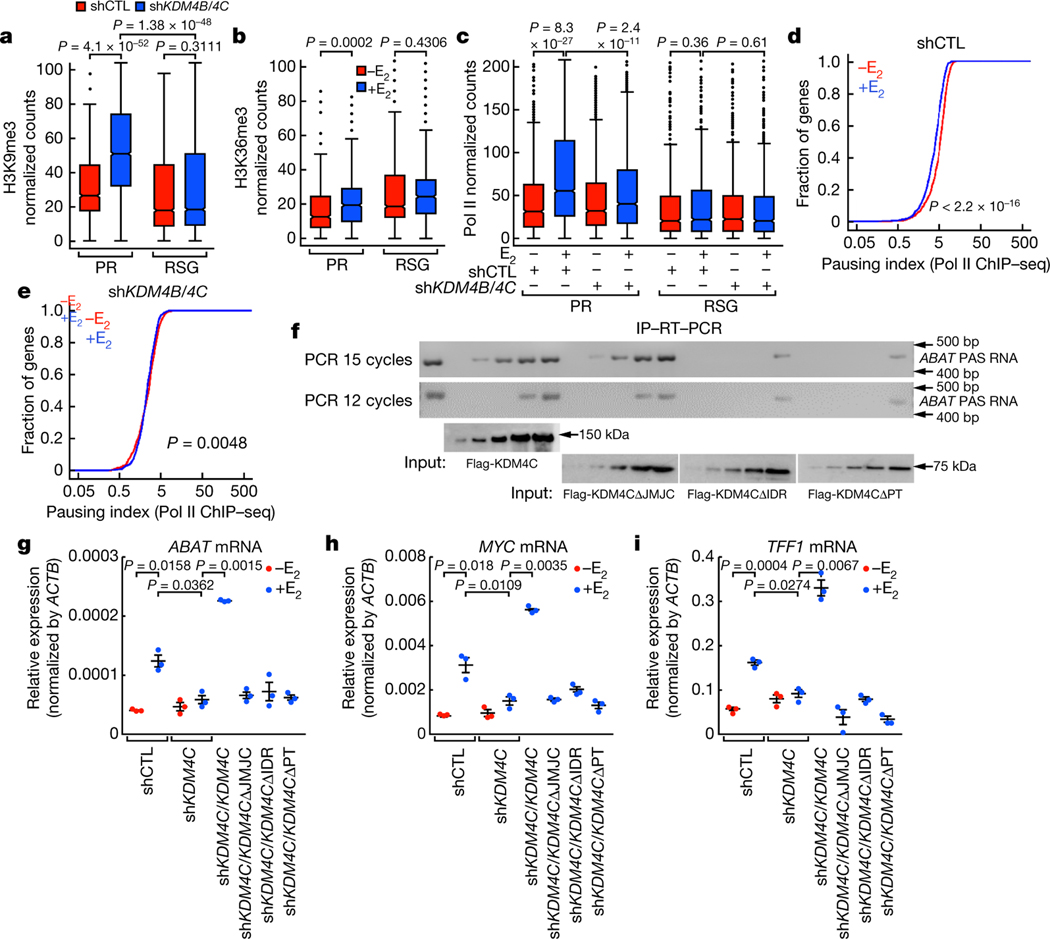
Fig. 4 |. PAS RNA stabilization of KDM4B and KDM4C at the promoter.
a-c, Box plot analysis representing the effect of KDM4B/KDM4C knockdown on the accumulation of H3K9me3 (a), the effect of E2 on H3K36me3 (b) at the indicated promoters, and the effect of KDM4B/KDM4C knockdown on Pol II occupancy over the gene bodies of the indicated genes (c). The box plot parameters are the same as in Fig. 1 (n = 2 independent experiments). The P values were determined by two-sided Wilcoxon test. d, e, Cumulative distribution of the Pol II pausing ratio based on Pol II ChIP-seq analysis (n = 2 independent experiments) of PR genes following E2 treatment in short hairpin control (shCTL) MCF-7 cells (d) or shKDM4B/KDM4C MCF-7 cells (e). The P values were determined by two-sided Kolmogorov-Smirnov test. f, In vitro immunoprecipitation (IP)-RT-PCR data showing the required intrinsically disordered region (IDR) of KDM4C for interaction with ABAT PAS RNA. The experiment was repeated three times with similar results. Gel source data are available in Supplementary Fig. 1. Flag-KDM4CΔPT denotes flag-tagged KDM4C-mutant protein lacking both the PHD and Tudor domain. g-i, RT-qPCR data showing the rescue effect of full-length KDM4C or the KDM4C mutants on the indicated gene expression (ABAT (g), MYC (h) and TFF1 (i)). Data are shown as individual values, mean ± s.d. (n = 3). The P values were determined by two-sided Student’s t-test.
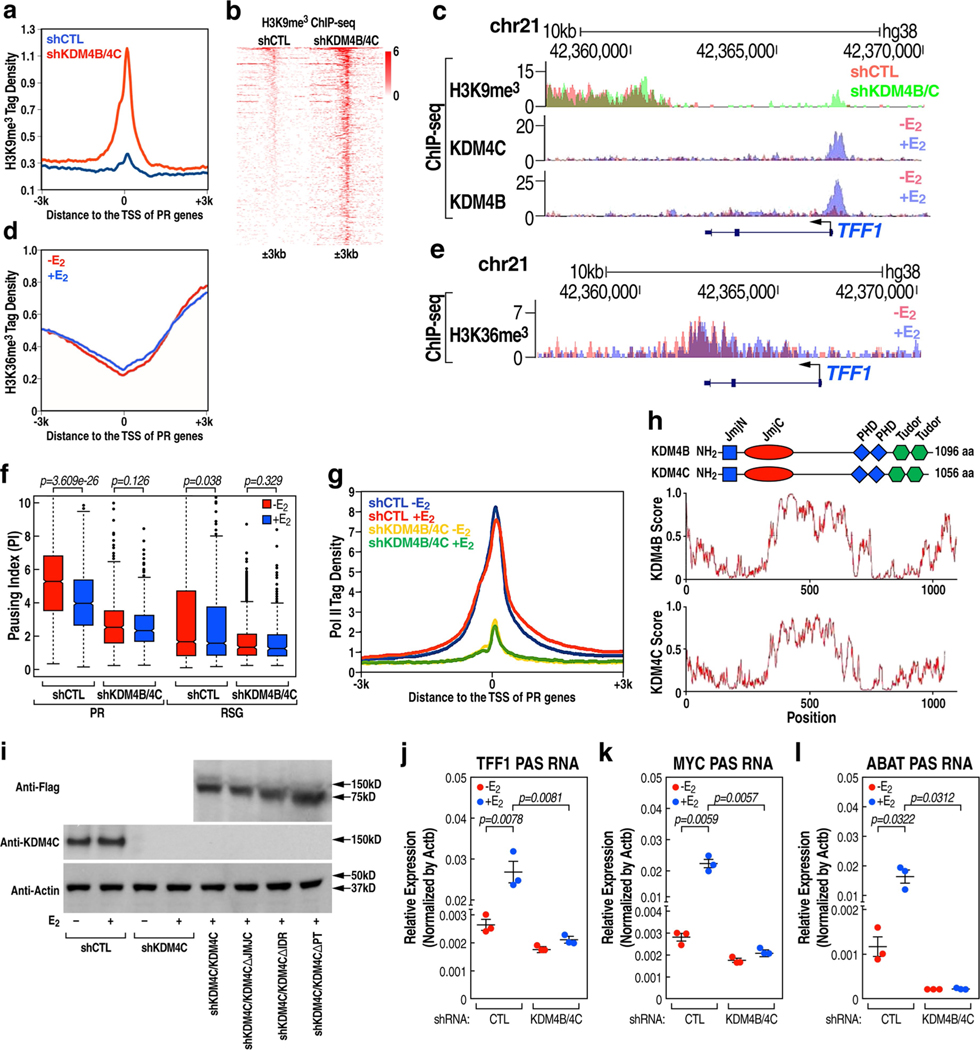
ChIP-seq revealed that H3K36me3 on PR gene promoters showed a slight increase in levels following E2 treatment (Fig. 4b, Extended Data Fig. 8d, e), indicating that KDM4B and KDM4C do not regulate pause release via demethylation of H3K36me3. E2-induced promoter-proximal pause release of PR genes was markedly compromised, and occupancy of RNA Pol II over gene body regions was markedly decreased in KDM4B/KDM4C-knockdown cells after E2 treatment (Fig. 4c–e, Extended Data Fig. 8f). A marked decrease in Pol II occupancy at PR promoters was observed in KDM4B/KDM4C-knockdown cells (Extended Data Fig. 8g). Collectively, these data show that promoter binding of KDM4B or KDM4C, regulated by PAS RNA (Fig. 3n–s), permits E2-induced gene transcription through regulation of both Pol II recruitment and pause release via demethylation of H3K9me3.
Because KDM4B and KDM4C have stretches of amino acids that are predicted to form intrinsically disordered regions (Extended Data Fig. 8h), we hypothesized that these intrinsically disordered regions might stabilize interactions with PAS RNAs. The affinity pull-down assay showed that both wild-type and mutant protein lacking the JMJC domain readily exhibited a direct interaction with ABAT PAS RNA at low concentration, whereas a mutant protein lacking the intrinsically disordered region only associated with ABAT PAS RNA at very high concentration (Fig. 4f). Overexpression of wild-type KDM4C protein restored gene expression in cells that expressed KDM4C short hairpin RNA, whereas mutants that lacked either the JMJC domain or the intrinsically disordered region were unable to restore gene expression (Fig. 4g–i, Extended Data Fig. 8i). In addition, we also observed a decreased level of PAS RNA expression in KDM4B/KDM4C-knockdown cells (Extended Data Fig. 8j–l). Together, these observations indicate that PAS RNAs are of functional importance for KDM4B-mediated and KDM4C-mediated erasure of H3K9me3 and activation of target gene transcription.
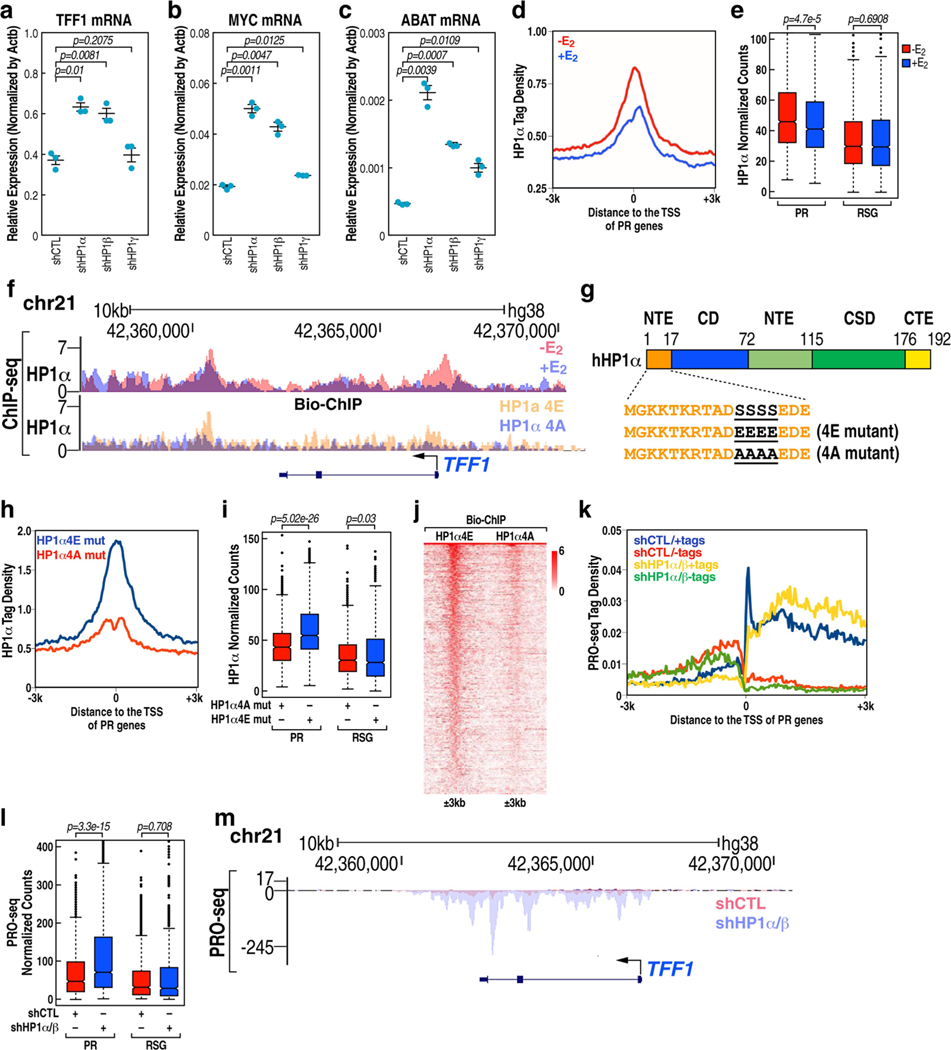
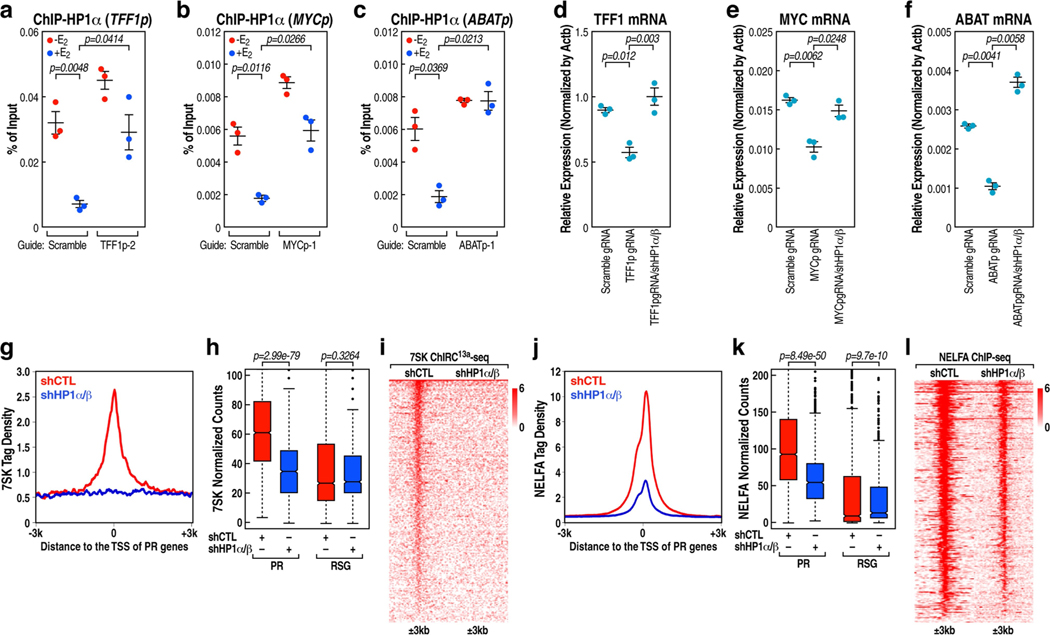
We next investigated whether HP1, as the reader of H3K9me3, might bind to PR promoters to regulate pause release. Knockdown of HP1-ALPHA (also known as CBX5) and HP1-BETA (also known as CBX1) (to a lesser extent), but not HP1-GAMMA (also known as CBX3) significantly facilitated TFF1, MYC and ABAT mRNA expression (Extended Data Fig.9a–c). ChIP-seq analysis revealed that HP1α, localized on PR promoters in the absence of E2 treatment, was dismissed in response to E2 (Extended Data Fig. 9d–f). Consistent with the observation that phosphorylation of serine residues in the N-terminal extension region of HP1α markedly increases its affinity for H3K9me3 (ref. 35), ChIP-seq analysis revealed that the phospho-mimetic mutant of HP1α exhibited significantly higher enrichment on PR promoters than did the phospho-compromised mutant of HP1α (Extended Data Fig. 9f–j). Double knockdown of HP1-ALPHA and HP1-BETA led to significant pause release and activation of transcription on PR genes (Extended Data Fig. 9k–m). Upon loss of PAS RNA, increased binding of HP1α at the promoter was observed (Extended Data Fig. 10a–c). Conversely, knockdown of HP1-ALPHA and HP1-BETA reversed the reduction of target gene expression caused by knockdown of PAS RNA (Extended Data Fig. 10d–f). Indeed, knockdown of HP1-ALPHA and HP1-BETA significantly abolished the binding of both 7SK snRNA and NELFA to these promoters (Extended Data Fig. 10g–l). Together, these results indicate that E2-induced PAS RNA ensures dismissal of H3K9me3-HP1α-7SK-NELFA assembly by recruitment of KDM4B or KDM4C, allowing robust coding gene transcription.
Role of KAP1 in transcription
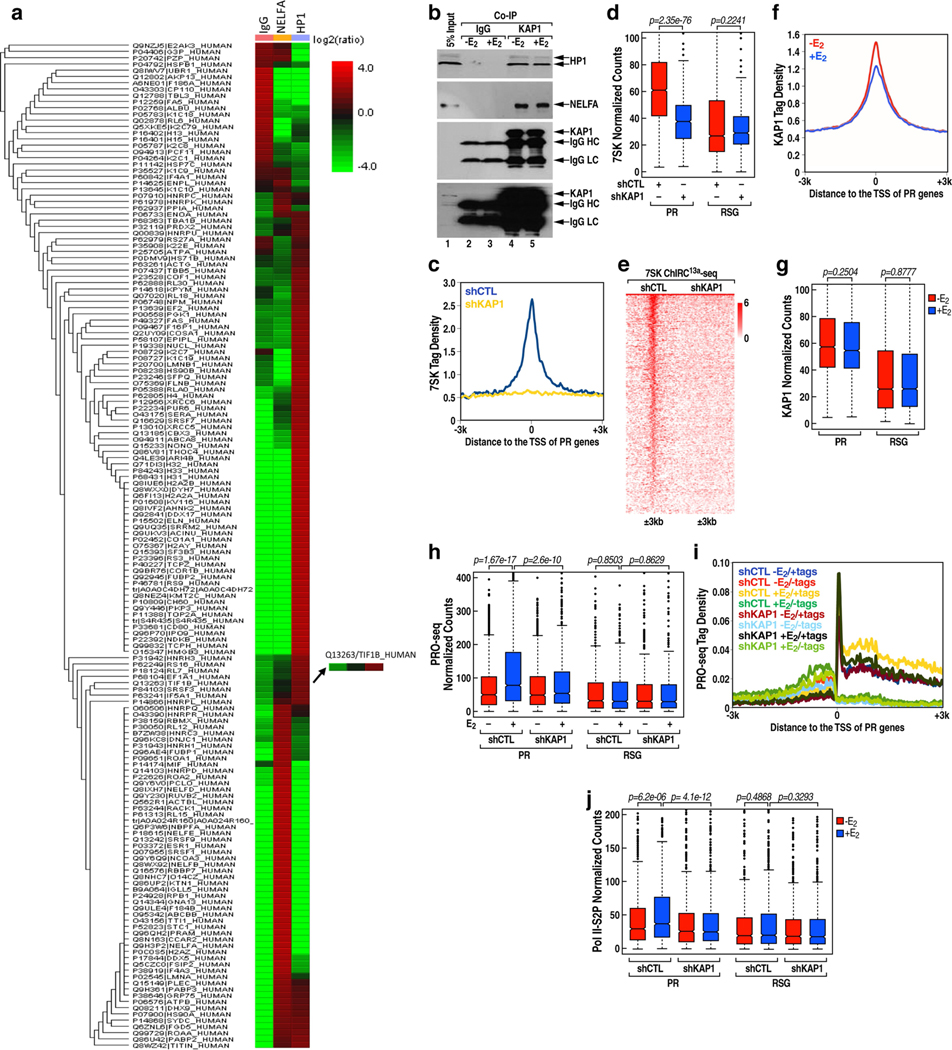
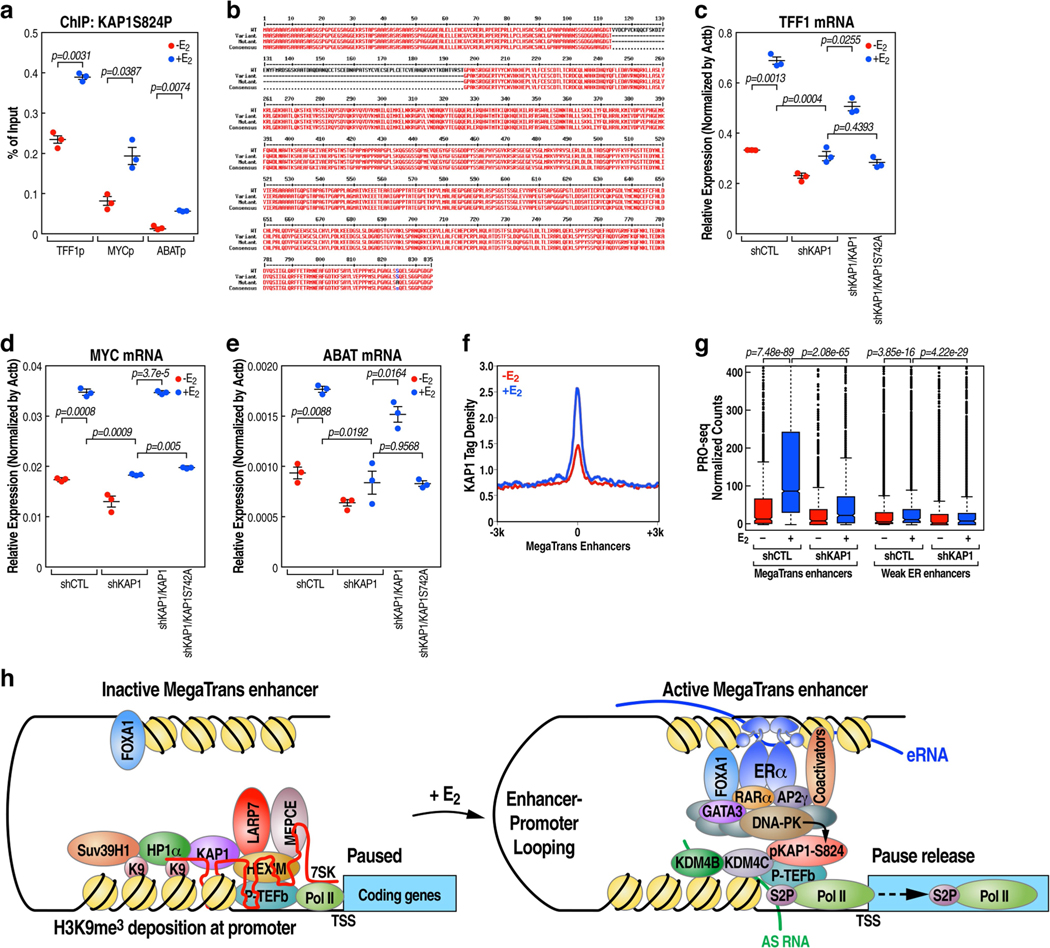
Mass spectrometry validated that KAP1 (also known as TRIM28) was a major interacting partner of HP1 (Extended Data Fig.11a, b). In line with a previous report that KAP1 can recruit 7SK snRNP to target gene promoters via direct interaction36, we found a complete loss of 7SK snRNA binding to PR promoters upon knockdown of KAP1 (Extended Data Fig.11c–e). Overall, these results support a model in which KAP1 promotes Pol II promoter-proximal pausing via stabilization of the 7SK snRNA complex at the promoter in the basal state. However, KAP1 was not dismissed at PR promoters following E2 treatment (Extended Data Fig. 11f, g), and knockdown of KAP1 caused inhibition of the E2-mediated increase in the expression of target coding genes (Extended Data Fig. 11h, i) and reduction of Ser2-phospho-Pol II (that is, Pol II phosphorylated at Ser2 on the carboxy terminal domain of its largest subunit) occupancy within the gene body (Extended Data Fig.11j). Previously, it has been noted that KAP1 can be phosphorylated at S824, which is associated with an activation function37. We performed a ChIP-quantitative PCR analysis using an anti-phospho-KAP1(S824)-specific antibody, and found that phospho-KAP1(S824) was effectively recruited to TFF1, MYC and ABAT gene promoters following E2 treatment (Extended Data Fig.12a). While wild-type KAP1 substantially restored gene expression in cells expressing KAP1 short hairpin RNA following E2 treatment, gene expression was not restored following overexpression of the KAP1(S824A) mutant (Extended Data Fig.12b–e). We observed an increase in the level of KAP1 recruitment to the E2-induced MegaTrans enhancers (Extended Data Fig. 12f), with KAP1 knockdown causing a marked decrease in the level of MegaTrans enhancer RNA (Extended Data Fig.12g) and coding target gene transcription (Extended Data Fig.11h, i). In line with a previous report that DNA-dependent protein kinase (DNA-PK) is the KAP1 S824 kinase37 and that DNA-PK catalytic subunit (DNA-PKcs) is rapidly recruited to MegaTrans enhancers following E2 treatment22, we suggest that KAP1, recruited on the ligand-dependent MegaTrans enhancers and perhaps subsequently phosphorylated at S824 by MegaTrans enhancer-bound DNA-PK, may be the source of the phospho-KAP1 on E2-activated target gene promoters.
Conclusions
Here, we exploited a strategy (ChIRC13a-seq) for identifying lncRNA interactions in the genome to uncover the role of induced PAS transcripts in the regulation of promoter-proximal pause release (Extended Data Fig. 12h). We linked the PAS RNAs induced by E2 to a large promoter-proximal pause release transcriptional program based on the sharing of a similar stem-loop cluster RNA structure, which is responsible for the recruitment of KDM4B and KDM4C to ensure erasure of the basal H3K9me3 promoter mark, releasing HP1α recruited to promoters under basal conditions. Our data reveal that phosphorylation of KAP1 is required for its recruitment to E2-induced MegaTrans enhancers, where phospho-KAP1 is required for effective robust enhancer activation, as well as subsequent promoter pause release events.
Online content
Any methods, additional references, Nature Research reporting summaries, source data, extended data, supplementary information, acknowledgements, peer review information; details of author contributions and competing interests; and statements of data and code availability are available at https://doi.org/10.1038/s41586-021-03589-x.
Methods
Cell culture and antibody DNA information
MCF-7 and HEK293T cells were cultured in DMEM, 10% FBS and 1% penicillin-streptomycin in a humidified incubator with 5% CO2 at 37 °C. For oestrogen stimulation, these cells were cultured in phenol-red free DMEM with 5% charcoal-stripped FBS for 3 days and then treated with 100 nM E2 for 40 min. Control samples were treated with ethanol. Ten micrograms of anti-Pol II, anti-NELFA anti-KDM4B, anti-KDM4C, anti-HP1α, anti-KAP1, anti-phospho KAP1(S824A), anti-SUV39H1, anti-G9a and anti-HEXIM1 was used for each ChIP experiment; four micrograms of anti-H3K4me3, anti-H3K9me3, anti-H3K27me3, anti-H3K36me3, anti-H3K9K14ac, anti-H3K27ac, anti-H3K56ac and anti-H3K122ac was used for each ChIP experiment. For western blot, anti-KDM4B, anti-KDM4C, anti-actin, anti-HP1, anti-NELFA and anti-KAP1 were diluted with 1:1,000; anti-flag was diluted with 1:4,000. The antibodies used in this study are listed in Supplementary Table 1.
Real-time RT-PCR
RNA was extracted using RNeasy column (74106, Qiagen), and 1 μg total RNA for each sample was used for reverse transcription using SuperScript III Reverse Transcriptase (18080044, Thermo Fisher Scientific). Quantitative PCRs were performed with MX3000P (Stratagene) using the VeriQuest Fast SYBR Green qPCR master mix (75690, Affymetrix). For normalization, ΔCt values were calculated relative to the levels of ACTB transcripts. Experiments were performed with three independent biological replicates for each experiment. Primers are listed in Supplementary Table 1.
ChIP-seq
ChIP was performed as previously described24 with minor modifications. All of the ChIP experiments (except G9a ChIP samples prepared by double crosslinking with formaldehyde and disuccinimidyl glutarate (DSG)) were performed with formaldehyde crosslinking. Briefly, approximately 5 × 10⁷ cells were crosslinked with 1% formaldehyde at room temperature for 15 min and quenched with 0.125 M glycine for 5 min. Cells were then harvested and incubated with nuclei preparation buffer (50 mM Tris pH 7.5, 150 mM NaCl, 5 mM EDTA, 0.5% NP-40 and 1% TX-100), with protease inhibitor (P2714-1BTL, Sigma) included, for 10 min. After centrifugation, the pellet was suspended in sonication buffer (10 mM Tris pH8.0, 100 mM NaCl, 1 mM EDTA, 0.5 mM EGTA, 0.1% Na-deoxycholate and 0.5% N-lauroylsarcosine, with protease inhibitor included) for sonication. After sonication, 1/10 volume of 10% Triton X-100 was added to sonicated lysate. The supernatant, after centrifugation, was then incubated with 10 μg of antibody at 4 °C overnight. Immunoprecipitated complexes were collected using Protein G magnetic beads (10004D, Thermo Fisher Scientific). Immunocomplexes were washed with RIPA buffer (50 mM HEPES-KOH pH 7.6, 500 mM LiCl, 1 mM EDTA, 1% NP-40 and 0.7% Na-deoxycholate, with protease inhibitor included) at least five times and with TE buffer containing 50 mM NaCl once. After decrosslinking, DNA was then purified by QIAquick Spin columns (28106, Qiagen). For ChIP-seq, the extracted DNA was ligated to specific adaptors followed by deep sequencing with the Illumina’s HiSeq 2500 system according to the manufacturer’s instructions.
Bio-ChIP
MCF-7 cells (5 × 10⁷) stably expressing BirA and biotin acceptor peptide (BAP)-HP1α (4A), BAP-HP1α (4E) or BAP-dCas9-gRNA were crosslinked with 1% formaldehyde at room temperature for 15 min, and then incubated with 0.125 M glycine for 5 min. To isolate nuclei, cells were incubated with nuclei preparation buffer (50 mM Tris pH 7.5, 150 mM NaCl, 5 mM EDTA, 0.5% NP-40 and 1% Triton X-100), with protease inhibitor (P2714-1BTL, Sigma) included, for 10 min. The obtained nuclei were suspended in immunoprecipitation (IP) buffer (50 mM HEPES pH 7.5, 150 mM NaCl, 1 mM EDTA, 0.1% SDS, 0.1% Na-deoxycholate and 1% Triton X-100, with protease inhibitor included) for sonication. The sonicated chromatin in IP buffer was then incubated with 50 μl of pre-blocked Pierce Streptavidin Magnetic Beads (88816, Thermo Fisher) overnight at 4 °C on a rotating wheel. Beads were extensively washed with SDS buffer (10 mM Tris pH 8, 1 mM EDTA and 2% SDS, with protease inhibitor included) twice, high-salt buffer (50 mM HEPES pH 7.5, 1 mM EDTA, 1% Triton X-100, 0.1% Na-deoxycholate and 500 mM NaCl) twice, DOC buffer (250 mM LiCl, 0.5%, NP-40, 0.5% deoxycholate, 1 mM EDTA and 10 mM Tris pH 8) once and TE buffer containing 50 mM NaCl once. Beads were then treated with RNase A (AM2270, Thermo Fisher Scientific) and proteinase K (AM2548, Thermo Fisher Scientific) before decrosslinking overnight at 65 °C. DNA was finally purified by QIAquick Spin columns (28106, Qiagen). For Bio-ChIP-seq, the extracted DNA was ligated to specific adaptors followed by deep sequencing with the Illumina’s HiSeq 2500 system according to the manufacturer’s instructions.
Bio-RIP
MCF-7 cells (2 × 10⁶) stably expressing BirA, single gRNA-PAS RNA fusion and BAP-dCas9 (ref. 38) (100547, Addgene) were treated with nuclear lysis buffer (10% glycerol, 0.5% NP-40, 10 mM Tris-Cl pH 7.5, 2 mM MgCl2, 3 mM CaCl2 and 2 U/ml SUPERase•In RNase Inhibitor) for 10 min before centrifugation to isolate nuclei. Nuclei were then lysed and cell lysates were incubated with 30 μl of pre-blocked Pierce Streptavidin Magnetic Beads (88816, Thermo Fisher) at 4 °C for 3 h. Beads were extensively washed with high-salt wash buffer (50 mM Tris pH 7.4, 300 mM NaCl, 0.5% Triton X-100 and 2 U/ml SUPERase•In RNase Inhibitor) once, median-salt wash buffer (10 mM Tris pH 7.4, 150 mM NaCl, 0.1% Triton X-100 and 2 U/ml SUPERase•In RNase Inhibitor) once and low-salt wash buffer (5 mM Tris pH 7.4, 50 mM NaCl, 0.1% Triton X-100 and 2 U/ml SUPERase•In RNase Inhibitor) once. To isolate protein-associated RNA, samples were treated with DNase I (0303, NEB) and proteinase K (AM2548, Thermo Fisher Scientific), and RNAs were extracted by phenol/chloroform. Purified RNAs were then subjected to real-time RT-PCR analysis.
Run-on sequencing
Precision run-on sequencing (PRO-seq) experiments were performed as previously described39. Briefly, MCF-7 cells, for nuclei isolation, were incubated with swelling buffer (10 mM Tris-Cl pH 7.5, 2 mM MgCl2 and 3 mM CaCl2) for 5 min on ice and then incubated with lysis buffer (swelling buffer with 0.5% NP-40 and 10% glycerol) for 5 min on ice, before being re-suspended in 100 μl of freezing buffer (50 mM Tris-Cl pH 8.0, 40% glycerol, 5 mM MgCl2 and 0.1 mM EDTA). For the run-on assay, an equal volume of reaction buffer (10 mM Tris-Cl pH 8.0, 5 mM MgCl2, 300 mM KCl, 1 mM dithiothreitol, 20 units of SUPERase•In, 1% sarkosyl, and 500 μM ATP, GTP, bio-UTP and bio-CTP) was added into each sample before incubation at 30 °C for 5 min. The nuclear run-on RNA was then extracted with TRIzol LS reagent (10296010, Invitrogen) and subjected to hydrolysis, buffer exchange and purification by streptavidin beads (88816, Thermo Fisher). Purified RNA was treated with PNK before being used for complementary DNA synthesis by using the NEBNext Multiplex Small RNA Library Prep Set for Illumina Kit (E7300S, NEB). Obtained complementary DNA template was amplified by PCR using the Phusion High-Fidelity enzyme (M0530L, NEB) for deep sequencing.
ChIRC13a-seq
All of the experiments were performed in an RNase-free environment and every buffer used in the experiment was supplemented with SUPERase•In RNase Inhibitor (AM2696, Thermo Fisher Scientific). Briefly, 5 × 10⁷ cells stably expressing BAP-dCas13a, BirA and corresponding gRNA were crosslinked with 1% formaldehyde at room temperature for 15 min before being quenched with 0.125 M glycine for 5 min. Cells were first incubated in lysis buffer 1 (10 mM Tris pH 7, 10 mM EDTA, 0.5 mM EGTA and 0.25% Triton X-100, with protease inhibitor included) for 10 min on ice for nuclei isolation. After centrifugation, the pellet was suspended in IP buffer (50 mM HEPES pH 7, 150 mM NaCl, 1 mM EDTA, 0.1% SDS, 0.1% Na-deoxycholate and 1% Triton X-100, with protease inhibitor included) for sonication. The supernatant, after centrifugation, was then incubated with 50 μl of pre-blocked Pierce Streptavidin Magnetic Beads (88816, Thermo Fisher) at 4 °C overnight. Beads were then washed with SDS buffer (10 mM Tris pH 8, 1 mM EDTA and 2% SDS, with protease inhibitor included) twice, high-salt buffer (50 mM HEPES pH 7.5, 1 mM EDTA, 1% Triton X-100, 0.1% Na-deoxycholate and 500 mM NaCl) twice, DOC buffer (250 mM LiCl, 0.5%, NP-40, 0.5% deoxycholate, 1 mM EDTA and 10 mM Tris pH 8) once and TE buffer containing 50 mM NaCl once. After RNase A, proteinase K treatment and decrosslinking, DNA was then purified by QIAquick Spin columns (28106, Qiagen). For ChIRC13a-seq, the extracted DNA was ligated to specific adaptors followed by deep sequencing with the Illumina’s HiSeq 2500 system according to the manufacturer’s instructions.
IP-RT-PCR
IP-RT-PCR was performed as previously described40. Briefly, KDM4C wild type and the relevant mutants were fused in-frame with the N terminus of 1X FLAG-tagged peptide (DYKDDDDK) in the third generation lentiviral vector with blasticidin-S resistance marker. HEK293T cells grown on a 15-cm dish were transfected with 16 μg of each plasmid. Cells were cultured with DMEM medium containing 20% FBS (4 ml of fetal bovine serum added in 16 ml of DMEM medium) for another 24 h and then blasticidin-S was added for selection. After selection, cells were lysed and cell lysates were precleared with protein G beads (10004D, Invitrogen) before they were incubated with anti-Flag M2-agarose (A2220, Sigma) at 4 °C for 3 h. After extensive washing, the bead-bound immunocomplexes were eluted using 3X Flag peptides (F4799, Sigma) according to the manufacturer’s instructions. The purified Flag protein, with the given concentrations, was then incubated with 500 ng in vitro transcribed and folded ABAT PAS RNA in hypotonic buffer supplemented with SUPERase•In RNase Inhibitor (AM2696, Thermo Fisher Scientific) for 1 h before extensive washing. To isolate protein-associated RNA, samples were treated with proteinase K, and RNAs were extracted by phenol/chloroform. Purified RNAs were then subjected to RT-PCR analysis.
In vitro transcription of ABAT PAS RNA
To synthesize ABAT PAS RNA transcripts, the DNA template sequence (GGGCTGGGAGGGAGTCCTGGGACTGGGGAGGAGACGGCTGAGGACCC CCGTCAAGTTGTGGGGACCCTGACCCTCTGGGGGGCAGCTCCATAGGT TGATTTAACCTGGATCTTAATGGGCCATTTACACCCTCAGGGCTGCAGG CGAGTGTAACTCCACCTCCACCCGCGTCTCGGATCCGGTCTCTGGAGCT CCAGAGTCGGAATCAGAAGGGGTTCCTTTGCGGAGAAGGGAAGGAGC ATCCCGCCCTCCCCACCTCACTCCCCATCTCGGCGCTCAGGGCCCTGC CAGCCCTTCTTGCTCCCAGCTACTTTCCTCCGCCTGGCCCCAGCGCTC CGGAAGACAAACAGGGCGCTGGGAGTCAGAGGTGGTTCCTTCTGCATG ACCTGGA) was appended with a T7 minimum promoter sequence (TAATACGACTCACTATAGGG) at the 5′ end. In vitro transcription was then performed using the MEGAscript T7 Transcription Kit (AM1334, Thermo Fisher Scientific) according to the instructions provided by the manufacturer.
RNA tethering
CRISPR-dCas9-mediated RNA tethering was performed as previously described41. The CMV/3′Box system (Cytomegalovirus immediate-early promoter-enhancer-driven Pol II promoter paired with the U1 3′-Box derived from the U1 small nuclear RNA gene that directs specialized Pol II transcription termination without polyadenylation) was used to ensure robust nuclear single gRNA-PAS RNA expression. pEF1a-FB-dCas9-puro38 (100547, Addgene) was chosen for CRISPR-dCas9 expression. Briefly, MCF7 cells were transfected with plasmid for expressing FB-dCas9 and the indicated gRNA-RNA scaffold transcripts for 24 h and then subjected to antibiotics selection for positively transfected cells. These cells were then cultured in phenol-red-free DMEM with 5% charcoal-stripped FBS for at least 3 days in the presence of antibiotics before being harvested for RNA isolation and subsequent real-time RT-PCR. For analysis of real-time RT-PCR data generated from RNA tethering samples, the Shapiro-Wilk test was computed first to verify the normal distribution of the real-time RT-PCR data before the P value was calculated with a two-sided Welch’s t-test. For control RNAs used in the RNA tethering experiment, control RNA is a RNA linker sequence appended with the U1 3′-Box derived from the U1 small nuclear RNA gene to ensure robust nuclear single gRNA-RNA expression; Anril RNA is a partial RNA sequence from lncRNA Anril; pRNA (also known as NoRC-associated RNA, a lncRNA involved in rDNA silencing by interacting with the NoRC chromatin remodelling complex) is from the repressive NoRC-binding pRNA stem-loop region; and RepA is from the A-repeat domain of lncRNA XIST. The RNA sequences used in the RNA tethering experiment are available in Supplementary Table 2.
CRISPRa
CRISPR-dCas9-mediated transcriptional activation was performed as previously described42.
RNA interference
HEK293T cells grown on a 6-cm dish were transfected with 2 μg of PLKO.1-expressing indicated short hairpin RNA, 2 μg of psPAX2 packaging plasmid (12260, Addgene) and 1 μg of pMD2.G envelope plasmid (12259, Addgene). Twenty-four hours after transfection, the cells were cultured with DMEM medium containing 20% FBS (2 ml of fetal bovine serum added in 8 ml of DMEM medium) for another 24 h before the culture medium containing lentivirus particles was cleared by centrifugation to get rid of the cell debris at 10,000g for 5 min, and it was used for the infection of the target cells.
SHAPE-MaP
SHAPE probing was performed as previously described43 with minor modifications. Briefly, 500 ng in vitro transcribed ABAT PAS RNA was folded and structurally probed by 100 mM 1-methyl-7-nitroisatoic anhydride (1M7; 908401, Sigma) for 75 s. The same procedure was also performed with DMSO for untreated control samples. RNA was then isolated with TRIzol LS reagent (10296010, Invitrogen) and suspended in nuclease-free water for SHAPE-MaP reverse transcription by adding 1 μl of SuperScript II Reverse Transcriptase (18064022, Thermo Fisher), 6 mM MnCl2 (M1787, Sigma) and 2 μM gene-specific primer. All primers used in SHAPE-MaP are listed in Supplementary Table 1. Second-strand synthesis was performed with Q5 hot start high-fidelity DNA polymerase (M0492S, NEB), and the resulting PCR library products were further isolated by QIAquick Spin columns (28106, Qiagen) followed by deep sequencing with Illumina’s MiSeq PE250 system according to the manufacturer’s instructions.
Bioinformatics analysis of high throughput-seq samples
The computational analysis of ChIP-seq, ChIRC-seq, PRO-seq or GRO-seq samples was performed by using shell or R 3.5 scripts that encoded the following steps: (1) For quality control, FASTQC 0.11.7 (https://www.bioinformatics.babraham.ac.uk/projects/fastqc/) and TRIMMOMATIC 0.38 (http://www.usadellab.org/cms/?page=trimmomatic) were used to inspect the quality of the sequencing reads and to trim the sequencing adaptors, if necessary.(2) For read alignment, Bowtie2-2.344 was used to align ChIP-seq, ChIRC-seq and PRO-seq samples to the hg38 genome, and we kept a one copy per read per genome position. (3) For peak finding, we called the ChIP-seq and ChIRC13a-seq peaks by using HOMER4.10 findPeaks subroutine45 (http://homer.ucsd.edu/homer/). For the ChIP-seq analysis, we used the default settings in HOMER 4.10. For the ChIRC13a-seq analysis, we used the input samples to estimate the background. (4) For read counting, we used the HOMER 4.10 scripts analyseRNA.pl and analyseRepeats.pl to estimate the raw counts per gene in POL2-seq and PRO-seq data, and to compute the pausing ratio. The aligned reads were counted over the RefSeq gene bodies after excluding 200 bp downstream of the transcription start site (TSS). Another HOMER 4.10 script annotatePeaks.pl was used to estimate the raw counts on genomic regions surrounding the TSS. (5) For the generation of bedgraph files, we used the HOMER 4.10 scripts makeUCSCfile and makeMultiWigHub. pl to generate bedgraph files for visualization in the UCSC genome browser. (6) The normalization on specific genomics regions (genes and TSS areas) was done using the TMM normalization procedure in edgeR 3 (ref. 46), and the normalized counts were obtained by using cpm function. The R/BioC environment was used for the display of the box plots and for computing the statistical significance. In terms of pausing analysis, the paused genes were defined based on a pausing ratio >2 (before E2 treatment); the pausing ratio was computed in HOMER 4.10. To display the heat maps, we used the R packages pheatmap and gplots. The package edgeR 3 has been used to call the differentially regulated genes in response to E2 stimulation based on GRO-seq data.
For the computational analysis of ShapeMap data, we used the ShapeMapper 2.1.5 pipeline47 (https://github.com/Weeks-UNC/shapemapper2) using the parameters (-min-depth 1,000-modified -untreated) and the sequences of the primer set ‘GGGCTGGGAGG-GAGTCCTG’ and ‘GGTCATGCAGAAGGAACCAC’. The .shape files generated by ShapeMapper have been used with the RNAfold webserver (http://rna.tbi.univie.ac.at/cgi-bin/RNAWebSuite/RNAfold.cgi).
For the computational predictions of PAS RNA or mRNA structures, we used ScanFold48 (https://github.com/moss-lab/ScanFold) and a window size of 120 nucleotides, with a step size of 40 nucleotides, and ‘di’ randomization type to compute the minimum free energy and the associated z-scores. The mRNA sequences were downloaded from ftp.ncbi.nlm.nih.gov/refseq/H_sapiens/annotation/GRCh38_latest/, and the synthetic RNA sequences of length 500 or 1,000 nucleotides were generated using the functions provided by the packages kebabs and Rbioinf in Bioconductor 3.1. This work used computing resources provided by the UCSD and Stanford Genetics Bioinformatics Service Center.
Statistics and reproducibility
For Fig. 4f and Extended Data Figs. 7i, j, 8i, 11b, each experiment was repeated three times with similar results. Gel source data are available in Supplementary Fig. 1. The RT-qPCR experiments and ChIP-qPCR experiments in this study were performed with three independent biological replicates. Data are presented as the mean ± s.d. The P values were calculated by two-sided unpaired Student’s t-test if without specification. For P value calculation from the RNA tethering experiment data, the Shapiro-Wilk test was computed first to verify the normal distribution of the real-time RT-PCR data before P values were computed with two-sided Welch’s t-test. The ChIP-seq, ChIRC13a-seq, Bio-ChIP-seq and PRO-seq experiments were performed with two independent biological replicates if without specification. In the figures of the genomics data, the box plots were displayed in R 3.5 and denote the medians and the interquartile ranges, with upper and lower whiskers. The upper whisker is located at the smaller value of the maximum x value and quartile 3 + 1.5 times the interquartile range, whereas the lower whisker is located at the larger value of the smallest x value and quartile 1 - 1.5 times the interquartile range. The P values were calculated from two-sided Wilcoxon test. For P value calculation of Figs. 1a, 4d, e and Extended Data Figs. 1d, 2b, empirical cumulative distribution function denotes the fraction of genes bound by RNA Pol II with a pausing index less than or equal to an indicated value. The P values of Kolmogorov-Smirnov statistics of empirical cumulative distribution function were calculated with two-sided Kolmogorov-Smirnov test in R 3.5.
Reporting summary
Further information on research design is available in the Nature Research Reporting Summary linked to this paper.
Data availability
The reagents, antibodies, primers and oligo DNA used in this study are listed in Supplementary Table 1. RNA sequences used in the RNA tethering experiments are available in Supplementary Table 2. The sequencing datasets generated from this study are deposited in the Gene Expression Omnibus (GEO) database using accession ID GSE139199. The GRO-seq datasets used in this study were downloaded from GSE41324. The ATAC-seq datasets used in this study were downloaded from GSE99544. The H3K27ac ChIP-seq datasets used in this study were downloaded from GSE62229. Source data are provided with this paper.
Code availability
The code used in this study is available at: https://github.com/tanasa/the_scripts_analysis_ChIP_seq_PRO_seq.
Extended Data
Extended Data Fig. 1 |. PAS RNA and Pol II promoter proximal pause release induced by E2.
a, Box plot analysis of the pausing ratio based on GRO-seq data set in GSE41324 (n = 3 independent experiments) for PR genes and 837 randomly selected genes (RSG), in the absence or presence of E2 treatment. We hereafter use the abbreviations ‘PR’ for ‘the 837 upregulated genes with Pol II pause release’, and ‘RSG’ for ‘the 837 randomly selected genes’. b, Heat map representation of GRO-seq (GSE41324) normalized tag counts centred on the 837 PR promoters (±3 kb) showing robust PAS RNA transcription at PR promoters induced by E2. c, Box plots analysis of Pol II ChIP-seq data representing the effect of E2 on Pol II occupancy over the gene bodies of the PR versus the gene bodies of RSG. d, Cumulative distribution of the Pol II pausing ratio based on Pol II ChIP-seq analysis for the PR genes in the absence or presence of E2 treatment. Data were generated in two independent experiments. The P value was calculated with two-sided Kolmogorov- Smirnov test. e, Box plot analysis of the pausing ratio based on Pol II ChIP-seq data for PR genes and RSG, in the absence or presence of E2 treatment. f, ChIP-seq tag distribution analysis representing the effect of E2 on NELFA binding at the promoters of PR genes. g, Heat map of NELFA ChIP-seq analysis representing the effect of E2 on NELFA binding at the promoters of PR genes. h, Heat map of NEAT1 ChIRC13a-seq showing a subset of NEAT1 binding sites marked with promoter mark H3K4me3, revealing that lncRNA NEAT1 localized to approximately 603 promoters in the absence of E2 treatment. i, Genomic distribution of 7SK snRNA in the basal (-E2) condition. Consistent with 7SK function regulating promoter-proximal pausing of Pol II, a large number of 7SK binding sites were localized on the promoter region of a large set of genes (n = 6,885, about 54.9% of its total binding sites). Unexpectedly, a large number of 7SK binding sites were also found to be located on intronic (n = 1,351, about 10.8% of its total binding sites) and intergenic (n = 2,144, approximately 17.1% of its total binding sites) regions. j, ChIRC13a-seq tag profile representing the effect of E2 treatment on 7SK binding at PR promoters. k, Heat map of 7SK ChIRC13a-seq analysis representing the effect of E2 on 7SK binding at the promoters of PR genes. l, Box plot analysis of HEXIM1 ChIP-seq data representing the effect of E2 on HEXIM1 binding at PR promoters and RSG promoters. m, Heat map of HEXIM1 ChIP-seq data representing the effect of E2 on HEXIM1 binding at the PR promoters. In a, c, e, l, the box plots denote the medians, the interquartile ranges and the whiskers. Data were generated in two independent experiments. The P values were calculated with two-sided Wilcoxon test.
Extended Data Fig. 2 |. E2-induced Pol II pause release occurs specifically on PR genes.
a, Box plot analysis of GRO-seq data set in GSE41324 showing the decrease of the pausing ratio at PR genes, in contrast to the 239 E2-upregulated genes that do not show pause release, following E2 treatment. These 239 genes, if without specification, are hereafter defined as non-PR genes. b, Cumulative distribution of the Pol II pausing ratio based on Pol II ChIP-seq analysis for the non-PR genes following E2 treatment. Data were generated in two independent experiments. The P value was calculated with two-sided Kolmogorov-Smirnov test. c, Box plot analysis of GRO-seq data set in GSE41324 showing robust gene expression of PR and non-PR genes following E2 treatment. d, Box plot analysis of GRO-seq data of the datasets in GSE41324 showing PAS RNA expression at the promoters of PR genes and at the promoters of non-PR genes, in the absence or presence of E2 treatment. To compute PAS RNA expression, we counted the number of GRO-seq reads on 1-kb region in front of the TSS, on the opposite strand, as informed by the GRO-seq profiles around TSS regions. e, Box plot analysis of 7SK ChIRC13a-seq data representing the effect of E2 on 7SK binding at PR and non-PR promoters. f-n, Box plot analysis of NELFA (f), HEXIM1 (g), Suv39H1 (h), KDM4B (i), KDM4C (j), H3K9me3 (k), H3K27me3 (l), G9a (m) and HP1α (n) ChIP-seq data representing the effect of E2 on the corresponding factor binding at PR and non-PR promoters. The box plots denote the medians, the interquartile ranges and the whiskers. Data were generated in two independent experiments. The P values were calculated with two-sided Wilcoxon test.
Extended Data Fig. 3 |. Specificity of CRISPR-Cas13a-based PAS RNA degradation.
a-c, Genome browser views of Pol II ChIP-seq and GRO-seq on TFF1 (a), MYC (b) and ABAT (c) genomic loci, in the absence or presence of E2 treatment. The red arrowhead indicates upregulation of PAS RNA. d-f, Real-time RT-PCR analysis of Bio-RIP data showing specificity of the CRISPR-Cas13a strategy mediated ABATpasRNA (d), MYCpasRNA (e) and TFF1pasRNA (f) knockdown. Data shown as individual values, mean ± s.d. (n = 3). The P values were calculated with two-sided Student’s t-test. g, Real-time PCR analysis of Bio-ChIP data showing that PAS RNA tethering by the CRISPR-dCas9 strategy did not affect functional assembly of CRISPR-dCas9 complex at the ABAT promoter. Data shown as individual values, mean ± s.d. (n = 3). The P values were calculated with two-sided Student’s t-test.
Extended Data Fig. 4 |. Context-dependent gene activation by PAS RNA tethering.
a, c, e, g, Genome browser views of ATAC-seq, PRO-seq, Pol II ChIP-seq and H3K4me3 ChIP-seq on selected FNIP1 (a), IRF1 (c), OR2J1 (e) and DEFB129 (g) genomic regions in the absence or presence of E2 treatment. b, d, f, h, Real-time RT-PCR data showing the effect of tethering a serial of pasRNAs or control RNAs to the FNIP1 (b), IRF1 (d), OR2J1 (f) and DEFB129 (h) promoters on the respective coding gene expression in the -E2 condition by the CRISPR-dCas9 strategy. Data shown as individual values, mean ± s.d. (n = 3). The Shapiro-Wilk test was computed first to verify the normal distribution of the real-time RT-PCR data before P values were calculated with two-sided Welch’s t-test. i-k, Real-time RT-PCR data showing the effect of using the CRISPR-dCas9/VP64 (CRISPRa) strategy targeting the TMEM114 (i), OR2J1 (j) and DEFB129 (k) promoters on the respective coding gene expression in the -E2 condition. Data shown as individual values, mean ± s.d. (n = 3). The P values were calculated with two-sided Student’s t-test. l, Bar plot data showing the RPKM expression values of the genes to which dCas9-PAS RNAs were delivered. RPKM values were computed based on GRO-seq datasets in GSE41324 (combined replicates).
Extended Data Fig. 5 |. Higher-order structure of PAS RNA.
a, Box plot analysis of Gibbs free energy (dG) showing that PAS RNAs, in their native state, have a significantly lower minimum free energy (MFE) than synthetically random RNAs of the same length and their cognate mRNAs, suggesting that PAS RNAs may tend to form more secondary structures to maintain their stability. The synthetically random RNAs were generated with the packages kebabs and Rbioinf in R/Bioconductor version 3.12. PAS RNAs were compared with two independent synthetic random RNAs (500 nt, 1,000 nt) and their cognate mRNAs to calculate the difference of dG. The box plots denote the medians, the interquartile ranges and the whiskers. The P values were calculated with two-sided Wilcoxon test. b, Box plot analysis of z-scores showing that PAS RNAs have a higher percentage of negatively shifted z-score windows less than −1 than synthetically random RNAs of the same length and their cognate mRNAs, suggesting more local regions of potential structure in PAS RNAs. In the calculation of z-scores, we used the methodology described in ScanFold (https://github.com/moss-lab/ScanFold) that uses scanning windows of 120-nt length, and a step size of 40 nt, and generates 30 shuffled versions of the corresponding RNA sequence, using the same dinucleotide frequency. The box plots denote the medians, the interquartile ranges and the whiskers. PAS RNAs were compared with two independent sets of synthetic random RNAs (500 nt, 1,000 nt) and their cognate mRNAs to calculate the difference of z-scores. The P values were calculated with two-sided Wilcoxon test. c-e, Predicted MFE-based secondary structure of ABATpasRNA (c), MYCpasRNA (d) and TFF1pasRNA (e) by RNAfold webserver. Owing to the long length, only a partial sequence of MYCpasRNA and TFF1pasRNA was used for computational analysis. f-i, Predicted MFE-based secondary structure by RNAfold webserver and genome browser views of FAM110ApasRNA (f), FAM102ApasRNA (g) HIGD1ApasRNA (h) and KCNK6pasRNA (i). The red arrowhead indicates the upregulation of PAS RNA.
Extended Data Fig. 6 |. E2-dependent PR promoter activation.
a-e, Box plot analysis of ChIP-seq data for H3K4me3 (a), H3K9K14ac (b), H3K27ac (c), H3K56ac (d) and H3K122ac (e) at the PR and RSG promoters, in the absence or presence of E2 treatment. The box plots denote the medians, the interquartile ranges and the whiskers. Data were generated in two independent experiments. The P values were calculated with two-sided Wilcoxon test. f, Genome browser views of H3K4me3, H3K9K14ac, H3K27ac, H3K56ac and H3K122ac ChIP-seq on a selected TFF1 genomic region in the absence or presence of E2 treatment.
Extended Data Fig. 7 |. PAS RNAs license cognate coding gene transcription activation.
a-c, H3K27me3 ChIP-qPCR data showing the effect of TFF1pasRNA (a), MYCpasRNA (b) and ABATpasRNA (c) knockdown on the accumulation of H3K27me3 on the respective cognate gene promoter following E2 treatment. Data shown as individual values, mean ± s.d. (n = 3). The P values were calculated with two-sided Student’s t-test. d, H3K9me3 ChIP-qPCR data showing the effect of tethering ABATpasRNA using the CRISPR-dCas9 strategy to the TRIB2, FNIP1 and IRF1 promoters on H3K9me3 accumulation on the respective cognate coding gene promoter in the -E2 condition. Data shown as individual values, mean ± s.d. (n = 3). The P values were calculated with one-sided Student’s t-test. e, g, ChIP-seq tag distribution analysis representing the effect of E2 on Suv39H1 binding (e) and H3K27me3 (g) accumulation at PR promoters. f, h, Box plot analysis representing the effect of E2 on Suv39H1 (f) and H3K27me3 (h) occupancy at PR gene promoters and RSG promoters. The box plots denote the medians, the interquartile ranges and the whiskers. Data were generated in two independent experiments. The P values were calculated with two-sided Wilcoxon test. i, Immunoblot analysis showing no effect of TFF1pasRNA, MYCpasRNA and ABATpasRNA knockdown on KDM4B and KDM4C expression following E2 treatment. The experiment was repeated three times with similar results. See Supplementary Fig. 1 for gel source data. j, Cell lysates as described in Fig. 2m were subjected to co-immunoprecipitation with anti-Flag antibody (for flag-dCas9) followed by immunoblot analysis with antibodies as indicated. The experiment was repeated three times with similar results. See Supplementary Fig. 1 for gel source data. k, ChIP-seq tag distribution analysis displaying the effect of E2 treatment on G9a (EHMT2) binding at the PR promoters. l, Box plot analysis representing the effect of E2 on G9a binding at the PR and RSG promoters. The box plots denote the medians, the interquartile ranges and the whiskers. Data were generated in two independent experiments. The P values were calculated with two-sided Wilcoxon test. m-o, Real-time RT-PCR data showing the effect of combined knockdown of Suv39H1 and G9a in TFF1pasRNA (m), MYCpasRNA (n) and ABATpasRNA (o) knockdown MCF-7 cells by the CRISPR-Cas13a strategy on the respective cognate coding gene transcription following E2 treatment. Data shown as individual values, mean ± s.d. (n = 3). The P values were calculated with one-sided Student’s t-test. p, The profile analysis of H3K9me3 ChIP-seq, Pol II ChIP-seq and H3K9me3 ChIP-seq performed in shKDM4B/4C MCF-7 cells in the -E2 condition showing major H3K9me3 accumulation on +1 nucleosome after knockdown of KDM4B/4C.
Extended Data Fig. 8 |. The effect of KDM4B/KDM4C on E2-induced Pol II promoter pause release.
a, ChIP-seq tag distribution analysis representing the effect of KDM4B/4C knockdown on H3K9me3 accumulation at the PR promoters. b, Heat map of H3K9me3 ChIP-seq data representing the effect of KDM4B/4C knockdown on H3K9me3 binding at the PR promoters. c, Genome browser views of KDM4B and KDM4C ChIP-seq in the presence or absence of E2, and H3K9me3 ChIP-seq after knockdown of KDM4B and KDM4C on the TFF1 genomic region. d, ChIP-seq tag distribution analysis representing the effect of E2 on H3K36me3 accumulation at the PR promoters. e, Genome browser views of H3K36me3 ChIP-seq in the presence or absence of E2 on the TFF1 genomic region. f, Box plot analysis of the pausing ratio based on Pol II ChIP-seq data representing the effect of KDM4B/4C knockdown on the pausing ratio for PR genes and RSG following E2 treatment. The box plots denote the medians, the interquartile ranges and the whiskers. Data were generated in two independent experiments. The P values were calculated with two-sided Wilcoxon test. g, ChIP-seq tag distribution analysis representing the effect of KDM4B/4C knockdown on Pol II accumulation at PR promoters following E2 treatment. h, Schematic structure of KDM4B and KDM4C proteins. Between the JMJC domain and the double PHD/Tudor domain is the predicted IDR region, analysed by the IUPred2A online tool. i, Immunoblot analysis of full-length KDM4C and the relevant KDM4C-mutant expression in shKDM4C MCF-7 cells following E2 treatment. The experiment was repeated three times with similar results. See Supplementary Fig. 1 for gel source data. j-l, Real-time RT-PCR data showing the effect of KDM4B/4C knockdown on the expression of TFF1pasRNA (j), MYCpasRNA (k) and ABATpasRNA (l) following E2 treatment. Data shown as individual values, mean ± s.d. (n = 3). The P values were calculated with two-sided Student’s t-test.
Extended Data Fig. 9 |. Functional importance of HP1 in Pol II pause release.
a-c, Real-time RT-PCR data showing the effect of knockdown of HP1α, HP1β and HP1γ on TFF1 (a), MYC (b) and ABAT (c) coding gene transcription. Data shown as individual values, mean ± s.d. (n = 3). The P values were calculated with two-sided Student’s t-test. d, ChIP-seq tag distribution analysis representing the effect of E2 on HP1α binding at the PR promoters. e, Box plot analysis of HP1α ChIP-seq data (n = 1 experiment) representing the effect of E2 on HP1α binding at the PR and RSG promoters. The box plots denote the medians, the interquartile ranges and the whiskers. The P values were calculated with two-sided Wilcoxon test. f, Genome browser views of HP1α ChIP-seq (in the presence or absence of E2), HP1α (4E) mutant Bio-ChIP and HP1α (4A) mutant Bio-ChIP on the TFF1 genomic region. g, Domain map of human HP1α. Phosphorylatable serine residues, and the corresponding phosphor-mimetic glutamic acid residues and phosphor-compromised alanine residues at the N-terminal extension (NTE) of human HP1α regulating its chromodomain (CD)-H3K9me3 tail interaction are in bold. CSD, chromoshadow domain; CTE, C-terminal extension; H, hinge region. h, Bio-ChIP-seq tag distribution (n = 1 experiment) representing the effect of phosphorylation at the NTE on HP1α binding at the PR promoters. i, Box plot analysis of HP1α Bio-ChIP-seq data (n = 1 experiment) showing the effect of phosphorylation at the NTE on HP1α occupancy at the PR gene promoters and RSG promoters. The box plots denote the medians, the interquartile ranges and the whiskers. The P values were calculated with two-sided Wilcoxon test. j, Heat map of HP1α Bio-ChIP-seq data showing the effect of phosphorylation at the NTE on HP1α occupancy at the PR gene promoters and RSG promoters. k, The profiles of PRO-seq normalized tag counts, starting 3 kb upstream of the transcription start site (TSS) to 3 kb downstream of the TSS in shCTL MCF-7 cells or shHP1α/β MCF-7 cells. l, Box plot analysis of PRO-seq data representing the effect of HP1α/β knockdown on transcription of the PR genes and RSGs. The box plots denote the medians, the interquartile ranges and the whiskers. Data were generated in two independent experiments. The P values were calculated with two-sided Wilcoxon test. m, Genome browser views of PRO-seq in the presence or absence of HP1α/β knockdown on the TFF1 genomic region.
Extended Data Fig. 10 |. HP1-mediated stabilization of 7SK and NELFA at the promoter.
a-c, HP1α ChIP-qPCR data showing the effect of TFF1pasRNA (a), MYCpasRNA (b) and ABATpasRNA (c) knockdown on accumulation of HP1α on the respective cognate coding gene promoter following E2 treatment. Data shown as individual values, mean ± s.d. (n = 3). The P values were calculated with two-sided Student’s t-test. d-f, Real-time RT-PCR data showing the effect of knockdown of HP1α and HP1β in TFF1pasRNA (d), MYCpasRNA (e) and ABATpasRNA (f) knockdown MCF-7 cells by the CRISPR-Cas13a strategy on the respective cognate coding gene transcription. Data shown as individual values, mean ± s.d. (n = 3). The P values were calculated with two-sided Student’s t-test. g, j, 7SK ChIRC13a-seq (g) and NELFA ChIP-seq (j) tag distribution analysis representing the effect of HP1α and HP1β knockdown on 7SK (g) and NELFA (j) binding at the PR promoters. h, k, Box plot analysis of 7SK ChIRC13a-seq (n = 1 experiment) (h) and NELFA ChIP-seq (k) (n = 1 experiment) data representing the effect of HP1α and HP1β knockdown on 7SK (h) and NELFA (k) binding at the PR and RSG promoters. The box plots denote the medians, the interquartile ranges and the whiskers. The P values were calculated with two-sided Wilcoxon test. i, l, Heat map of 7SK ChIRC13a-seq (i) and NELFA ChIP-seq (l) data representing the effect of HP1α and HP1β knockdown on 7SK (i) and NELFA (l) binding at the PR promoters.
Extended Data Fig. 11 |. Dual role of KAP1 in transcriptional regulation.
a, Heat map showing mass spectrometry analysis of HP1-associated proteins. Identified KAP1 is shown on the right. b, Co-IP result showing interaction between HP1 and KAP1. The experiment was repeated three times with similar results. See Supplementary Fig. 1 for gel source data. c, ChIRC13a-seq tag distribution representing the effect of KAP1 knockdown on 7SK binding at the PR promoters. d, Box plot analysis of 7SK ChIRC13a-seq data representing the effect of KAP1 knockdown (n = 1 experiment) on 7SK binding at the PR and RSG promoters. The box plots denote the medians, the interquartile ranges and the whiskers. The P values were calculated with two-sided Wilcoxon test. e, Heat map of 7SK ChIRC13a-seq data representing the effect of KAP1 knockdown on 7SK binding at the PR promoters. f, ChIP-seq tag distribution analysis representing the effect of E2 on KAP1 binding at the PR promoters. g, Box plot analysis of KAP1 ChIP-seq data representing the effect of E2 on KAP1 binding at the PR and RSG promoters. The box plots denote the medians, the interquartile ranges and the whiskers. Data were generated in two independent experiments. The P values were calculated with two-sided Wilcoxon test. h, j, Box plot analysis of PRO-seq data (h) (n = 1 experiment) and Pol II S2P data (j) (n = 1 experiment) representing the effect of KAP1 knockdown on the transcription of the PR genes and RSGs following E2 treatment. The box plots denote the medians, the interquartile ranges and the whiskers. The P values were calculated with two-sided Wilcoxon test. i, The profiles of PRO-seq tag counts on PR genes from 3 kb upstream of the TSS to 3 kb downstream of TSS in shCTL MCF-7 cells and shKAP1 MCF-7 cells following E2 treatment.
Extended Data Fig. 12 |. Phospho-KAP1(S824) as a determinant for KAP1-mediated transcription activation.
a, ChIP-qPCR data showing the effect of E2 on accumulation of phospho-KAP1(S824) on the selective coding gene promoter. Data shown as individual values, mean ± s.d. (n = 3). The P values were calculated with two-sided Student’s t-test. b, Sequence alignment of KAP1 (wild type (WT), 835 amino acids (AA)), truncated KAP1 (WT, 754 AA) and truncated KAP1(S824A) mutant used in the KAP1 rescue experiment shown in c-e. c-e, Real-time RT-PCR data showing the effect of overexpression of full-length KAP1 or the relevant KAP1(S824A) mutants on TFF1 (c), MYC (d) and ABAT (e) coding gene transcription in KAP1 knockdown MCF-7 cells following E2 treatment. Data shown as individual values, mean ± s.d. (n = 3). The P values were calculated with two-sided Student’s t-test. f, ChIP-seq tag distribution analysis representing the effect of E2 on KAP1 binding at the 1,224 E2-responsive MegaTrans enhancers. g, Box plot analysis of PRO-seq data representing the effect of KAP1 knockdown (n = 1 experiment) on the transcription of the 1,224 E2-responsive MegaTrans enhancers and 5,694 ERα bound but less active enhancers (weak ERα enhancers) following E2 treatment. The box plots denote the medians, the interquartile ranges and the whiskers. The P values were calculated with two-sided Wilcoxon test. h, Model: the 7SK/KAP1 snRNP-associated inactive P-TEFb complex was assembled at paused PR promoters by association with H3K9me3 reader protein HP1α via H3K9me3 recognition, which is deposited by Suv39H1 H3K9me3 methyltransferase, thus keeping promoter-proximal RNA Pol II at a poised state. Upon E2 stimulation, ligand-induced transcription factor ERα/co-factors are rapidly recruited at these promoters to help poised RNA polymerase initiate transcription to accumulate PAS RNA transcripts at promoters. These transiently expressed RNA molecules, which share a similar compact stem-loop structure that is responsible for the recruitment/stabilization of KDM4B/4C H3K9me3 demethylases at promoters to erase H3K9me3, lead to decommissioning of the HP1α-KAP1-7SK snRNP complex at paused promoters to activate P-TEFb and unleash RNA Pol II transcription; unexpectedly, in response to E2, KAP1, which is a transcription repressor to stabilize the 7SK snRNP complex at paused PR promoters in basal state, is recruited to MegaTrans enhancers, phosphorylated at S824 by MegaTrans enhancer-recruited DNA-PKcs, and subsequently delivered to promoters through E2-induced enhancer-promoter looping, thus ensuring subsequent Pol II pause release for robust transcriptional activation.
Supplementary Material
Acknowledgements
We are grateful to K. Jepsen (Director of IGM, UCSD) for Illumina sequencing, J. Hightower for assistance with figure preparation, M. Ghassemian from the UCSD Biomolecular/Proteomics Mass Spectrometry Facility for mass spectrometry analysis, P. Irving (UNC), and R. Andrews and W. Moss for their suggestions on SHAPE-MaP analysis and on the ScanFold pipeline, respectively. F.Y. was a recipient of the Prostate Cancer Research Program (PCRP) Postdoctoral Training Award of the Department of Defense (W81XWH-16-1-0548). M.G.R. is an investigator with the Howard Hughes Medical Institute. This work was supported by grants from the NIDDK and NHLBI (HL150521, DK018477 and DK039949) to M.G.R. and by NIH grant R35-GM131780 to A.K.A.
Footnotes
Competing interests The authors declare no competing interests.
Supplementary information The online version contains supplementary material available at https://doi.org/10.1038/s41586-021-03589-x.
Peer review informationNature thanks Stephen Mack and the other, anonymous, reviewer(s) for their contribution to the peer review of this work.
References
- 1.Engreitz JM et al. Local regulation of gene expression by lncRNA promoters, transcription and splicing. Nature 539, 452–455 (2016). [DOI] [PMC free article] [PubMed] [Google Scholar]
- 2.Sigova AA et al. Divergent transcription of long noncoding RNA/mRNA gene pairs in embryonic stem cells. Proc. Natl Acad. Sci. USA 110, 2876–2881 (2013). [DOI] [PMC free article] [PubMed] [Google Scholar]
- 3.Flynn RA, Almada AE, Zamudio JR & Sharp PA Antisense RNA polymerase II divergent transcripts are P-TEFb dependent and substrates for the RNA exosome. Proc. Natl Acad. Sci. USA 108, 10460–10465 (2011). [DOI] [PMC free article] [PubMed] [Google Scholar]
- 4.Gupta RA et al. Long non-coding RNA HOTAIR reprograms chromatin state to promote cancer metastasis. Nature 464, 1071–1076 (2010). [DOI] [PMC free article] [PubMed] [Google Scholar]
- 5.Chu HP et al. TERRA RNA antagonizes ATRX and protects telomeres. Cell 170, 86–101 (2017). [DOI] [PMC free article] [PubMed] [Google Scholar]
- 6.McHugh CA et al. The Xist lncRNA interacts directly with SHARP to silence transcription through HDAC3. Nature 521, 232–236 (2015). [DOI] [PMC free article] [PubMed] [Google Scholar]
- 7.Sarma K et al. ATRX directs binding of PRC2 to Xist RNA and Polycomb targets. Cell 159, 869–883 (2014). [DOI] [PMC free article] [PubMed] [Google Scholar]
- 8.Silva AM et al. Long noncoding RNAs: a missing link in osteoporosis. Bone Res. 7, 10 (2019). [DOI] [PMC free article] [PubMed] [Google Scholar]
- 9.Ulitsky I & Bartel DP lincRNAs: genomics, evolution, and mechanisms. Cell 154, 26–46 (2013). [DOI] [PMC free article] [PubMed] [Google Scholar]
- 10.Gebert LFR & MacRae IJ Regulation of microRNA function in animals. Nat. Rev. Mol. Cell Biol. 20, 21–37 (2019). [DOI] [PMC free article] [PubMed] [Google Scholar]
- 11.Aravin A et al. A novel class of small RNAs bind to MILI protein in mouse testes. Nature 442, 203–207 (2006). [DOI] [PubMed] [Google Scholar]
- 12.Girard A, Sachidanandam R, Hannon GJ & Carmell MA A germline-specific class of small RNAs binds mammalian Piwi proteins. Nature 442, 199–202 (2006). [DOI] [PubMed] [Google Scholar]
- 13.Vagin VV et al. A distinct small RNA pathway silences selfish genetic elements in the germline. Science 313, 320–324 (2006). [DOI] [PubMed] [Google Scholar]
- 14.Treiber T, Treiber N & Meister G Regulation of microRNA biogenesis and its crosstalk with other cellular pathways. Nat. Rev. Mol. Cell Biol. 20, 5–20 (2019). [DOI] [PubMed] [Google Scholar]
- 15.Sesto N, Wurtzel O, Archambaud C, Sorek R & Cossart P The excludon: a new concept in bacterial antisense RNA-mediated gene regulation. Nat. Rev. Microbiol. 11, 75–82 (2013). [DOI] [PubMed] [Google Scholar]
- 16.Arab K et al. Long noncoding RNA TARID directs demethylation and activation of the tumor suppressor TCF21 via GADD45A. Mol. Cell 55, 604–614 (2014). [DOI] [PubMed] [Google Scholar]
- 17.Bester AC et al. An integrated genome-wide CRISPRa approach to functionalize lncRNAs in drug resistance. Cell 173, 649–664 (2018). [DOI] [PMC free article] [PubMed] [Google Scholar]
- 18.Canzio D et al. Antisense lncRNA transcription mediates DNA demethylation to drive stochastic protocadherin α promoter choice. Cell 177, 639–653 (2019). [DOI] [PMC free article] [PubMed] [Google Scholar]
- 19.Ross-Innes CS et al. Differential oestrogen receptor binding is associated with clinical outcome in breast cancer. Nature 481, 389–393 (2012). [DOI] [PMC free article] [PubMed] [Google Scholar]
- 20.He HH et al. Differential DNase I hypersensitivity reveals factor-dependent chromatin dynamics. Genome Res. 22, 1015–1025 (2012). [DOI] [PMC free article] [PubMed] [Google Scholar]
- 21.Wardell SE, Kazmin D & McDonnell DP Research resource: transcriptional profiling in a cellular model of breast cancer reveals functional and mechanistic differences between clinically relevant SERM and between SERM/estrogen complexes. Mol. Endocrinol. 26, 1235–1248 (2012). [DOI] [PMC free article] [PubMed] [Google Scholar]
- 22.Liu Z et al. Enhancer activation requires trans-recruitment of a mega transcription factor complex. Cell 159, 358–373 (2014). [DOI] [PMC free article] [PubMed] [Google Scholar]
- 23.Nair SJ et al. Phase separation of ligand-activated enhancers licenses cooperative chromosomal enhancer assembly. Nat. Struct. Mol. Biol. 26, 193–203 (2019). [DOI] [PMC free article] [PubMed] [Google Scholar]
- 24.Li W et al. Functional roles of enhancer RNAs for oestrogen-dependent transcriptional activation. Nature 498, 516–520 (2013). [DOI] [PMC free article] [PubMed] [Google Scholar]
- 25.Hah N et al. A rapid, extensive, and transient transcriptional response to estrogen signaling in breast cancer cells. Cell 145, 622–634 (2011). [DOI] [PMC free article] [PubMed] [Google Scholar]
- 26.Danko CG et al. Signaling pathways differentially affect RNA polymerase II initiation, pausing, and elongation rate in cells. Mol. Cell 50, 212–222 (2013). [DOI] [PMC free article] [PubMed] [Google Scholar]
- 27.Lis JTAA 50 year history of technologies that drove discovery in eukaryotic transcription regulation. Nat. Struct. Mol. Biol. 26, 777–782 (2019). [DOI] [PMC free article] [PubMed] [Google Scholar]
- 28.Peterlin BM & Price DH Controlling the elongation phase of transcription with P-TEFb. Mol. Cell 23, 297–305 (2006). [DOI] [PubMed] [Google Scholar]
- 29.Chu C, Qu K, Zhong FL, Artandi SE & Chang HY Genomic maps of long noncoding RNA occupancy reveal principles of RNA-chromatin interactions. Mol. Cell 44, 667–678 (2011). [DOI] [PMC free article] [PubMed] [Google Scholar]
- 30.Engreitz JM et al. The Xist lncRNA exploits three-dimensional genome architecture to spread across the X chromosome. Science 341, 1237973 (2013). [DOI] [PMC free article] [PubMed] [Google Scholar]
- 31.Simon MD et al. The genomic binding sites of a noncoding RNA. Proc. Natl Acad. Sci. USA 108, 20497–20502 (2011). [DOI] [PMC free article] [PubMed] [Google Scholar]
- 32.Abudayyeh OO et al. RNA targeting with CRISPR-Cas13. Nature 550, 280–284 (2017). [DOI] [PMC free article] [PubMed] [Google Scholar]
- 33.Cox DBT et al. RNA editing with CRISPR-Cas13. Science 358, 1019–1027 (2017). [DOI] [PMC free article] [PubMed] [Google Scholar]
- 34.West JA et al. The long noncoding RNAs NEAT1 and MALAT1 bind active chromatin sites. Mol. Cell 55, 791–802 (2014). [DOI] [PMC free article] [PubMed] [Google Scholar]
- 35.Larson AG et al. Liquid droplet formation by HP1α suggests a role for phase separation in heterochromatin. Nature 547, 236–240 (2017). [DOI] [PMC free article] [PubMed] [Google Scholar]
- 36.McNamara RP et al. KAP1 recruitment of the 7SK snRNP complex to promoters enables transcription elongation by RNA polymerase II. Mol. Cell 61, 39–53 (2016). [DOI] [PMC free article] [PubMed] [Google Scholar]
- 37.Bunch H et al. TRIM28 regulates RNA polymerase II promoter-proximal pausing and pause release. Nat. Struct. Mol. Biol. 21, 876–883 (2014). [DOI] [PMC free article] [PubMed] [Google Scholar]
- 38.Liu X et al. In situ capture of chromatin interactions by biotinylated dCas9. Cell 170, 1028–1043 (2017). [DOI] [PMC free article] [PubMed] [Google Scholar]
- 39.Mahat DB et al. Base-pair-resolution genome-wide mapping of active RNA polymerases using precision nuclear run-on (PRO-seq). Nat. Protoc. 11, 1455–1476 (2016). [DOI] [PMC free article] [PubMed] [Google Scholar]
- 40.Yang F, Zhang H, Mei Y & Wu M Reciprocal regulation of HIF-1α and lincRNA-p21 modulates the Warburg effect. Mol. Cell 53, 88–100 (2014). [DOI] [PubMed] [Google Scholar]
- 41.Shechner DM, Hacisuleyman E, Younger ST & Rinn JL Multiplexable, locus-specific targeting of long RNAs with CRISPR-Display. Nat. Methods 12, 664–670 (2015). [DOI] [PMC free article] [PubMed] [Google Scholar]
- 42.Konermann S et al. Genome-scale transcriptional activation by an engineered CRISPR-Cas9 complex. Nature 517, 583–588 (2015). [DOI] [PMC free article] [PubMed] [Google Scholar]
- 43.Smola MJ, Rice GM, Busan S, Siegfried NA & Weeks KM Selective 2′-hydroxyl acylation analyzed by primer extension and mutational profiling (SHAPE-MaP) for direct, versatile and accurate RNA structure analysis. Nat. Protoc. 10, 1643–1669 (2015). [DOI] [PMC free article] [PubMed] [Google Scholar]
- 44.Langmead B & Salzberg SL Fast gapped-read alignment with Bowtie 2. Nat. Methods 9, 357–359 (2012). [DOI] [PMC free article] [PubMed] [Google Scholar]
- 45.Heinz S et al. Simple combinations of lineage-determining transcription factors prime cis-regulatory elements required for macrophage and B cell identities. Mol. Cell 38, 576–589 (2010). [DOI] [PMC free article] [PubMed] [Google Scholar]
- 46.Robinson MD, McCarthy DJ & Smyth GK edgeR: a Bioconductor package for differential expression analysis of digital gene expression data. Bioinformatics 26, 139–140 (2010). [DOI] [PMC free article] [PubMed] [Google Scholar]
- 47.Busan S & Weeks KM Accurate detection of chemical modifications in RNA by mutational profiling (MaP) with ShapeMapper 2. RNA 24, 143–148 (2018). [DOI] [PMC free article] [PubMed] [Google Scholar]
- 48.Andrews RJ, Baber L & Moss WN Mapping the RNA structural landscape of viral genomes. Methods 183, 57–67 (2020). [DOI] [PMC free article] [PubMed] [Google Scholar]
Associated Data
This section collects any data citations, data availability statements, or supplementary materials included in this article.
Supplementary Materials
Data Availability Statement
The reagents, antibodies, primers and oligo DNA used in this study are listed in Supplementary Table 1. RNA sequences used in the RNA tethering experiments are available in Supplementary Table 2. The sequencing datasets generated from this study are deposited in the Gene Expression Omnibus (GEO) database using accession ID GSE139199. The GRO-seq datasets used in this study were downloaded from GSE41324. The ATAC-seq datasets used in this study were downloaded from GSE99544. The H3K27ac ChIP-seq datasets used in this study were downloaded from GSE62229. Source data are provided with this paper.


