Correction notice:
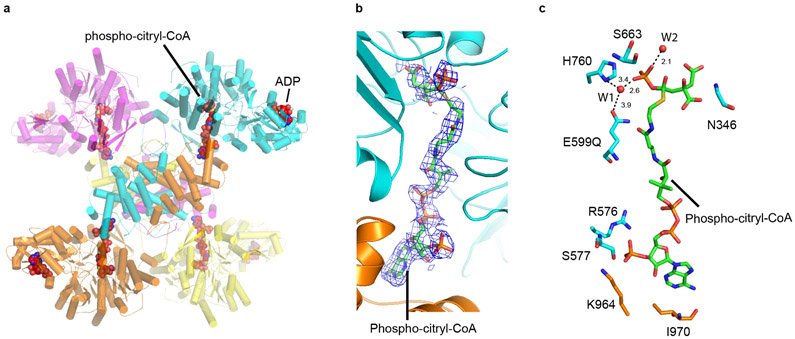
In the version of the article initially published, the phospho-citryl-CoA intermediate in the ACLY-E599Q–ATP-citrate-CoA structure (PDB 6UUW) was modelled incorrectly. Specifically, the citryl-CoA linkage was modelled with a thioether bond instead of a thioester bond and the phosphate group was connected to the OH of the citryl moiety in the phospho-citryl portion instead of via an ester bond with the carboxylate group as supported by Walsh and Spector (J. Biol Chem. 243, 446–448, 1968). Thus, the intermediate shown in Figure 6 and Extended Date Figure 7c, d was incorrect. The PDB coordinate file has been revised and Figure 6 and Extended Data Figure 7c,d have been replaced in the HTML and PDF versions of the article. Original and corrected Figures are shown below. The text has not been changed but given the inherent instability of the modelled phospho-citryl-CoA intermediate and the limited resolution of the current structure, the modelled intermediate could represent phospho-citrate + CoA, citryl-CoA + PO4 or a mixture of the two. Given this possibility, the precise catalytic role if E599 is unknown and E599 may not be directly involved in cleavage of the citryl-CoA adduct as implied in the article.
Additional corrections that should be made are as follows:
In table 1, the ligand number of "E599Q" should be 8 instead of 4
In table 1, the rmsd bond length of With citrateCoA (C1 asymm. open) (EMDB-20784,PDB-6uiA) should be 0.008 instead of 0.0008.
On page 38, "We therefore mixed the ACLY-E599A mutant" should be "….ACLY-E599Q…."
On page 39, " Interestingly, citrate was added to both ACLY-citrate-CoA and ACLY-E599A…" should be "….ACLY-E599Q"
On page 40, " This conclusion is further supported by our….. ACLY-E599A catalytic mutant” should be “….ACLY-E599Q”
Methods - “For 3D reconstruction of the ACLY-E599–citrate-ATP-CoA structure, 746,030 particles were picked from 5,600 micrograph” should be “… ACLY-E599Q–citrate-ATP-CoA structure….”
-
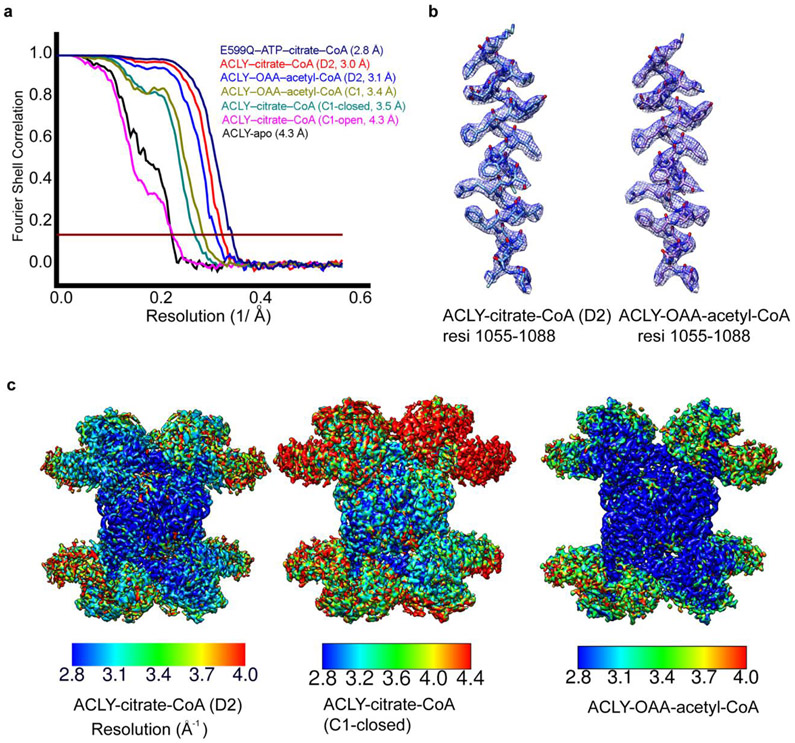
ACLY-citrate-CoA (D2) resi 1055-1088 should be “residue 1055-1077”
ACLY-OAA-acetly-CoA resi 1055-1088 should be “ACLY-OAA-acetly-CoA (D2) residue 1055-1077”
Table 1 ∣.
Cryo-EM data collection, refinement, and validation statistics
| Apo | With citrate– CoA (D2) |
With citrate– CoA (C1 asymm closed) |
With citrate– CoA (C1 asymm open) |
With OAA– acetyl-Co A (D2) |
With
OAA– acetyl-CoA (C1) |
E599Q
With ATP–citrate– CoA (D2) |
|
|---|---|---|---|---|---|---|---|
| (EMDB -20414, PDB-6P OF) |
(EMDB -20903, PDB-6 UUZ) |
(EMDB- 20413, PDB-6P OE) |
(EMDB- 20784, PDB-6U IA) |
(EMDB- 20783, PDB-6UI 9) |
(EMDB-209 04, PDB- 6UV5) |
(EMDB-209 02, PDB- 6UUW) |
|
| Data collection and processing | |||||||
| Magnification | 28,000 | 45,000 | 45,000 | 45,000 | 45,000 | 45,000 | 45,000 |
| Voltage (kV) | 200 | 200 | 200 | 200 | 200 | 200 | 200 |
| Electron exposure (e–/Å2) | 40 | 37 | 37 | 37 | 37 | 37 | 40 |
| Defocus range (μm) | 1.5-3.5 | 0.9-2.8 | 0.9-2.8 | 0.9-2.8 | 0.9-2.8 | 0.9-2.8 | 1.0-2.0 |
| Pixel size (Å) | 1.485 | 0.87 | 0.87 | 0.87 | 0.87 | 0.87 | 0.87 |
| Symmetry imposed | D2 | D2 | C1 | C1 | D2 | C1 | D2 |
| Initial particle images (no.) | 398,391 | 716,394 | 716,394 | 716,394 | 719,613 | 719,613 | 770,837 |
| Final particle images (no.) | 20,677 | 129,563 | 129,563 | 73,969 | 108,738 | 108,738 | 207,653 |
| Map resolution (Å) | 4.3 | 3.0 | 3.5 | 4.3 | 3.1 | 3.4 | 2.9 |
| FSC threshold | 0.143 | 0.143 | 0.143 | 0.143 | 0.143 | 0.143 | 0.143 |
| Map resolution Range (Å) | 4.1-5.3 | 2.8-4.0 | 2.8-4.4 | 4.0-5.3 | 2.8-4.0 | 2.8-4.4 | 2.7-3.6 |
| Refinement | |||||||
| Initial model used (PDB code) | 3MWD | 3MWD | 3MWD | 3MWD | 3MWD | 3MWD | 5TDF |
| Model resolution (Å) | 4.4 | 3.1 | 3.6 | 4.4 | 3.2 | 3.5 | 2.9 |
| Model resolution Range (Å) | - | - | - | - | - | - | - |
| Map sharpening B factor (Å2) | −138 | −95 | −100 | −122 | −98 | −101 | −80 |
| Model composition | |||||||
| Nonhydrogen atoms | 31,624 | 31,816 | 31,810 | 31,720 | 31,900 | 31,951 | 32,532 |
| Protein residues | 4,084 | 4,084 | 4,084 | 4,084 | 4,084 | 4,084 | 4,136 |
| Ligands | 0 | 4 | 4 | 2 | 12 | 12 | 8 |
| R.m.s. deviations | |||||||
| Bond lengths (Å) | 0.009 | 0.01 | 0.008 | 0.012 | 0.009 | 0.014 | 0.01 |
| Bond angles (°) | 1.234 | 1.114 | 0.946 | 1.673 | 1.102 | 1.202 | 1.155 |
| Validation | |||||||
| MolProbity score | 1.95 | 1.90 | 2.51 | 2.20 | 1.77 | 1.77 | 1.56 |
| Clashscore | 9.80 | 8.06 | 6.34 | 14.17 | 6.03 | 6.26 | 3.11 |
| Poor rotamers (%) | 0.27 | 0.24 | 0.12 | 0.86 | 0.27 | 0.15 | 0.55 |
| Ramachandran plot (%) | |||||||
| Favored (%) | 93.16 | 93.25 | 93.20 | 90.44 | 93.23 | 93.05 | 94.27 |
| Allowed (%) | 6.64 | 6.65 | 6.48 | 9.02 | 6.27 | 6.75 | 5.29 |
| Disallowed (%) | 0.2 | 0.1 | 0.32 | 0.54 | 0.1 | 0.2 | 0.4 |
Extended Data
Extended Data Fig. 4.
Analysis of single particle cryo-EM reconstructions. (a) Fourier Shell Correlation (FSC) curves for 3D reconstructions of reported structures, marked with resolutions corresponding to FSC = 0.143. (b) Cryo-EM density of representative helical segments (residues 1055-1077) from ACLY–citrate–CoA (left) and ACLY–OAA–acetyl-CoA structures. (c) Local resolution estimation of cryo-EM maps of ACLY–citrate–CoA-D2 (left), ACLY–citrate-CoA-C1 asymm closed (middle) and ACLY–OAA–acetyl-CoA (right) by Resmap.
Supplementary Material
Associated Data
This section collects any data citations, data availability statements, or supplementary materials included in this article.


