Abstract
The creation of visualizations to interpret genomics data remains an important aspect of data science within computational biology. The GenVisR bioconductor package was created to lower the entry point for publication quality graphics and has remained a popular suite of tools within this domain. GenVisR supports visualizations covering a breadth of topics including functions to produce visual summaries of copy number alterations, somatic variants, sequence quality metrics, and more. Recently the GenVisR package has undergone significant updates to increase performance and functionality. To demonstrate the utility of GenVisR we present a protocol for use of the updated Waterfall() function to create a customizable oncoprint style plot of the mutational landscape of a tumor cohort. We explain the basics of installation, data import, configuration, plotting, clinical annotation and customization. A companion online workshop describing the GenVisR library, Waterfall() function, and other genomic visualization tools is available at genviz.org.
Keywords: Bioconductor, R, Genome Visualization
Introduction:
The creation of genomic visualizations remains an integral part of data exploration and presentation(Qu et al., 2019). Since its inception GenVisR has focused on supporting this facet of bioinformatics, lowering the entry point for high quality visualizations. The GenVisR library has numerous functions covering visualization of mutations (e.g., single nucleotide variants, insertions, deletions), mutation features (e.g., transitions versus transversions), loss of heterozygosity, copy number alterations, and other genomic events. As of May 2021, the GenVisR library is in the 87th percentile of all Bioconductor packages. It has found use in diverse analyses, including large-scale cancer studies, explorations of agricultural crop resistance genes, and recently, examination of the COVID-19 mutational landscape (Bayer et al., 2019; Napit et al., n.d.; Wagner et al., 2018). Efforts to improve the functionality of GenVisR have continued and have recently centered around the popular Waterfall() function. This function produces an Oncoprint style plot where somatic variant data and relevant metrics are displayed at the cohort level(Gao et al., 2013). This function has been re-factored to include several enhancements, including the conversion from a functional to object-oriented model using the Bioconductor S4 class system. This has numerous development advantages and will decrease the likelihood of a user encountering unexpected errors. Further improvements include the extensive use of the data.table package in function internals, providing significant performance improvements in terms of speed and memory. The expansion of unit tests, with > 95% code coverage has reduced the chance that a package update introduces an unforeseen bug. Finally numerous improvements to the end user experience have been made including new functions to retrieve data from the plots.
Basic Protocol 1: Generating a Waterfall() plot from original data
The GenVisR Waterfall() function has the ability to read in data in a variety of formats including Ensembl Variant Effect Predictor (VEP) or mutation annotation formats (MAF)(McLaren et al., 2016); (File Format: MAF - GDC Docs, n.d.). These standard formats have the advantages of being widely used and simple to create. However, the Waterfall() function also has the flexibility to support custom data formats in the form of a data.frame or data.table structure, given the structure has at least gene, sample, and mutation information. Here we will use that method for an illustrative set of variant calls from a Phase 1 clinical trial of Buparlisib for metastatic breast cancer patients(Ma et al., 2016). This file was derived from pipelines running the Genome Modeling System(Griffith et al., 2015).
Necessary Resources:
Hardware - A modern compute environment capable of running R/Rstudio > 3.5.0.
Software - R/Rstudio and the bioconductor package GenVisR, GenVisR can be installed via bioconductor. See Support Protocol 1.
Files - An example dataset containing variant calls from a Phase1 clinical trial is available at: http://genomedata.org/gen-viz-workshop/GenVisR/BKM120_Mutation_Data.tsv
Protocol steps and annotations:
- Load the “GenVisR” and “data.table” libraries, if they are not installed see Support Protocol 1. Note that data.table is a GenVisR dependency and will be installed automatically when installing GenVisR
- library(GenVisR)
- library(data.table)
- Read in available mutation data, here we read a custom TSV file directly from a url into a data.table object.
- myVars <-fread(“http://genomedata.org/gen-viz-workshop/GenVisR/BKM120_Mutation_Data.tsv”)
- The Waterfall() function will look for specific column names within the data.table, these are expected to be “sample”, “gene”, and “mutation”, here we rename our columns to conform to this expectation. The amino acid change column is not required but is used in protocol 4. All other columns are not used and ignored.
- myVars <- myVars[,.(`patient`, `gene namè, `trv typè, àmino acid changè)]
-
setnames(myVars, c(“sample”, “gene”, “mutation”, “amino acid change”))Note: The backticks above are necessary because of the spaces in our column names
- In situations where there are multiple mutations for the same gene/sample, we need to specify which mutation type should get the priority for plotting purposes. This is done by defining a mutation hierarchy as a data.table where the most significant mutation should come first. We also tell Waterfall what colors we would like to plot in this step.
- myHierarchy <- data.table(“mutation”=c(“nonsense”, “frame_shift_del”, “frame_shift_ins”, “in_frame_del”, “splice_site_del”, “splice_site”, “missense”, “splice_region”, “rna”), color=c(“#FF0000”, “#00A08A”, “#F2AD00”, “#F98400”, “#5BBCD6”, “#046C9A”, “#D69C4E”, “#000000”, “#446455”))
- With the core data imported we can now construct our plot object, the output will include not only graphical objects but the underlying data from which they were constructed as well.
- plotData <- Waterfall(myVars, mutationHierarchy = myHierarchy)
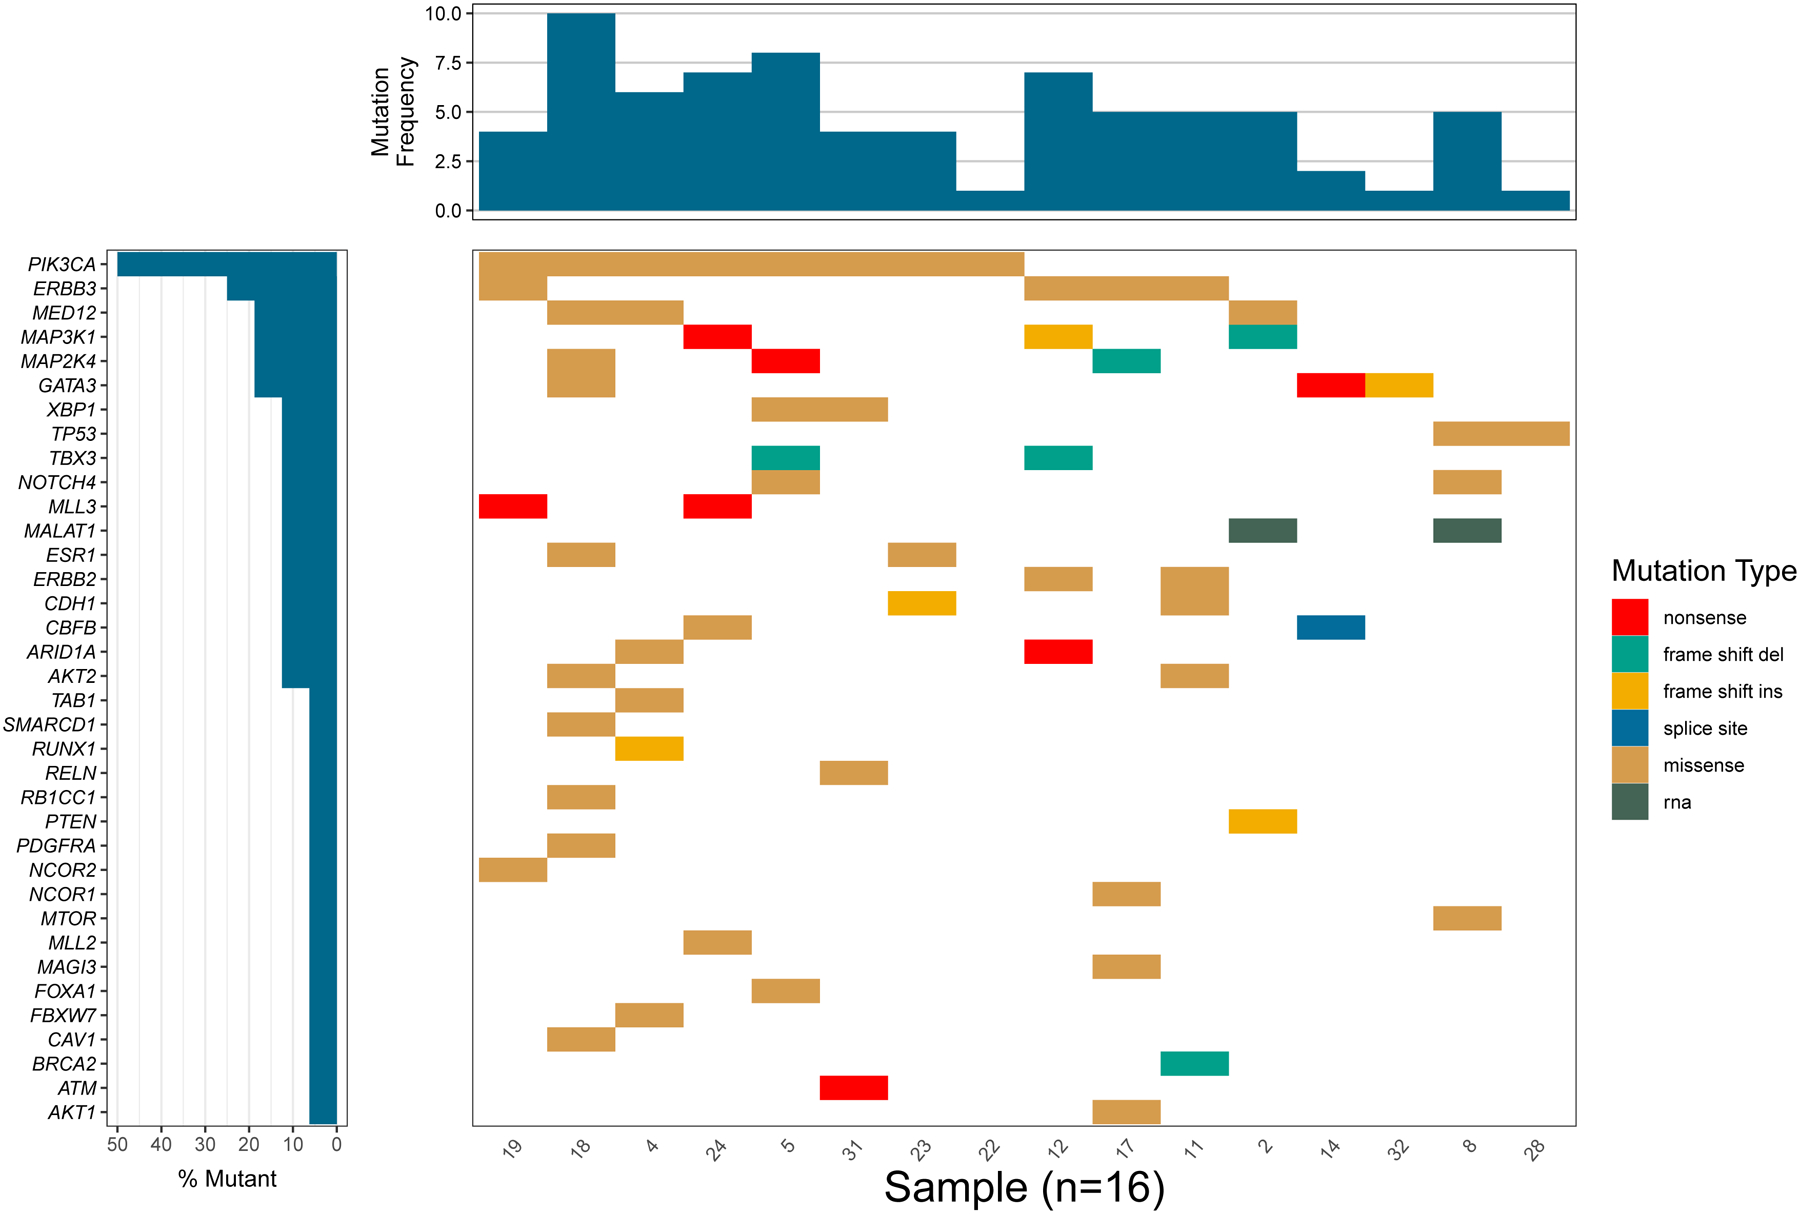
- We next save this plot to a pdf device for viewing and/or publication. First we open a pdf device in R, we then use the GenVisR drawPlot() function to output a plot (Figure 1), and finally close the graphics device.
- pdf(file=“Figure_1.pdf”, height=8, width=12)
- drawPlot(plotData)
-
dev.off()Note: Saving to a PDF is optional, calling drawPlot() by itself will generate a plot in the Rstudio viewer window. Also, R provides a number of options for saving graphics, in addition to pdf() there are png(), jpeg(), tiff(), and bmp() functions that are available for use within base R.
Figure 1.

GenVisR drawPlot() function plot of multiple mutations within the same gene/sample.
Basic Protocol 2: Adding clinical data to a Waterfall() plot
It is often beneficial to view clinical annotations for each patient in the context of mutations. Doing so may help identify important associations. For example, mutations in a specific gene may be associated with treatment response, sex, tumor stage or subtype. Waterfall() allows for the addition of clinical annotations to make such patterns obvious. This protocol is an addendum to Basic Protocol 1 and assumes the relevant libraries and data from that protocol are already present.
Necessary Resources:
Hardware - A modern compute environment capable of running R/Rstudio > 3.5.0.
Software - R/Rstudio, GenVisR
-
Files - An example dataset containing clinical data from a Phase1 clinical trial is available at: http://genomedata.org/gen-viz-workshop/GenVisR/BKM120_Clinical.tsv, myVars, myHierarchy
Note: See Basic Protocol 1
Protocol steps and annotations:
- First, read the clinical data. In this case, data is saved in a custom TSV file and read directly from a URL.
- myClinical <-fread(“http://genomedata.org/gen-viz-workshop/GenVisR/BKM120_Clinical.tsv”)
- Subset the clinical data to the data needed for this example. We require sample information and one or more clinical variables.
- myClinical <- myClinical[,.(`sample Number`, `Best responsè, `PTEN Immunohist.`)]
- The “sample” name column should be named as such, and should match those sample designations which were used in the myVars data structure (i.e. Sample 1 should be named as such in both the myVars and myClinical data objects).
- setnames(myClinical, c(“sample”, “Best response”, “PTEN Immunohist.”))
- myClinical[,sample := gsub(“WU0+”,”“,sample)]
- Create a named vector for clinical variables and colors to set a color palette. In our example we have six clinical variables we must supply names and colors for.
-
myClinicalColors <- c(“Progressive Disease”=“#798E87”, “Stable Disease”=“#C27D38”, “Partial Response”=“#CCC591”, “negative”=“#29211F”, “positive”=“#9C964A”, “unknown”=“#85D4E3”)We use hex codes here to designate color, but any character string R can recognize as a color will work.
-
- Read the clinical information into GenVisR via the Clinical() function. This function looks for a data.frame or data.table with a “sample” column. All other columns will be treated as clinical variables. We also set a color palette and specify that we would like our legend split up into two columns.
- clinicalData <- Clinical(inputData = myClinical, palette = myClinicalColors, legendColumns = 2)
- Call the Waterfall() function as before, this time including the clinical object we created above via the “clinical” parameter.
- plotData <- Waterfall(myVars, mutationHierarchy = myHierarchy, clinical = clinicalData)
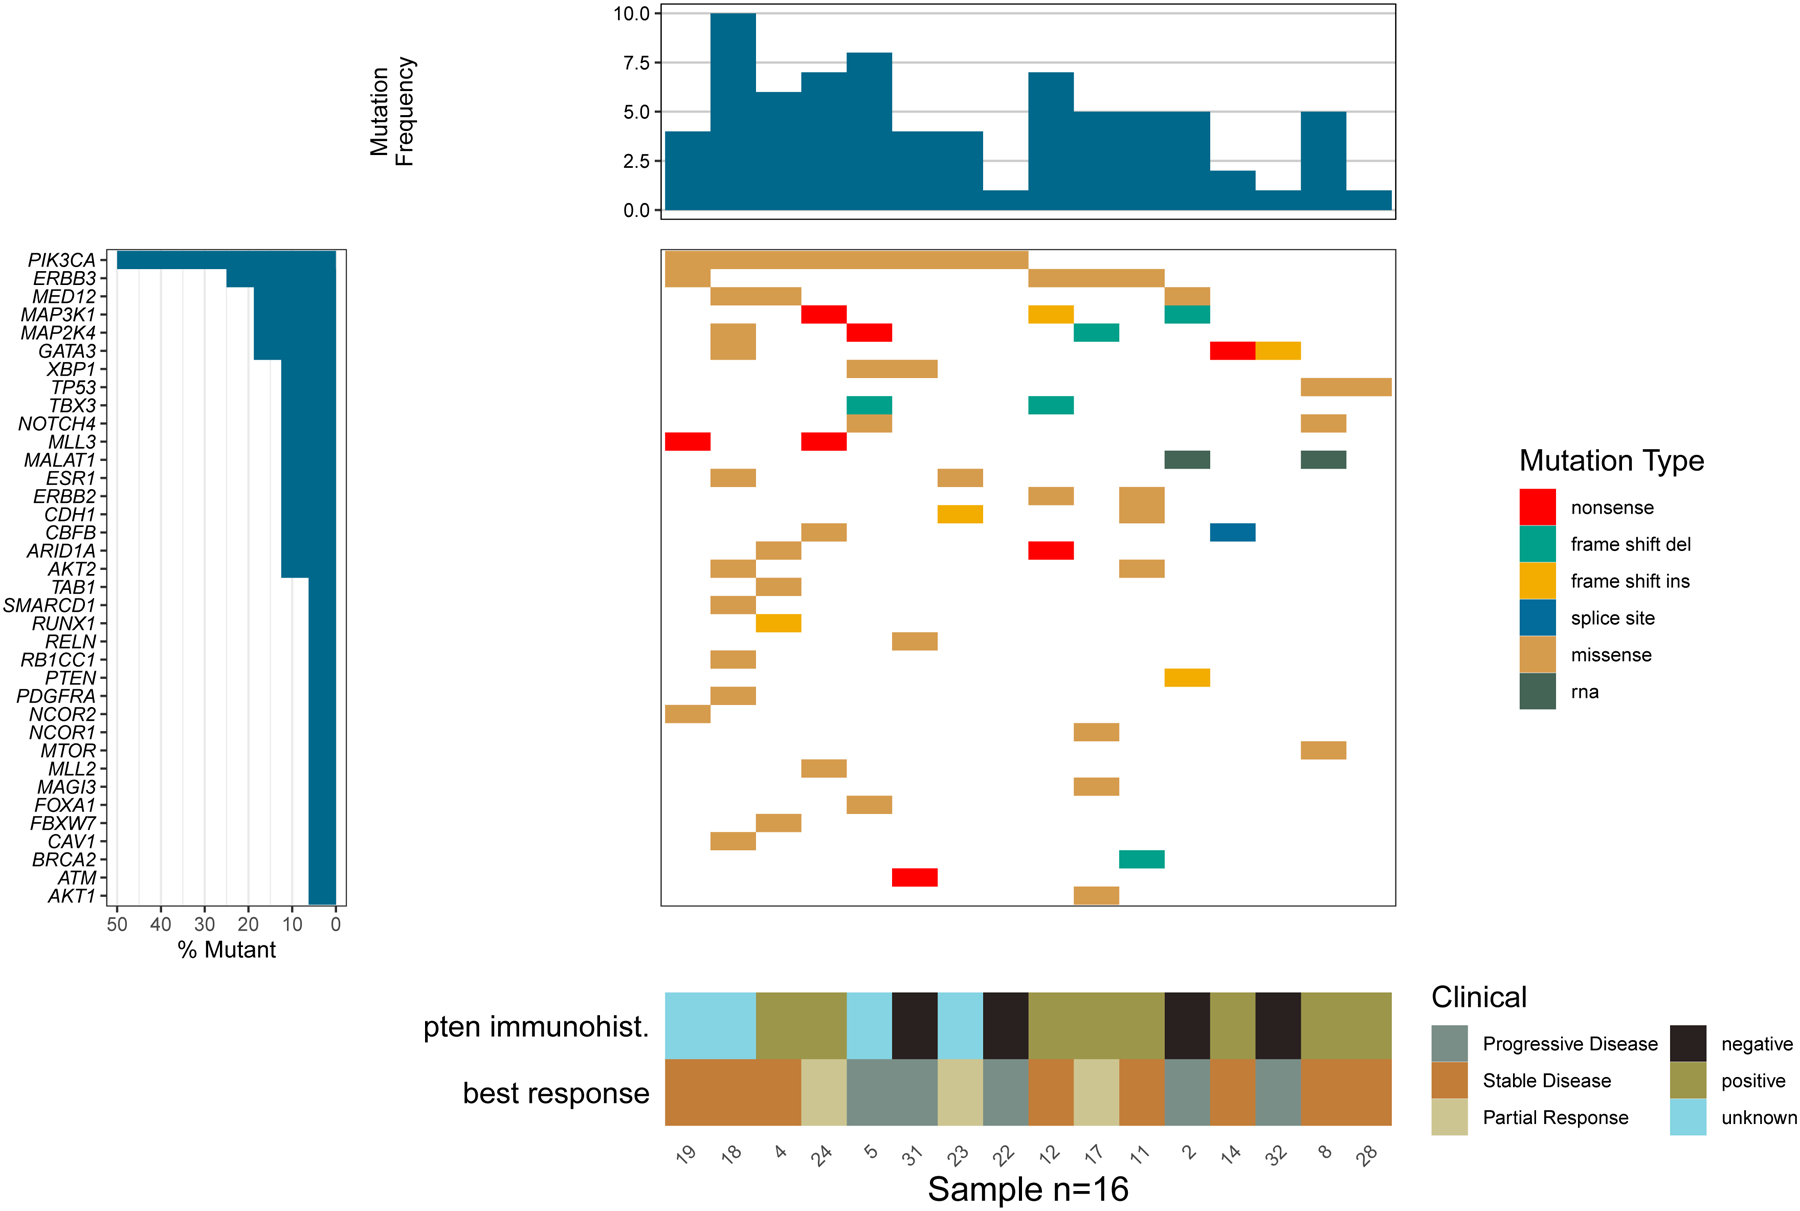
- As the final step in this protocol, save and view the final plot (Figure 2) as was done in Basic Protocol 1.
- pdf(file=“Figure_2.pdf”, height=8, width=12)
- drawPlot(plotData)
- dev.off()
Figure 2.

Clinical annotations for a sample within the context of mutations utilizing the Waterfall() function.
Basic Protocol 3: Customizing mutation burden in Waterfall() plots
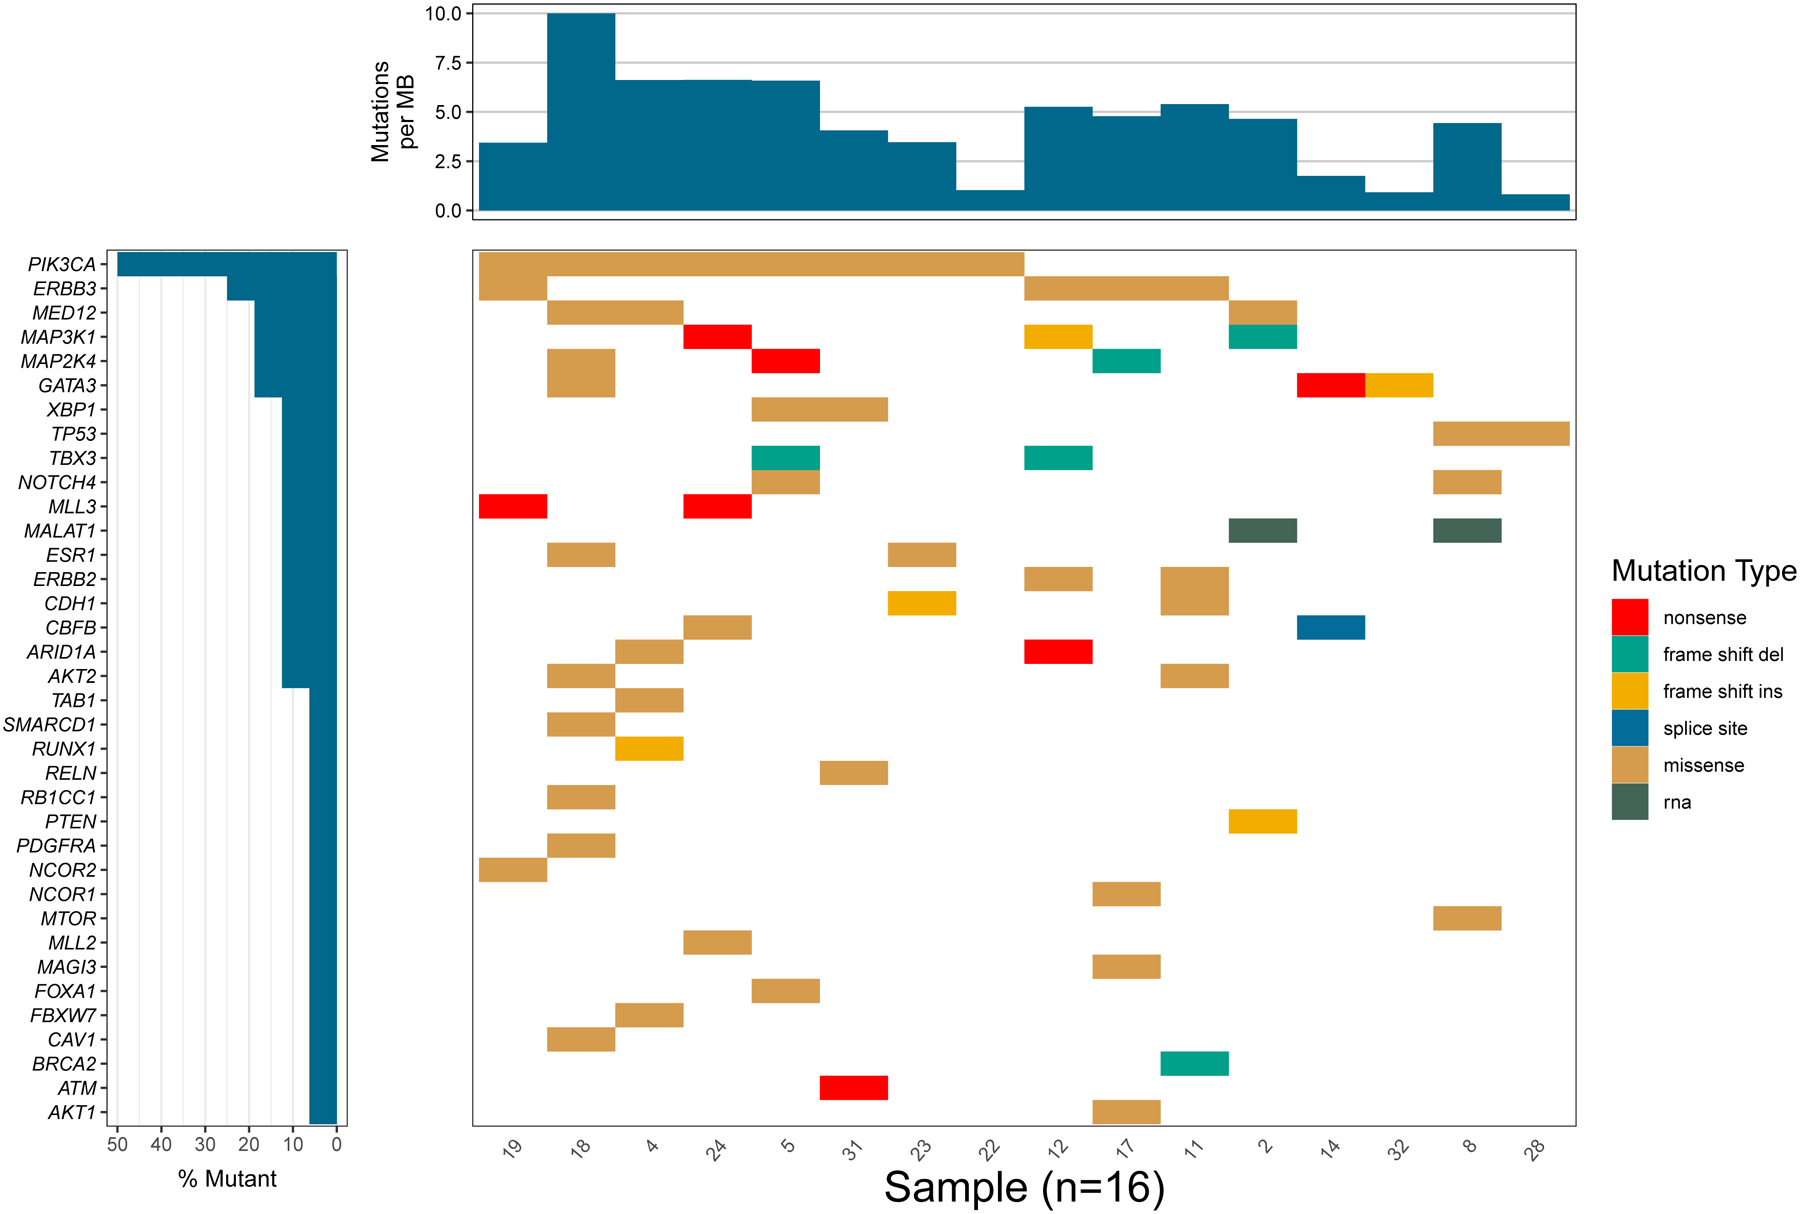
By default the Waterfall() function will display observed mutation frequencies from the input data prior to any filtering that the function itself does. However this can be misleading due to variances in the genomic space sequenced amongst the cohort. This issue can be resolved by calculating the tumor mutation burden (TMB) which normalizes for covered space. In this protocol we examine how to instruct Waterfall() to output a TMB instead of a frequency for the top panel.
Necessary Resources:
Hardware - A modern compute environment capable of running R/Rstudio > 3.5.0.
Software - R/Rstudio, GenVisR
-
Files - An example dataset containing coverage data from a Phase1 clinical trial is available at: http://genomedata.org/gen-viz-workshop/GenVisR/bkm120_coverage.txt myVars, myHierarchy
Note: See Basic Protocol 1
Protocol steps and annotations:
- First, read in the coverage data from a custom TSV file. The file contains a sample column and the number of bases covered to at least 20x.
- mutationBurden <-fread(“http://genomedata.org/gen-viz-workshop/GenVisR/bkm120_coverage.txt”)
- The sample column must match the sample identifiers used in the main plot. We use a regular expression here so the identifiers match between the data in the mutationBurden and myVars objects.
- mutationBurden[,sample := gsub(“WU0+”, ““, sample)]
- The parameter in Waterfall() which specifies the coverage space for each sample requires a named vector. Here we create that object.
- myMutBurden <- as.numeric(mutationBurden$coverage)
- names(myMutBurden) <- mutationBurden$sample
- The Waterfall() function will plot mutation burden instead of mutation frequency if we set the “burden” flag for the “plotA” parameter. We also supply the named vector holding the coverage space so Waterfall() can properly calculate this for each sample using the parameter “coverage”.
- plotData <- Waterfall(myVars, mutationHierarchy = myHierarchy, coverage=myMutBurden, plotA = “burden”)
- Finally, we output the plot (Figure 3) to a pdf device as done in prior protocols.
- pdf(file=“Figure_3.pdf”, height=8, width=12)
- drawPlot(plotData)
- dev.off()
Figure 3.

Calculated tumor mutation burden (TMB) for a sample with normalized covered space utilizing the Waterfall() function.
Basic Protocol 4: Brief exploration of customizable options
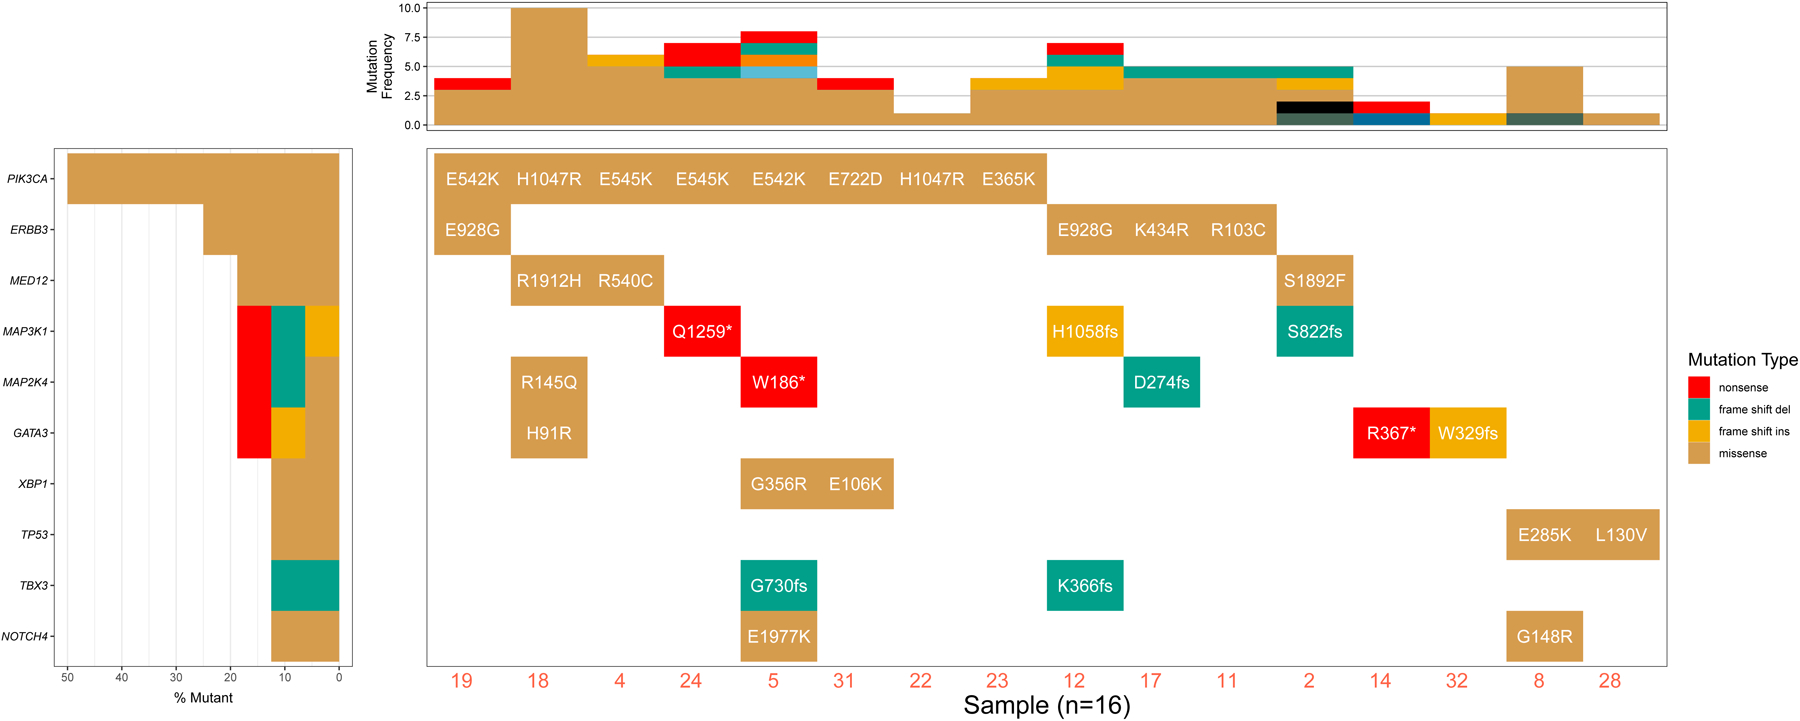
GenVisR functions are designed to be user friendly with many aesthetic options exposed to the end user. However, exposing all aesthetic options as parameters is unfeasible. To get around this, all GenVisR plots can add layers conforming to the ‘grammar of graphics’ paradigm used by ggplot2(Wickham, 2016). With knowledge of ggplot2 syntax, virtually any aesthetic element in a plot can be manipulated. In this protocol we use some of the Waterfall() function exposed features to add greater detail to the mutation subplot (top sub-panel; plotA) and the gene subplot (left sub-panel; plotB). We also will limit the size of the display to 10 genes, and add labels to plot cells. We then go on to use ggplot to manipulate additional aesthetic features of the main plot (main panel; plotC), specifically we change the color and rotation of the x-axis labels as well as increase its size. These parameters are a small subset of options available to users, additional parameters include additional aesthetic changes, data filtering options, and annotation parameters. A full list of parameters is available within the R documentation of the GenVisR library.
Necessary Resources:
Hardware - A modern compute environment capable of running R/Rstudio > 3.5.0.
Software - R/Rstudio, GenVisR
-
Files - myVars, myHierarchy
Note: See Basic Protocol 1
Protocol steps and annotations:
- The waterfall function can tabulate counts per mutation type for both the sample and gene subplots, these are controlled by switching the plotATally and plotBTally parameters to from “simple” to “complex”. With these parameter settings, the top and side plots now show a more complex view of mutation frequency colored by mutation type.
- plotData <- Waterfall(myVars, mutationHierarchy = myHierarchy, plotATally = “complex”, plotBTally = “complex”)
- A common request is to add additional information to waterfall plot cells in addition to mutation type. GenVisR supports this if there is a column in the original input from which to pull additional annotations. Here we modify the labels in the “amino acid change” column of myVars (see protocol 1), and set up Waterfall() to pull these annotations.
- myVars[,àmino acid changè := gsub(“p.”, ““, àmino acid changè)]
- plotData <- Waterfall(myVars, labelColumn=“amino acid change”, mutationHierarchy = myHierarchy, plotATally = “complex”, plotBTally = “complex”)
- It is often useful to view only a subset of available data. Here, we will use the geneMax parameter to specify that only the top 10 most common genes should be displayed.
- plotData <- Waterfall(myVars, labelColumn=“amino acid change”, mutationHierarchy = myHierarchy, plotATally = “complex”, plotBTally = “complex”, geneMax=10)
- Adding ggplot2 layers to a plot allows control over aesthetic elements. Here we adjust the axis text of the main plot to be horizontal, bigger, and colored red. We load the ggplot2 library first. Then use ggplot2 syntax and save the resulting object into a list. This is then passed into the Waterfall() function via the parameter “plotCLayers”.
- library(ggplot2)
- newLayer <- list(theme(axis.text.x=element_text(angle=0, color=“tomato1”, size=16)))
- plotData <- Waterfall(myVars, labelColumn=“amino acid change”, mutationHierarchy = myHierarchy, plotATally = “complex”, plotBTally = “complex”, geneMax=10, plotCLayers = newLayer)
- Save and view the plot (Figure 4) as before. In order to fit the text of the cell labels onto the plot we slightly increase the width of the graphics device to 20.
- pdf(file=“Figure_4.pdf” height=8, width=20)
- drawPlot(plotData)
- dev.off()
Figure 4.

Demonstration of the Waterfall() function, which can be used to expose features to add greater detail to the mutation subplot (top sub-panel; plotA) and the gene subplot (left sub-panel; plotB).
Support Protocol 1: Installing GenVisR
A brief guide for installing R/Rstudio and supporting software. We recommend installing GenVisR via bioconductor.
Necessary Resources:
Hardware - A modern compute environment capable of running R/Rstudio > 3.5.0.
Software - R/Rstudio
Files - None
Protocol steps and annotations:
Download R from https://www.r-project.org/, open the installer and follow the installation prompts.
Download Rstudio Desktop from https://www.rstudio.com, open the installer and follow the installation prompts
- Open Rstudio, and type the following command:
- if (!requireNamespace(“BiocManager”, quietly = TRUE))
- install.packages(“BiocManager”)
- BiocManager::install(“GenVisR”)
This will install the bioconductor package manager “BiocManager” if it is not already installed and will then install GenVisR from Bioconductor.
Guidelines For Understanding Results:
GenVisR and its associated functions are based on the grammar of graphics (ggplot2) package(Wickham, 2016). Graphical objects output by GenVisR are essentially “GROB” objects from ggplot2 (refer to ggplot2 documentation for details). As such, users can control any aspect of a GenVisR plot not already controlled by a parameter through the addition of ggplot2 layers. Such modifications require at least a basic understanding of ggplot2 syntax. In addition, the Waterfall() function now includes the underlying data in its output in the form of data.tables. Users are able to access this information through the S4 slot selector “@”. For example, accessing the primary data of the plot outputs specified in the protocols above would look like this: plotData@primaryData. All GenVisR functions have R Documentation included within the package, for a complete list of parameters, options, and additional details this documentation can be accessed by prepending a question mark in front of the function name (i.e., ?Waterfall) within the R interface.
Commentary:
Background Information:
Oncoprint style plots(Mayakonda et al., 2018); (Gu et al., 2016) are commonly used in cancer genomics to aid in visually elucidating mutually exclusive or co-occurring mutation events or genotype-phenotype associations. Such events are known to happen in a variety of cancers and can inform treatment options. For example, PTEN and PIK3CA mutations have been shown to be mutually exclusive in myxoid liposarcoma(Demicco et al., 2012), emphasizing the importance of visualization of these events. Furthermore, Oncoprint style plots have the benefit of summarizing a cohort in a compact and efficient way. This visualization method not only provides a view of mutations, but also the tumor mutation burden, the importance of each gene across the cohort, and the types of mutations impacting genes-of-interest, providing insight into the role of the gene itself. For example, a gene with a preponderance of loss-of-function mutations might be indicative of a tumor suppressor. Further, The ability to add clinical data may support the identification of genomic patterns that would remain otherwise obscure.
Critical Parameters:
Users of this protocol should ensure they are using a recent version of R and GenVisR. At the time of this writing R (4.0.5) and GenVisR (1.24.0) are used. Further, users should be aware that two waterfall functions exist within the GenVisR package. This protocol corresponds to Waterfall() (note the capital W, differentiating the function from the previous waterfall() function).
Troubleshooting:
Suggestions for further analysis:
There are many tools available for genomic visualizations, from foundational plotting libraries such as ggplot2 and D3(Bostock et al., 2011; Wickham, 2016) to higher level tools such as GenVisR. To further explore genomic visualization topics, we recommend genviz.org(Skidmore et al., 2019), a blog style website designed to decrease the time required to learn GenVisR and other genome visualization tools. The genviz.org website covers several areas related to genomic visualization including web-based tools, GenVisR, R/ggplot2, genome browsers, and others.
Data Availability Statement:
Required data for this protocol will remain available at genomedata.org.
Table 1.
Troubleshooting
| Problem | Possible Cause | Solution |
|---|---|---|
| Data from URL is inaccessible | Server hosting the data is offline. | If the problem persists for 24 hours, contact the corresponding authors. |
Acknowledgements:
MG was supported by the National Human Genome Research Institute (R00HG007940). OLG was supported by the National Cancer Institute (K22CA188163). We gratefully acknowledge the participants of Cold Spring Harbor Laboratories courses, Canadian Bioinformatics Workshops, Evomics workshops and Physalia Courses as well as the GenVisR user community for bug reports and helpful suggestions.
Footnotes
Conflict Of Interest:
KMC is a shareholder in Geneoscopy LLC and receives consulting fees from PACT Pharma and Tango Therapeutics.
Literature Cited:
- Bayer PE, Golicz AA, Tirnaz S, Chan C-KK, Edwards D, & Batley J (2019). Variation in abundance of predicted resistance genes in the Brassica oleracea pangenome. Plant Biotechnology Journal, 17(4), 789–800. [DOI] [PMC free article] [PubMed] [Google Scholar]
- Bostock M, Ogievetsky V, & Heer J (2011). D3: Data-Driven Documents. IEEE Transactions on Visualization and Computer Graphics, 17(12), 2301–2309. [DOI] [PubMed] [Google Scholar]
- Demicco EG, Torres KE, Ghadimi MP, Colombo C, Bolshakov S, Hoffman A, Peng T, Bovée JVMG, Wang W-L, Lev D, & Lazar AJ (2012). Involvement of the PI3K/Akt pathway in myxoid/round cell liposarcoma. Modern Pathology: An Official Journal of the United States and Canadian Academy of Pathology, Inc, 25(2), 212–221. [DOI] [PMC free article] [PubMed] [Google Scholar]
- File Format: MAF - GDC Docs. (n.d.). RetrievedJune 11, 2021, from https://docs.gdc.cancer.gov/Data/File_Formats/MAF_Format/#introduction
- Gao J, Aksoy BA, Dogrusoz U, Dresdner G, Gross B, Sumer SO, Sun Y, Jacobsen A, Sinha R, Larsson E, Cerami E, Sander C, & Schultz N (2013). Integrative analysis of complex cancer genomics and clinical profiles using the cBioPortal. Science Signaling, 6(269), l1. [DOI] [PMC free article] [PubMed] [Google Scholar]
- Griffith M, Griffith OL, Smith SM, Ramu A, Callaway MB, Brummett AM, Kiwala MJ, Coffman AC, Regier AA, Oberkfell BJ, Sanderson GE, Mooney TP, Nutter NG, Belter EA, Du F, Long RL, Abbott TE, Ferguson IT, Morton DL, … Wilson RK (2015). Genome Modeling System: A Knowledge Management Platform for Genomics. PLoS Computational Biology, 11(7), e1004274. [DOI] [PMC free article] [PubMed] [Google Scholar]
- Gu Z, Eils R, & Schlesner M (2016). Complex heatmaps reveal patterns and correlations in multidimensional genomic data. In Bioinformatics (Vol. 32, Issue 18, pp. 2847–2849). 10.1093/bioinformatics/btw313 [DOI] [PubMed] [Google Scholar]
- Ma CX, Luo J, Naughton M, Ademuyiwa F, Suresh R, Griffith M, Griffith OL, Skidmore ZL, Spies NC, Ramu A, Trani L, Pluard T, Nagaraj G, Thomas S, Guo Z, Hoog J, Han J, Mardis E, Lockhart C, & Ellis MJ (2016). A Phase I Trial of BKM120 (Buparlisib) in Combination with Fulvestrant in Postmenopausal Women with Estrogen Receptor-Positive Metastatic Breast Cancer. Clinical Cancer Research: An Official Journal of the American Association for Cancer Research, 22(7), 1583–1591. [DOI] [PMC free article] [PubMed] [Google Scholar]
- Mayakonda A, Lin D-C, Assenov Y, Plass C, & Phillip Koeffler H (2018). Maftools: efficient and comprehensive analysis of somatic variants in cancer. In Genome Research (Vol. 28, Issue 11, pp. 1747–1756). 10.1101/gr.239244.118 [DOI] [PMC free article] [PubMed] [Google Scholar]
- McLaren W, Gil L, Hunt SE, Riat HS, Ritchie GRS, Thormann A, Flicek P, & Cunningham F (2016). The Ensembl Variant Effect Predictor. Genome Biology, 17(1), 122. [DOI] [PMC free article] [PubMed] [Google Scholar]
- Napit R, Manandhar P, Chaudhary A, Shrestha B, Poudel A, Raut R, Pradhan S, Raut S, Mathema S, Rajbhandari R, Dixit S, Schwind JS, Johnson CK, Mazet JK, & Karmacharya D (n.d.). Rapid genomic surveillance of SARS-CoV-2 in a dense urban community using environmental (sewage) samples. 10.1101/2021.03.29.21254053 [DOI] [PMC free article] [PubMed] [Google Scholar]
- Qu Z, Lau CW, Nguyen QV, Zhou Y, & Catchpoole DR (2019). Visual Analytics of Genomic and Cancer Data: A Systematic Review. Cancer Informatics, 18. 10.1177/1176935119835546 [DOI] [PMC free article] [PubMed] [Google Scholar]
- Skidmore Z, Griffith M, Griffith O, kcampbel, & Cotto K (2019). griffithlab/genviz.org: Initial release for doi. 10.5281/zenodo.2584386 [DOI]
- Wagner AH, Devarakonda S, Skidmore ZL, Krysiak K, Ramu A, Trani L, Kunisaki J, Masood A, Waqar SN, Spies NC, Morgensztern D, Waligorski J, Ponce J, Fulton RS, Maggi LB Jr, Weber JD, Watson MA, O’Conor CJ, Ritter JH, … Govindan R (2018). Recurrent WNT pathway alterations are frequent in relapsed small cell lung cancer. Nature Communications, 9(1), 3787. [DOI] [PMC free article] [PubMed] [Google Scholar]
- Wickham H (2016). Getting Started with ggplot2. In Use R! (pp. 11–31). 10.1007/978-3-319-24277-4_2 [DOI] [Google Scholar]
Associated Data
This section collects any data citations, data availability statements, or supplementary materials included in this article.
Data Availability Statement
Required data for this protocol will remain available at genomedata.org.


