Abstract
Obesity alters skeletal muscle lipidome and promotes myopathy, but it is unknown whether aberrant muscle lipidome contributes to the reduction in skeletal muscle contractile force-generating capacity. Comprehensive lipidomic analyses of mouse skeletal muscle revealed a very strong positive correlation between the abundance of lysophosphatidylcholine (lyso-PC), a class of lipids that is known to be downregulated with obesity, to maximal tetanic force production. The level of lyso-PC is regulated primarily by lyso-PC acyltransferase 3 (LPCAT3), which acylates lyso-PC to form phosphatidylcholine. Tamoxifen-inducible skeletal muscle-specific overexpression of LPCAT3 (LPCAT3-MKI) was sufficient to reduce muscle lyso-PC content in both standard chow diet (SCD) and high-fat diet (HFD)-fed conditions. Strikingly, assessment of skeletal muscle force-generating capacity ex vivo revealed that muscles from LPCAT3-MKI mice were weaker regardless of diet. Defects in force production were more apparent in HFD-fed condition, where tetanic force production was 40% lower in muscles from LPCAT3-MKI compared to that of control mice. These observations were partly explained by reductions in the cross-sectional area in type IIa and IIx fibers, and signs of muscle edema in the absence of fibrosis. Future studies will pursue the mechanism by which LPCAT3 may alter protein turnover to promote myopathy.
Keywords: skeletal muscle, myopathy, lysophospholipid, diabetes
1. Introduction:
Defects in skeletal muscle contractile activity are a hallmark of many musculoskeletal and neurodegenerative diseases. In addition to those observed in cancer patients, aged individuals, with disuse, or muscular dystrophies (1–7), loss of skeletal muscle mass and/or force-generating capacity occurs in patients with type 2 diabetes (8, 9). Loss of muscle mass or strength is detrimental and correlates with negative health outcomes (10, 11).
The mechanism by which diabetes promotes skeletal muscle myopathy is unclear. One possible cause is the altered muscle lipid milieu observed with obesity and/or type 2 diabetes (12–14). Evidence suggests that skeletal muscle lipid composition is robustly altered in multiple examples of skeletal muscle myopathy (6, 15, 16). Indeed, several studies from our group and others provide evidence that overexpression or deletion of lipid-synthesizing enzymes can cause contractile defects in skeletal muscle (17–22).
The purpose of this study was to understand whether alterations in skeletal muscle lipids can explain the contractile dysfunction associated with obesity. Comprehensive lipidomic analyses revealed a robust positive correlation of skeletal muscle lysophosphatidylcholine (lyso-PC) and maximal force-generating capacity. Compared to a PC molecule, lyso-PC lacks an acyl chain typically at the sn-2 position (23). The levels of lyso-PC are regulated by the enzymes of Lands cycle, a phospholipid transacylation pathway (24–26). In skeletal muscle, lyso-PC is primarily regulated by lyso-PC acyltransferase 3 (LPCAT3) which preferentially utilizes polyunsaturated fatty acids to acylate lyso-PC (14, 27, 28). Thus, these findings were further explored with studies on mice with skeletal muscle-specific overexpression of LPCAT3 to examine whether low muscle lyso-PC makes mice more prone to myopathy in lean and obese mice.
2. Materials and Methods
Animals
All mice were studied at ~20 wks of age and were on the C57BL/6J background. Tamoxifen-inducible LPCAT3 skeletal muscle-specific knock-in (LPCAT3-MKI) mice were generated to study the effects of LPCAT3 overexpression specifically in skeletal muscle (14). LPCAT3-conditional knock-in (LPCAT3cKI+/+) mice were generated by inserting a FLAG-tagged Lpcat3 cDNA sequence with a preceding lox-STOP-lox sequence into the Rosa26 locus. LPCAT3cKI+/+ mice were crossed with skeletal muscle-specific tamoxifen-inducible (HSA-MCM+/−) mice to generate LPCAT3-MKI (LPCAT3cKI+/−, HSA-MCM+/−) and control (LPCAT3cKI+/−, HSA-MCM−/−) mice. All mice were subject to tamoxifen treatment (intraperitoneal injection 5 consecutive days, 7.5 μg/g body mass) and a 2-week washout period. Mice were then studied with standard chow diet (SCD) or 8 weeks of high-fat diet (HFD, TD.88137 from Envigo) feeding. Mice were maintained on a 12 hour light/dark cycle in a temperature-controlled room. Prior to all terminal experiments and tissue harvesting, mice were fasted for 4 hours prior to anesthetization by intraperitoneal injection of 80 mg/kg ketamine and 10 mg/kg xylazine. Data are from both sexes as effects of LPCAT3 overexpression were observed in both male and female mice. All experimental procedures were approved by the University of Utah Institutional Animal Care and Use Committee.
Mass Spectrometry
Lipidomic analyses of mouse tibialis anterior muscle were performed at the Metabolomics Core at the University of Utah as previously described (14). Briefly, extracted lipids with internal standards (Avanti Polar Lipids: 330707) were analyzed with an Agilent triple-quadrupole mass spectrometer (QqQ-MS/MS) for targeted analysis and Agilent quadrupole time of flight mass spectrometer (QTOF-MS/MS) for untargeted analysis. The quantity of each lipid species was normalized to the total protein content of each sample.
Quantitative Reverse Transcription-PCR
Samples were homogenized in TRIzol reagent (Life Technologies, Grand Island, NY) to extract total RNA as previously described (14). 1 μg RNA was reverse transcribed using IScript™ cDNA synthesis kit (Biorad, Hercules, CA). RT-PCR was performed with the Viia™ 7 Real-Time PCR System (Life Technologies, Grand Island, NY) using SYBR® Green reagent (Life Technologies, Grand Island, NY). All data were normalized to ribosomal L32 gene expression (L32 mRNA levels were not different between groups). Mouse primer sequences used were (5’→3’): TTCCTGGTCCACAATGTCAA (L32 forward), GGCTTTTCGGTTCTTAGAGGA (L32 reverse), GGCCTCTCAATTGCTTATTTCA (LPCAT3 forward), AGCACGACACATAGCAAGGA (LPCAT3 reverse).
Skeletal Muscle Force Production
Force production in extensor digitorum longus (EDL) muscle was measured as previously described (14, 18, 29). Briefly, EDL muscles were sutured at each tendon and placed in a tissue bath (Aurora Scientific, Model 801C). The optimal length (Lo) of each muscle was determined by pulse stimulation. After Lo was achieved muscles were stimulated (0.35 seconds, 0.2-millisecond pulse width) at frequencies ranging from 10–200 Hz. Muscle length and mass were measured to quantify muscle cross-sectional area for force production. The rate of contraction was quantified by taking the average rate of contraction between 20–80% from the start of stimulation to peak force, and the rate of relaxation was quantified by analyzing the average rate of relaxation between 20–80% of peak force. All data were analyzed using Aurora Scientific DMAv5.321 software.
Skeletal Muscle Histology
Analyses for skeletal muscle myosin heavy chain (MHC) isoform and cross-sectional area (CSA) were performed as previously described (14). Tibialis anterior (TA) muscles were embedded in OCT compound and sectioned at 10 μM using a cryostat (Microtome Plus). After 1 hour of blocking with M.O.M. mouse IgG Blocking Reagent (Vector Laboratories, MKB-2213), myofiber sections were incubated for 1 hour with concentrated BA.D5, SC.71, and BF.F3 (all 1:100; DSHB) in 2.5% normal horse serum. To visualize myosin heavy chain I (MHC I), MHC IIa, and MHC IIb, slides were incubated for 1 hour with the following secondary antibodies, respectively: Alexa Fluor 647 (1:250; Invitrogen, A21242), Alexa Fluor 488 (1:500; Invitrogen, A21121), and Alexa Fluor 555 (1:500; Invitrogen, A21426). Negatively stained fibers were considered MHC IIx. After staining, slides were coverslipped with mounting medium (Vector Laboratories, H-1000). Stained slides were imaged with a fully automated wide-field light microscope (Nikon Corp.) with a 10× objective lens. Images were captured using a high-sensitivity Andor Clara CCD camera. Sirius red staining was performed as previously described (30). Briefly, sections were fixed in Bouin’s fixative for 1 hour at 56°C, stained for 1 hour in Master Tech Picro Sirius Red, and washed in 0.5% glacial acetic acid before mounting with Permount. Sirius red-stained muscles were imaged with a Zeiss Axioscan Slide Scanner microscope.
Statistics
Statistical analysis was performed using Prism 7 software (GraphPad). Two-tailed Student’s t tests were performed with data composed of 2 groups, and 2-way ANOVA followed by Šidák’s multiple-comparison test was performed for more than 2 groups. All data are mean ± SEM, and statistical significance was set at P less than 0.05.
3. Results
Lipidomic analyses reveal a robust positive correlation between muscle lyso-PC and force-generating capacity.
Untargeted lipidomic analyses were performed to quantify species from 12 lipid classes including phosphatidylcholine (PC), phosphatidylethanolamine (PE), phosphatidylglycerol (PG), cardiolipin (CL), phosphatidylinositol (PI), phosphatidylserine (PS), diacylglycerol (DAG), triacylglycerol (TAG), sphingomyelin, cholesterol, lysophosphatidylethanolamine (lyso-PE), and lyso-PC in skeletal muscles from seven C57BL6/J wildtype mice. Pearson correlation analyses between maximal tetanic force production (specific force of the EDL muscle at 200 Hz stimulation) and the abundance of lipid in each of these classes were performed. Of the 12 classes of lipids analyzed, only lyso-PC, lyso-PE, and TAG were significantly correlated with maximal tetanic force production (Figure 1A). Abundances of all three classes were positively correlated with the force production (Figure 1B–D). Among these, muscle TAG is known to become robustly increased with obesity or type 2 diabetes (12, 13), suggesting that low TAG is unlikely to promote muscle weakness in diabetic myopathy. In contrast, a previous study from our laboratory showed decreased muscle lyso-PC and lyso-PE with obesity (14), consistent with the idea that decreased abundance of either of these classes of lipids may promote muscle weakness in diabetic myopathy.
Figure 1: Skeletal muscle lyso-PC correlates with force-generating capacity.
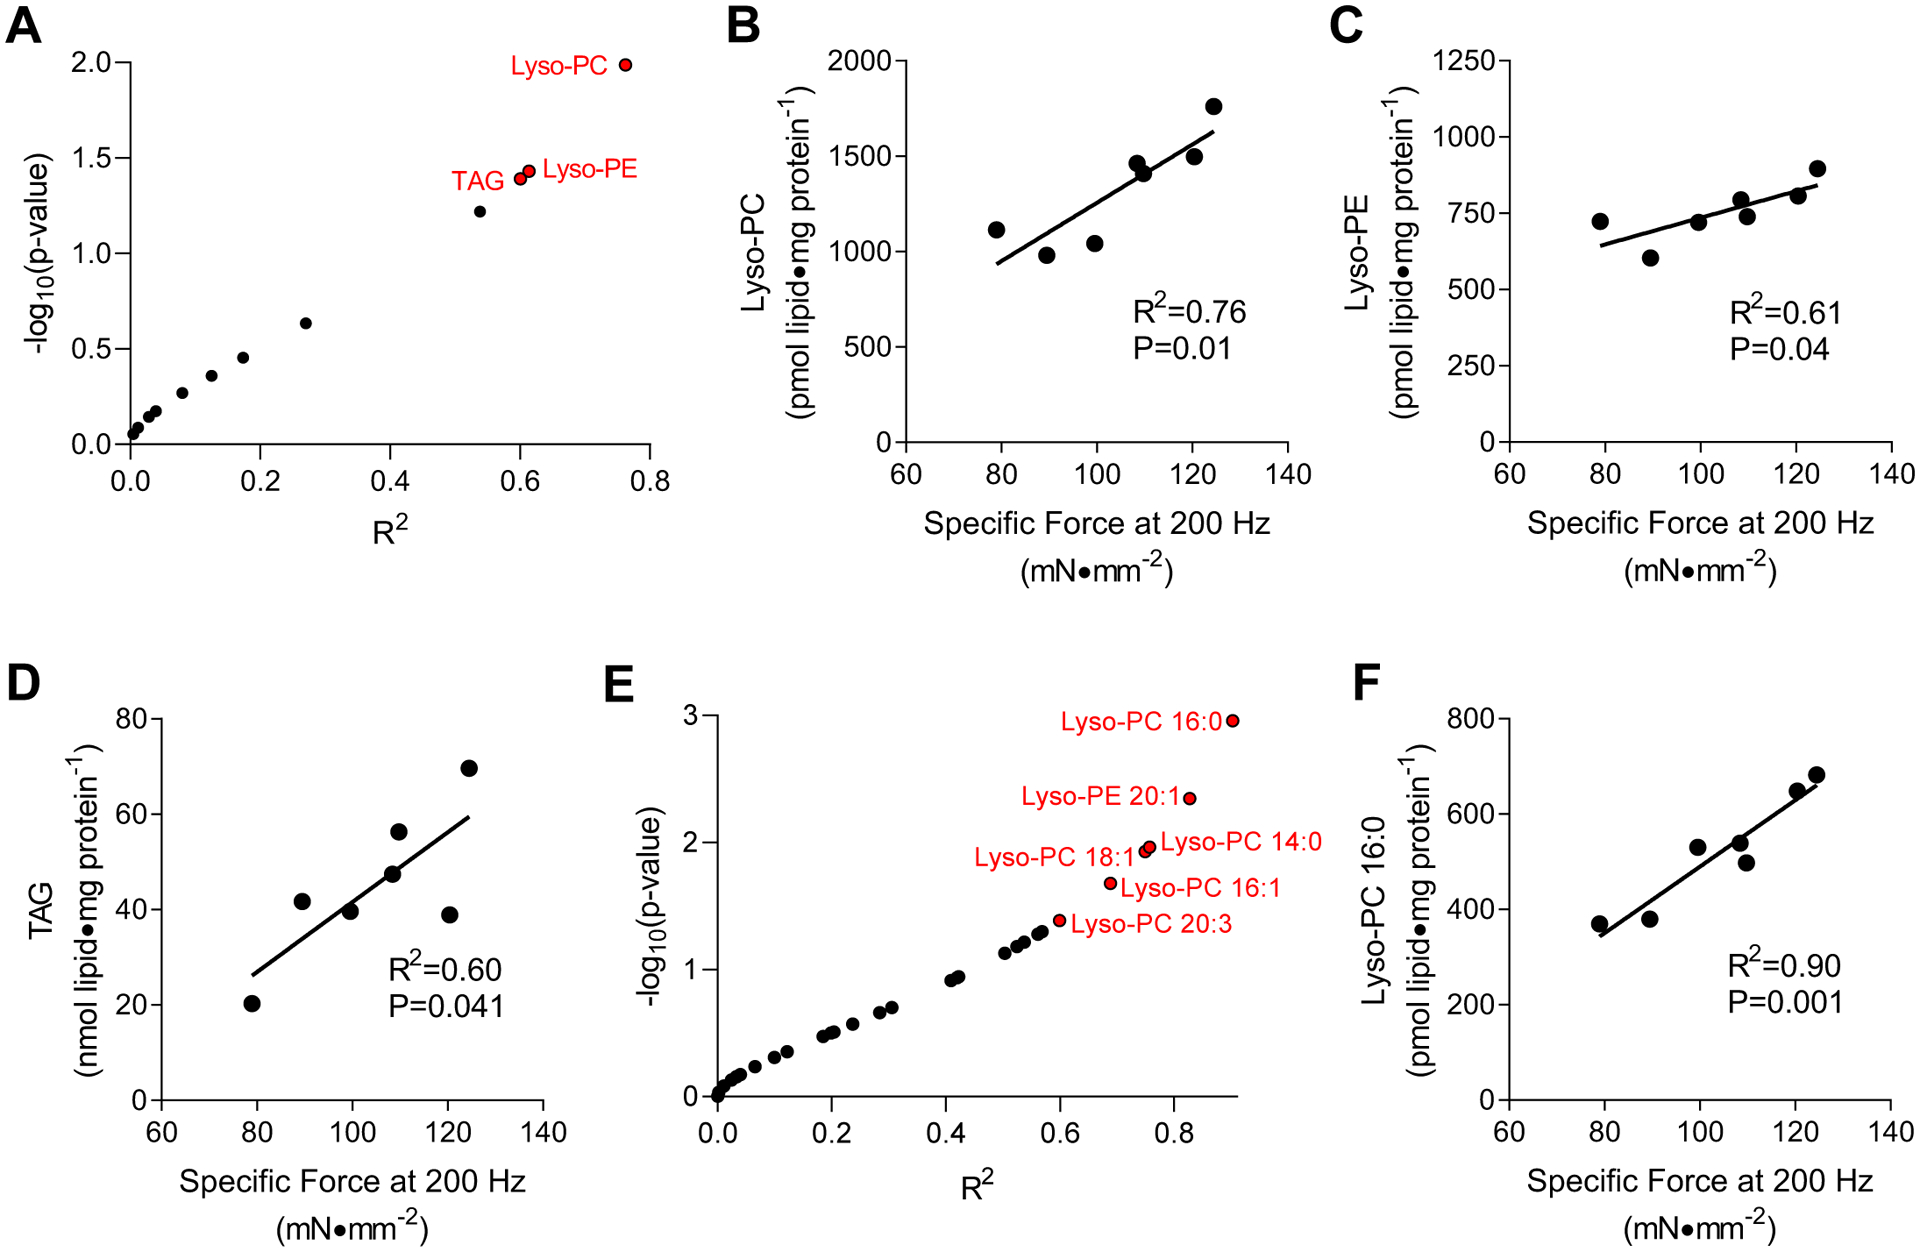
(A-D) Untargeted lipidomics correlated to maximal force production ex vivo. (A) A volcano plot of correlation analyses between muscle lipid classes and forces produced during maximal tetanic contraction. R2 is plotted against −log10p-values. Data points indicated in red are P<0.05. (B-D) Linear regressions for (B) lyso-PC, (C) lyso-PE), and (D) TAG with force production. (E&F) Targeted lipidomic analyses for lyso-PC and lyso-PE species. (E) A volcano plot of correlation analyses between muscle lipid species and forces produced during maximal tetanic contraction. R2 is plotted against −log10p-values. Data points indicated in red are P<0.05. (F) Linear regression for 16:0 lyso-PC content with force production. n=7.
Because untargeted lipidomic analyses on QTOF-MS/MS are not gold-standards for precise quantification, we reanalyzed these samples on the QqQ-MS/MS platform to measure individual lyso-PC and lyso-PE species. Among 32 lyso-PC and lyso-PE species, six species (lyso-PC 16:0, 14:0, 18:1, 16:1, 20:3, lyso-PE 20:1) were significantly correlated with maximal force production (Figure 1E). In particular, 16:0 lyso-PC displayed a remarkable correlation (R2 = 0.90, Figure 1F).
Skeletal muscle-specific overexpression of LPCAT3 lowers lyso-PC and lyso-PE without robustly affecting other classes of lipids.
Lyso-PC and lyso-PE are molecules generated from PC and PE, respectively, by deacylation of a fatty acid at the sn-2 position (23). The levels of skeletal muscle lyso-PC and lyso-PE are primarily regulated by lysophosphatidylcholine acyltransferase 3 (LPCAT3) (14, 27, 28), an enzyme of the Lands cycle (24–26). Indeed, obesity coincides with an increase in muscle LPCAT3 transcript in mice and in humans (14). Mice with tamoxifen-inducible skeletal muscle-specific overexpression of LPCAT3 (LPCAT3-MKI) were generated (14). This strategy successfully yielded mice with increased LPCAT3 transcript and protein in skeletal muscle (Figure 2A, Figure S1A). Body and fat masses were not different between the groups (Figure 2B&C). Phospholipidomic analyses of skeletal muscles from control and LPCAT3-MKI mice were performed. Consistent with the notion that LPCAT3 acylates lyso-PC and lyso-PE, overexpression of LPCAT3 reduced the levels of lyso-PC and lyso-PE in muscles from LPCAT3-MKI mice compared to that of control mice (Figure 2D–F). Abundance of other phospholipids such as PS, PI, PG, CL, PC, and PE were unaffected (Figure 2D), but there were nuanced changes in acyl-chain combination of these lipids as expected from LPCAT3’s preference to utilize polyunsaturated fatty-acids (Figure S1B&C, S2). Quantification of lyso-PC and lyso-PE with their parent phospholipids indicate that reduction in lyso-PC/PC was more robust compared to lyso-PE/PE (Figure 2G&H), consistent with LPCAT3’s greater affinity for lyso-PC compared to lyso-PE.
Figure 2: Skeletal muscle-specific overexpression of LPCAT3 lowers lyso-PC and lyso-PE (standard chow diet).
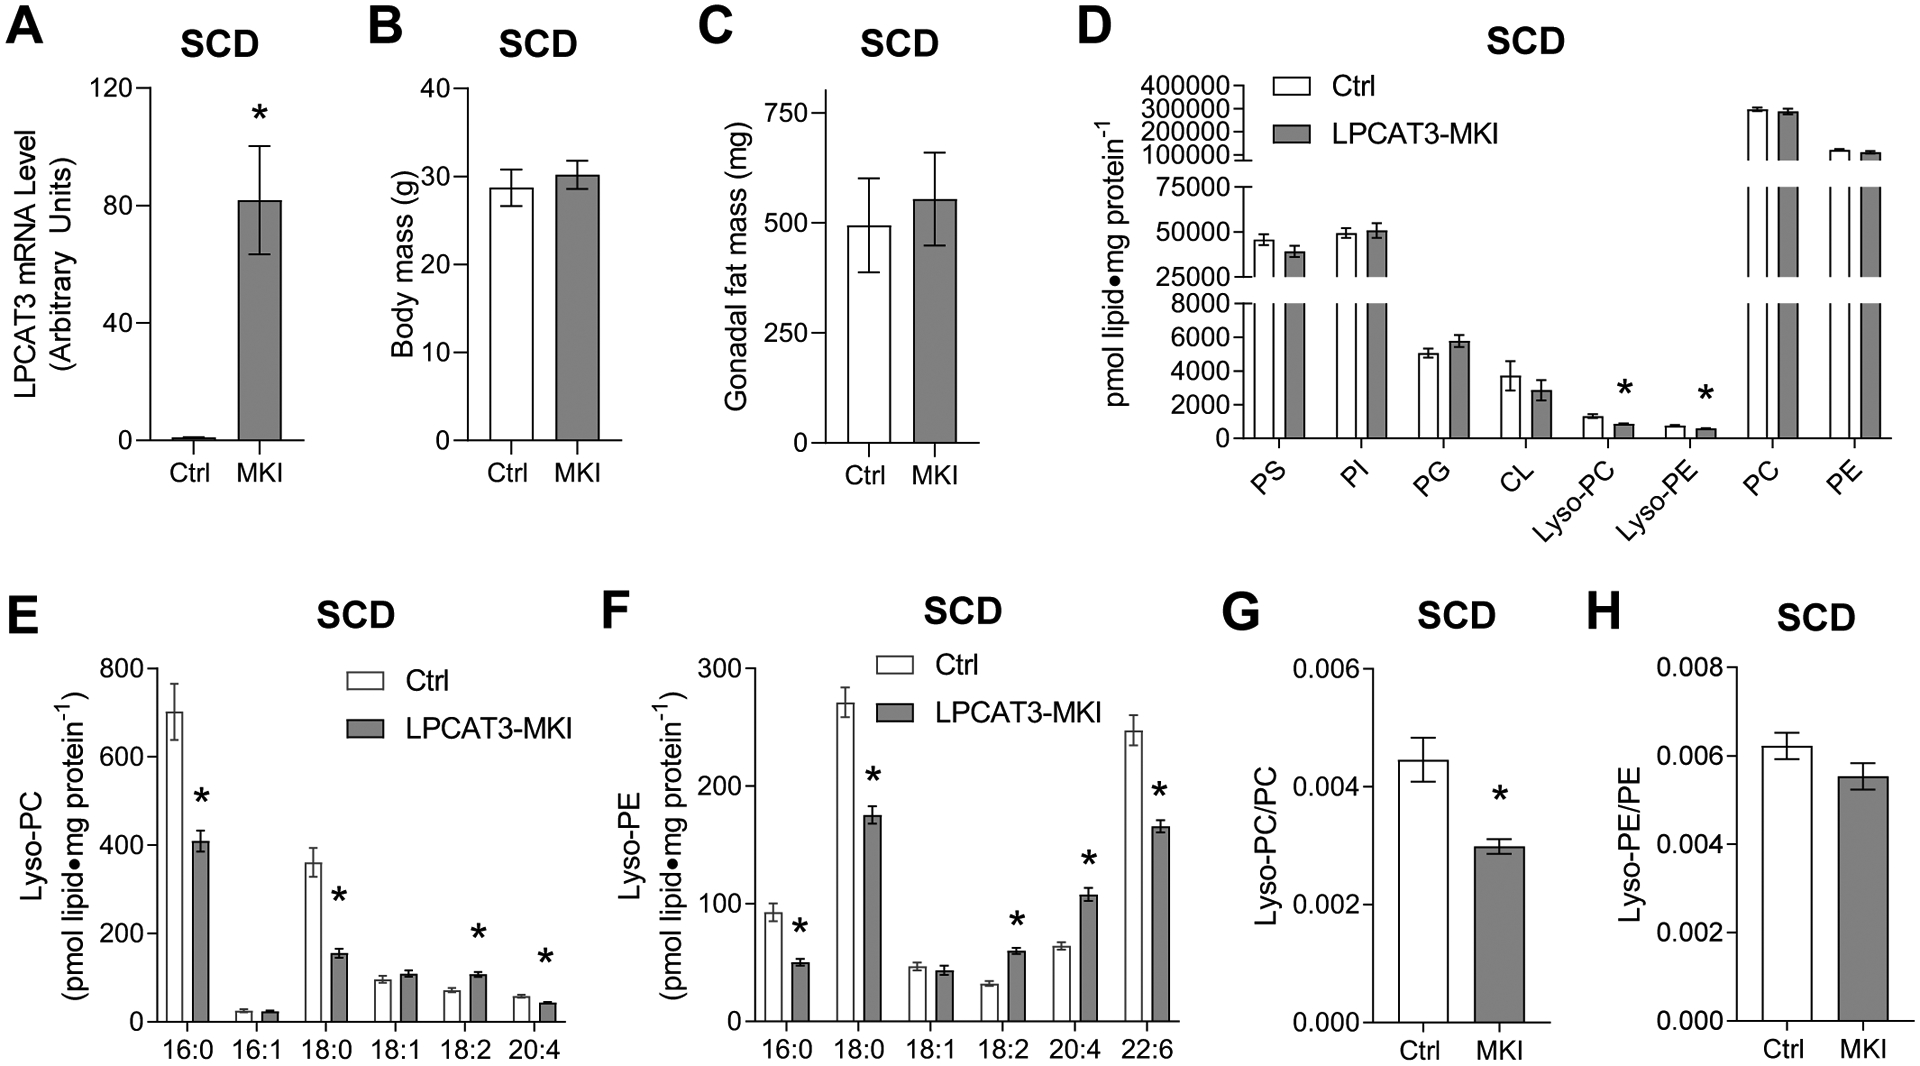
(A) LPCAT3 mRNA level in muscles from control (Ctrl) and LPCAT3-MKI (MKI) mice (D-H) Skeletal muscle phospholipidome. (B) Body mass. (C) Gonadal fat mass. (D) total lipids by class, (E) lyso-PC species, (F) lyso-PE species, (G) lyso-PC/PC ratio, (H) lyso-PE/PE ratio. All data are from mice that were fed standard chow diet. Ctrl: n=7, LPCAT3-MKI: n=12. Two-tailed t-tests or 2-way ANOVA with Sidak’s multiple comparisons tests were performed. All data are mean ± SEM. *P ≤ 0.05.
Skeletal muscles from LPCAT3-MKI mice exhibit mild contractile dysfunction.
Control and LPCAT3-MKI mice were studied in a standard chow diet (SCD)-fed condition. EDL muscles were dissected to characterize force-generating capacity ex vivo. When stimulated by a single pulse to induce a twitch contraction, representative force tracings indicate similar contraction kinetics between control and LPCAT3-MKI mice (Figure 3A), with no differences found in peak force, rate of contraction, and rate of relaxation (Figure 3B&C). Muscles were then stimulated at frequencies ranging from 10–200 Hz to induce tetanic contractions. Representative force tracings after a 200 Hz stimulation indicate some degree of force decrements in LPCAT3-MKI muscles compared to that of control (Figure 3D) that remain present even after normalization to muscle tissue cross-sectional area (Figure 3E). Specific force was similar between control and LPCAT3-MKI between stimulation frequencies of 10–60 Hz, but muscles from LPCAT3-MKI produced significantly lower tetanic force at all stimulation frequencies ≥80 Hz compared to muscles from littermate control mice. Despite this defect in force production at high stimulation frequencies, LPCAT3-MKI muscles exhibited similar contractile sensitivity to stimulation frequency, as measured by IC50 (the frequency needed to elicit a contraction at 50% maximum), compared to that of control mice (Figure 3F).
Figure 3: LPCAT3-MKI mice exhibit mild contractile dysfunction when fed a standard chow diet.
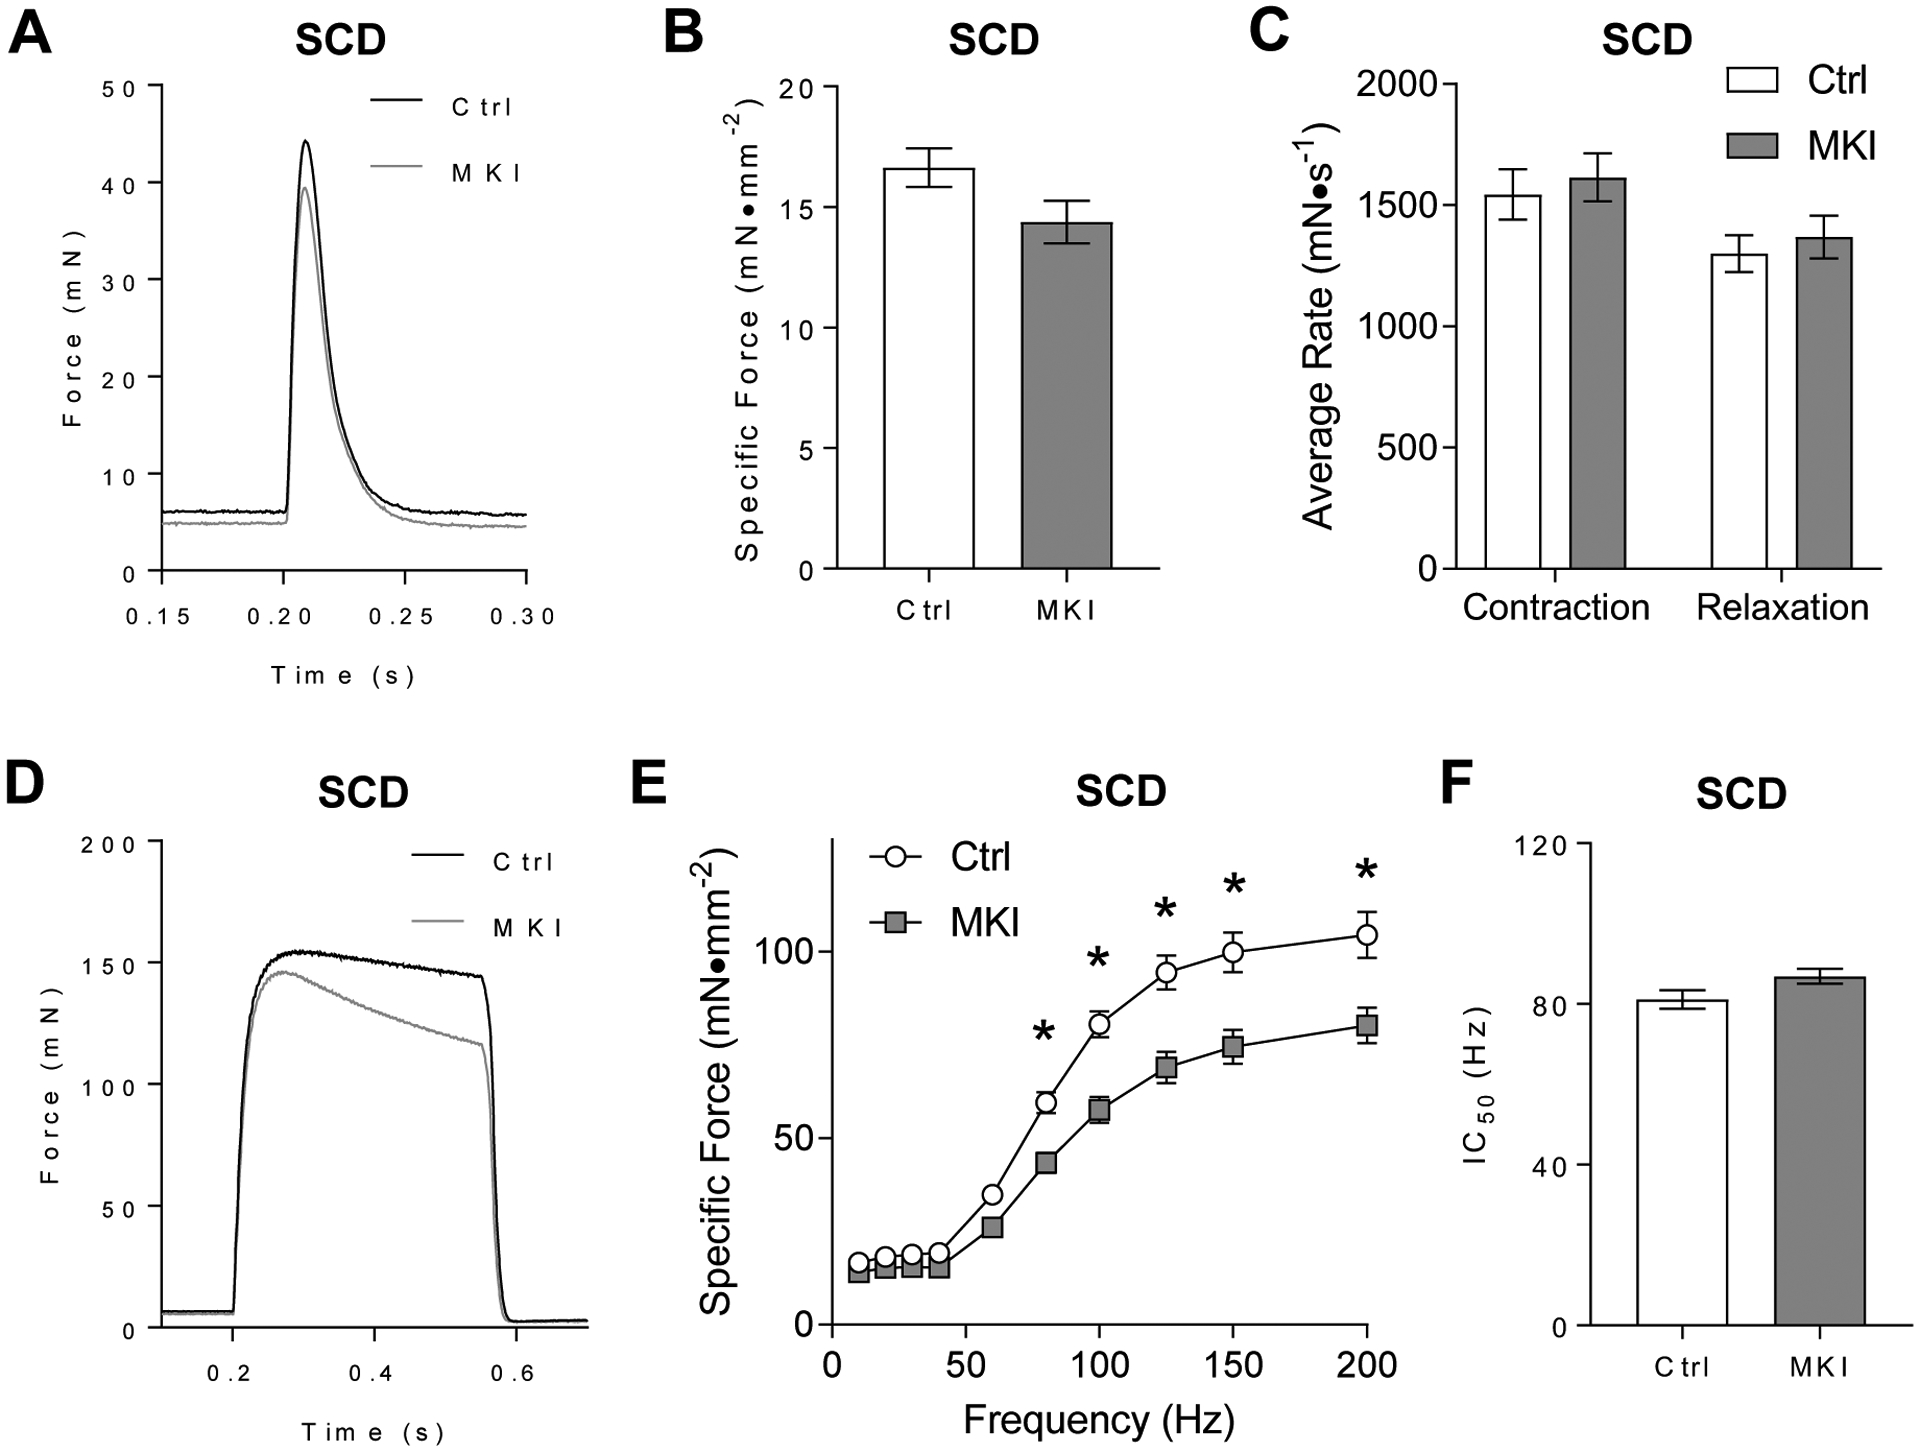
Extensor digitorum longus (EDL) muscles of control (Ctrl) and LPCAT3-MKI (MKI) mice were dissected for the analysis of ex vivo force production after (A-C) a single-pulse stimulation to initiate a twitch contraction or (D-F) across a range of stimulation frequencies (10–200 Hz) to generate a force-frequency curve. (A) Force tracings of EDL muscles after a single pulse stimulation in Ctrl and LPCAT3-MKI mice. (B) Force normalized to muscle cross-sectional area (specific force). (C) The average rate of contraction and average rate of relaxation between Ctrl and LPCAT3-MKI EDL muscles. (D) Force tracings of EDL muscles after a 200 Hz stimulation between Ctrl and LPCAT3-MKI mice. (E) Specific force of EDL muscles across a range of stimulation frequencies in Ctrl and LPCAT3-MKI mice (main effect of genotype, P=0.0014). (F) The frequency needed to illicit 50% maximal contraction of EDL muscles from Ctrl and LPCAT3-MKI mice. All data are from mice that were fed standard chow diet. Ctrl: n=7, LPCAT3-MKI: n=12. Two-tailed t-tests or 2-way ANOVA with Sidak’s multiple comparisons tests were performed. All data are mean ± SEM. *P ≤ 0.05 for specific time-points.
Overexpression of muscle LPCAT3 selectively reduces lyso-PC in HFD-fed mice.
High-fat diet (HFD) feeding promotes obesity and diabetes, reduces skeletal muscle lyso-PC and lyso-PE, and induces diabetic myopathy. Thus, control and LPCAT3-MKI mice were studied after 8 wks of HFD feeding. Body and fat masses were not different between the groups (Figure 4A&B). Targeted lipid mass spectrometry was performed to quantify lyso-PC and lyso-PE with their parent phospholipids. Total lyso-PC was lower in muscles from LPCAT3-MKI mice compared to that of control (Figure 4C&D). With no difference in the abundance of PC (Figure 4C, Figure S3A), lyso-PC/PC was lower in LPCAT3-MKI mice compared to that of control (Figure 4E). Unexpectedly, lyso-PE content was greater in muscles from LPCAT3-MKI mice compared to that of control (Figure 4C&F). With no change in the abundance of PE (Figure 4C, Figure S3B), lyso-PE/PE was greater, not lower, in LPCAT3-MKI mice compared to that of control (Figure 4G). Similar to the SCD-fed condition, there were nuanced changes in acyl-chain combinations of these lipids.
Figure 4: Low lyso-PC, but not lyso-PE, in muscles of LPCAT3-MKI compared to control mice (high-fat diet).
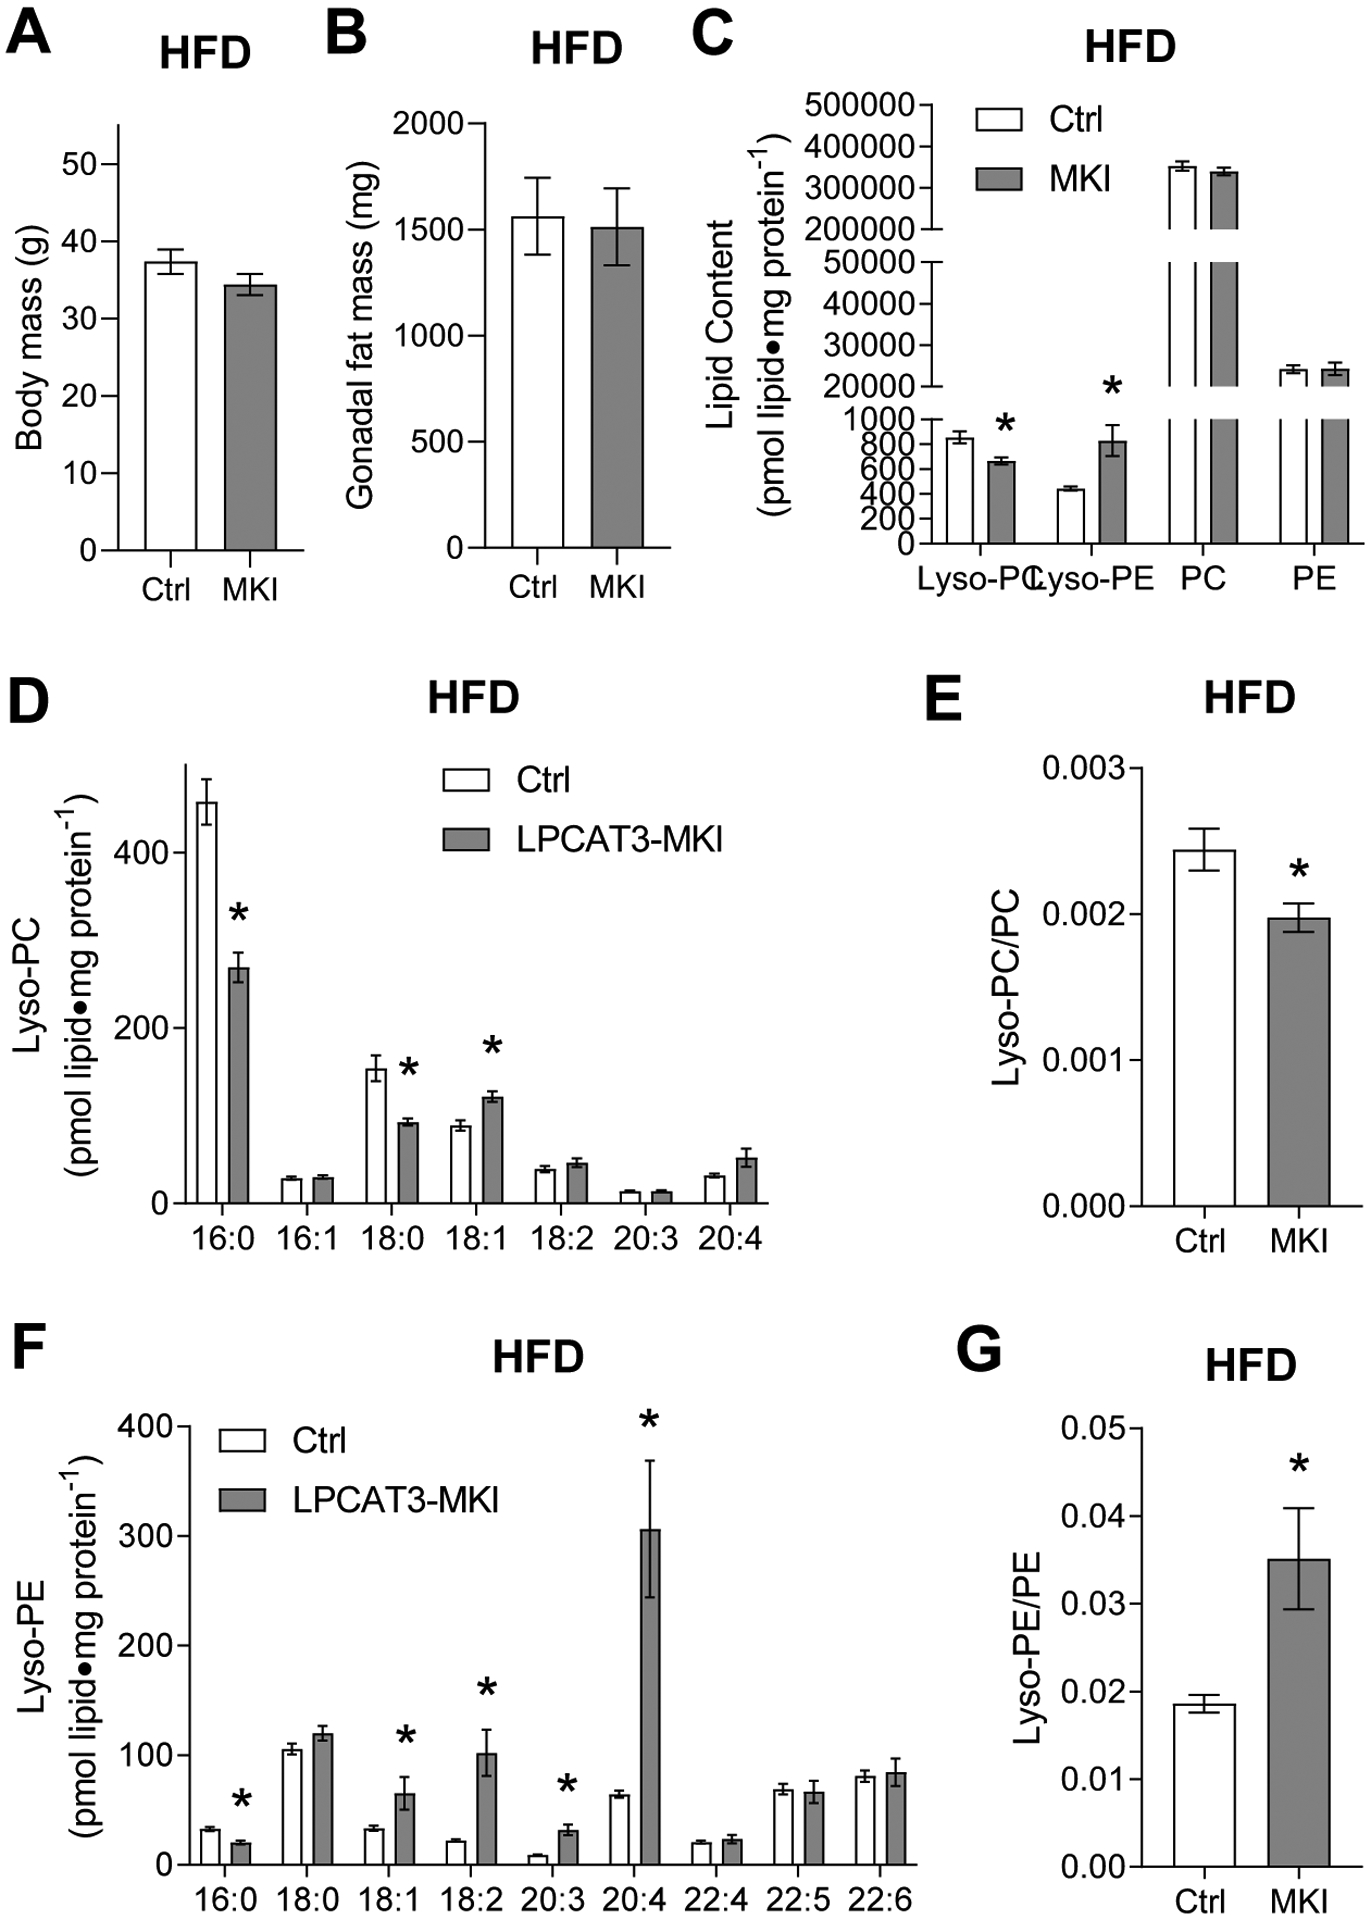
(A) Body mass. (B) Gonadal fat mass. (C) Total lipids by class, (D) lyso-PC species, (E) lyso-PC/PC ratio, (F) lyso-PE species, and (G) lyso-PE/PE ratio. All data are from mice that were fed high-fat diet. Ctrl: control, MKI: LPCAT3-MKI. n=11/group. Two-tailed t-tests or 2-way ANOVA with Sidak’s multiple comparisons tests were performed. All data are mean ± SEM. *P ≤ 0.05.
High-fat feeding induces dramatic myopathy in LPCAT3-MKI mice.
EDL muscles from HFD-fed control and LPCAT3-MKI mice were used for the analyses of skeletal muscle force-generating capacity ex vivo. Unlike in the SCD-fed condition, twitch peak force was significantly lower in LPCAT3-MKI mice compared to that of control (Figure 5A&B), with lower rates for contraction and relaxation (Figure 5C). Similarly, force produced by tetanic stimulation was substantially lower in LPCAT3-MKI mice compared to that of control mice (Figure 5D&E), while the stimulation frequency needed to elicit a 50% max (IC50) was greater in LPCAT3-MKI mice compared to that of control mice (Figure 5F). The magnitude of decrease in tetanic force production induced by LPCAT3 overexpression was more than 2-fold greater in HFD-fed condition compared to SCD-fed condition.
Figure 5: LPCAT3-MKI mice exhibit a more dramatic contractile defect after high-fat diet feeding.
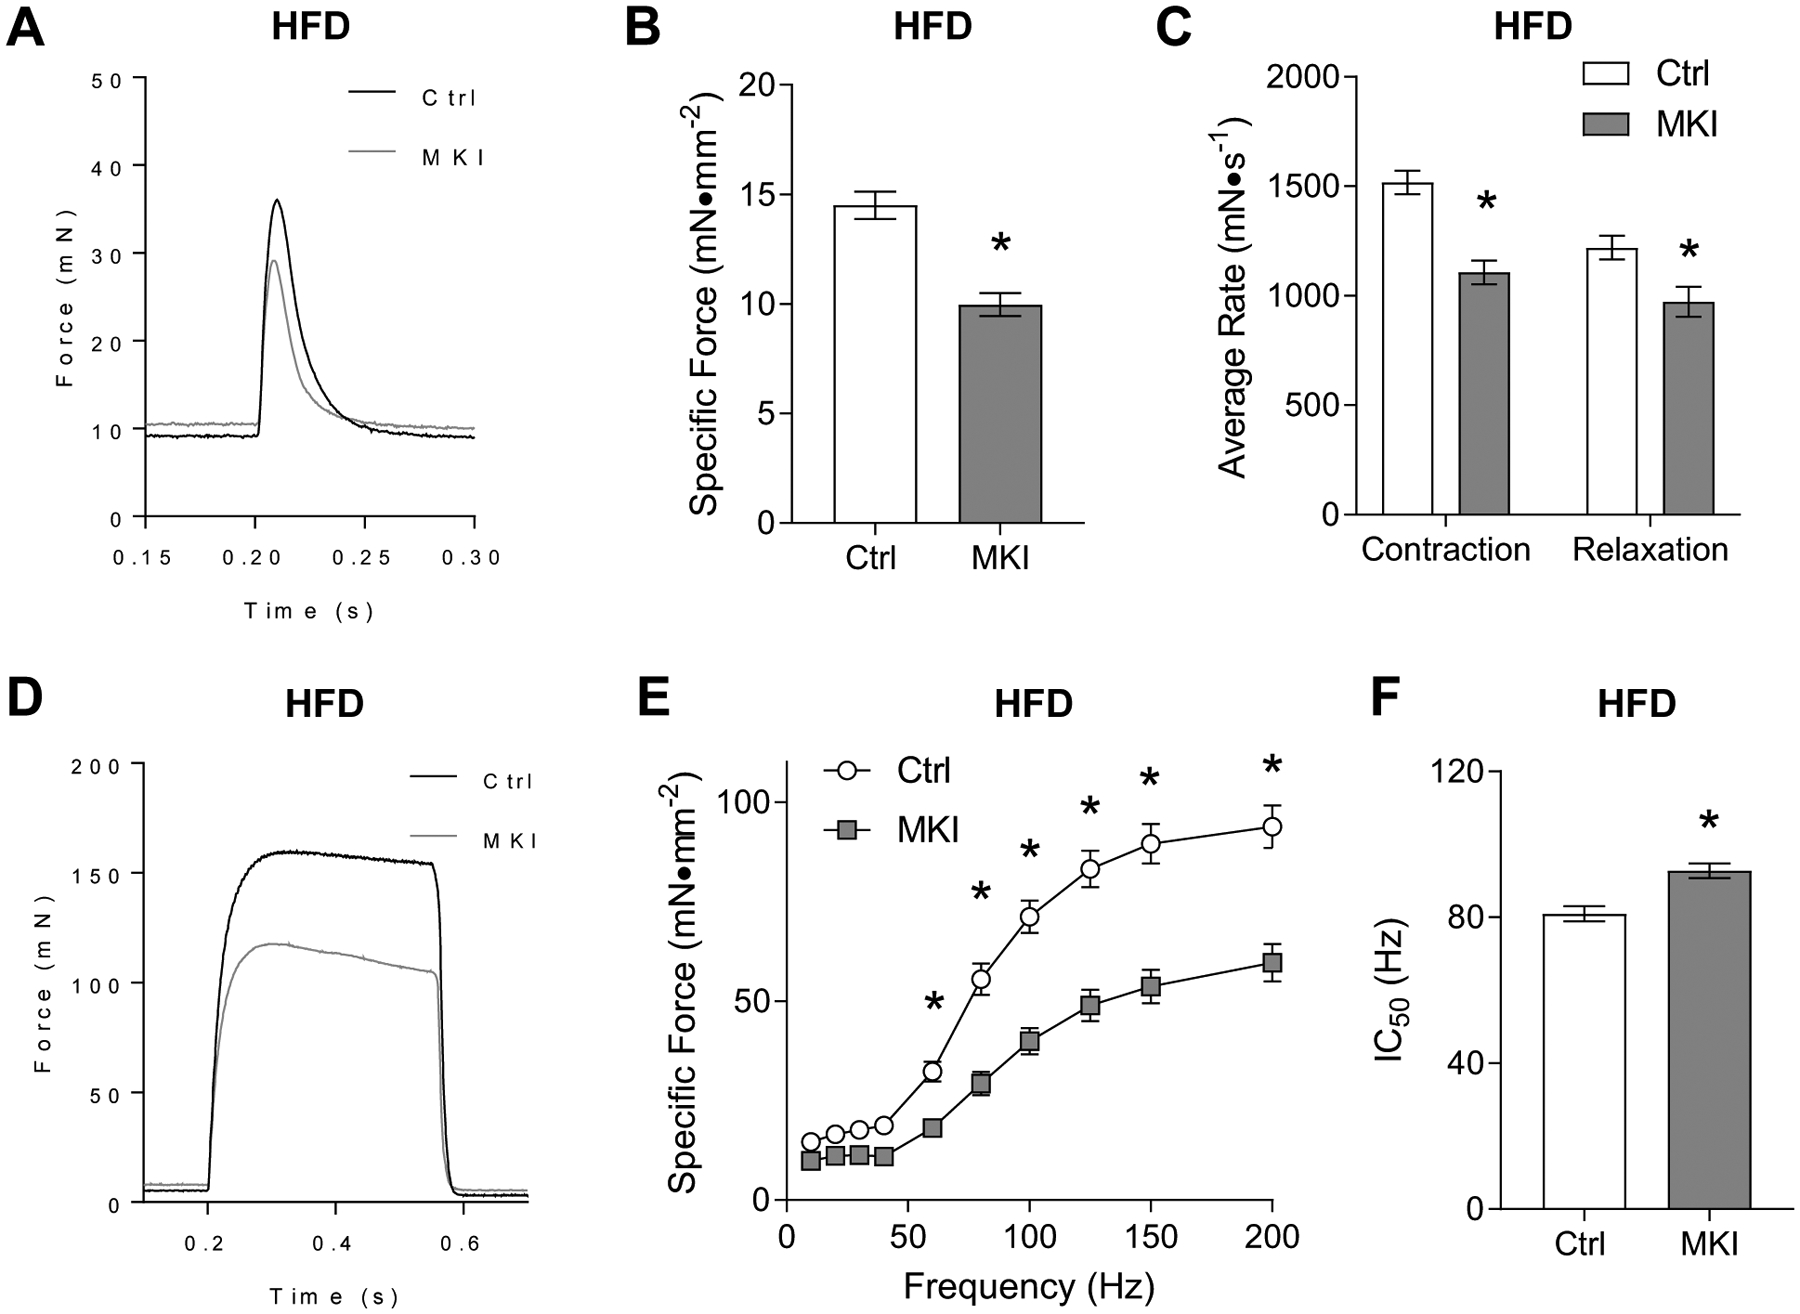
EDL muscles of control (Ctrl) and LPCAT3-MKI (MKI) mice were dissected for the analysis of ex vivo force production after (A-C) a single-pulse stimulation to initiate a twitch contraction or (D-F) across a range of stimulation frequencies (10–200 Hz) to generate a force-frequency curve. (A) Force tracings of EDL muscles after a single pulse stimulation in Ctrl and LPCAT3 MKI mice. (B) Force normalized to muscle cross-sectional area (specific force). (C) The average rate of contraction and average rate of relaxation between Ctrl and LPCAT3-MKI EDL muscles. (D) Force tracings of EDL muscles after a 200 Hz stimulation between Ctrl and LPCAT3-MKI mice. (E) Specific force of EDL muscles across a range of stimulation frequencies in Ctrl and LPCAT3-MKI mice (main effect of genotype, P=0.0003). (F) The frequency needed to illicit 50% maximal contraction of EDL muscles from Ctrl and LPCAT3-MKI mice. All data are from mice that were fed high-fat diet. Ctrl: n=5, LPCAT3-MKI: n=9. Two-tailed t-tests or 2-way ANOVA with Sidak’s multiple comparisons tests were performed. All data are mean ± SEM. *P ≤ 0.05.
LPCAT3 overexpression promotes fiber-type switch and selectively reduces the cross-sectional area of type IIa and IIx fibers.
Tibialis anterior (TA) muscles from control and LPCAT3-MKI mice were sectioned and fiber-typed. Consistent with previous studies, TA exclusively expressed myosin heavy chain IIa, IIx, and IIb, without expressing MHC I (Figure 6A). LPCAT3 overexpression promoted a robust shift in myosin heavy chain isoform composition, with greater fibers expressing IIx and IIb at the expense of IIa (Figure 6B). There was a main effect of LPCAT3 overexpression to reduce fiber CSA, observed primarily in fibers with IIa and IIx expression (Figure 6C). Paradoxically, these observations coincided with increases in muscle masses (Figure 6D), that is likely explained by increased water weight suggesting edema (Figure 6E). Sirius red staining suggested no sign of muscle fibrosis with LPCAT3 overexpression (Figure 6F).
Figure 6: Skeletal muscle fiber-type and cross-sectional area in control and LPCAT3-MKI mice.
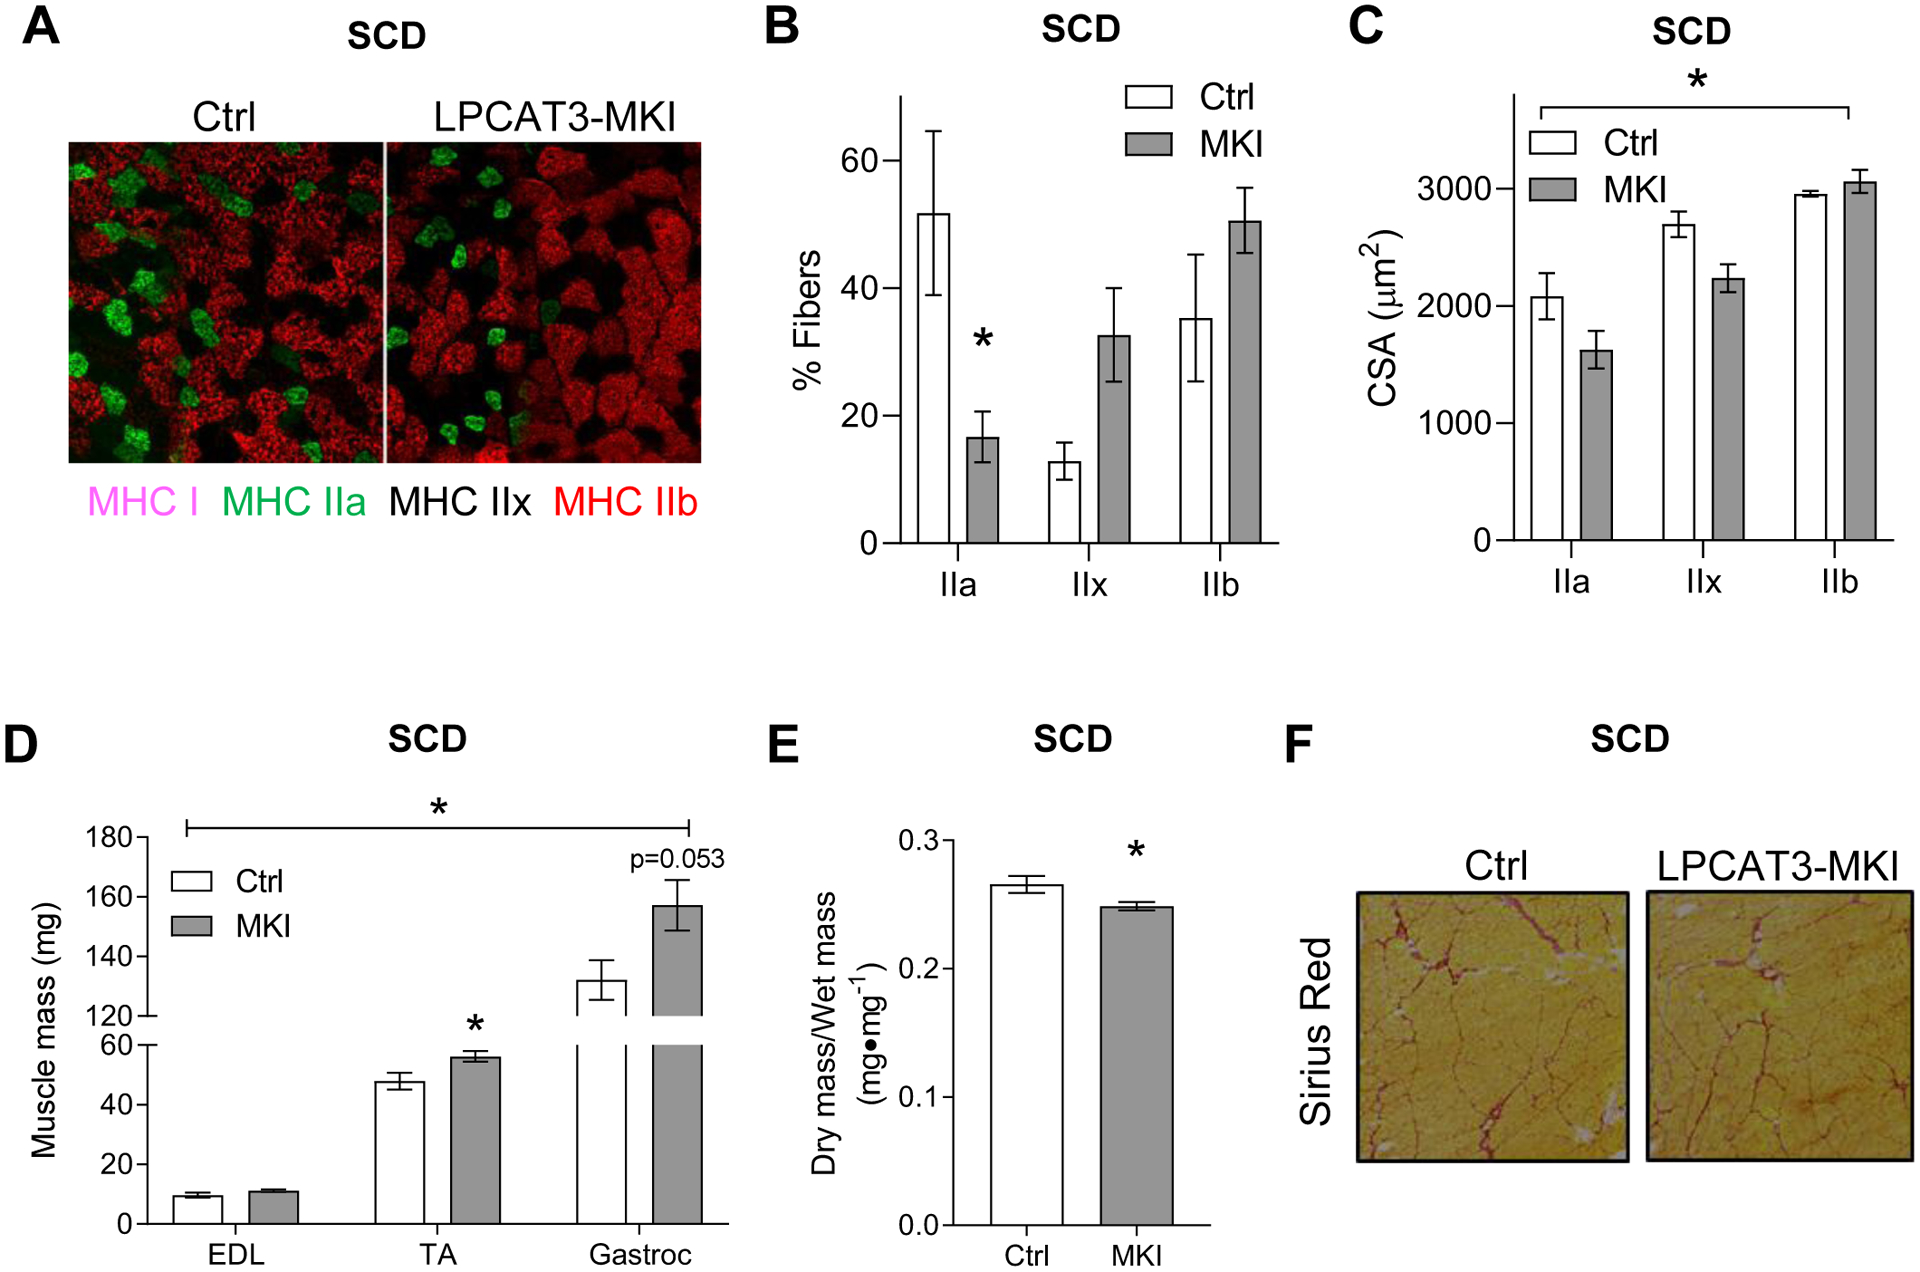
(A) Representative images of myosin-heavy chain immunofluorescence of TA muscle (MHC I: pink, MHC IIa: green, MHC IIb: red, and MHC IIx: negative). (B) Relative abundance of fibers expressing MHC IIa, IIx, and IIb. (C) Mean CSA stratified according to their MHC expression. n=3/group. (D) Mass of extensor digitorum longus (EDL), tibialis anterior (TA), and gastrocnemius (Gastroc) muscles (Ctrl n=4, LPCAT3-MKI n=4) (E) The ratio of dry/wet weight in gastrocnemius muscles of Ctrl and LPCAT3-MKI mice (Ctrl n=6, LPCAT3-MKI n=9). (F) Representative images of Picrosirius red staining of TA muscle. All data are from mice that were fed standard chow diet. Two-tailed t-tests or 2-way ANOVA with Sidak’s multiple comparisons tests were performed. All data are mean ± SEM. *P ≤ 0.05.
4. Discussion:
Obesity promotes skeletal muscle contractile dysfunction (8, 31) but the mechanisms driving this defect are incompletely understood. Altered skeletal muscle lipid metabolism has been implicated (32, 33), as lipids may be involved in pathogenesis of other forms of myopathy including muscular dystrophy (6, 15, 34). In wildtype C57BL6 mice, levels of muscle lyso-PC, lyso-PE, and TAG content all positively correlated with force-generating capacity. Among these, TAG was an unlikely candidate, as it is well documented that muscle TAG increases, not decreases, with obesity (12, 13, 18). Meanwhile, lysophospholipids are known to become downregulated with obesity (14), consistent with the positive correlations between these molecules to muscle strength. In particular, 16:0 lyso-PC exhibited a remarkable association to the force-generating capacity. To our knowledge, the relationship between muscle lysophospholipids and contractile function has never been reported. Thus, the premise of the current study was to examine whether low muscle lysophospholipids, specifically lyso-PC, would be sufficient to promote myopathy. Indeed, low lyso-PC (including 16:0 lyso-PC) induced by muscle-specific overexpression of LPCAT3 was sufficient to modestly attenuate tetanic force production ex vivo (20% reduction) with no other apparent defects in the contractile kinetics in SCD-fed condition. It is noteworthy that LPCAT3 overexpression lowered muscle lyso-PC by a similar magnitude (50% reduction) that occurs with obesity (14).
Susceptibility to HFD-induced myopathy were further studied in the LPCAT3-MKI mice. Strikingly, overexpression of LPCAT3 promoted a dramatic loss in skeletal muscle contractile activity, characterized by ~40% loss in force-generating capacity that coincided with reduced twitch force, decreased rates of contraction and relaxation, and increased IC50. These findings indicate that low skeletal muscle lyso-PC makes mice more prone to obesity-induced myopathy.
What is the mechanism by which low muscle lyso-PC promotes weakness? Analyses of skeletal muscle fiber-type indicate that overexpression of LPCAT3 promotes a shift in myosin heavy chain isoforms from IIa to IIx/IIb, similarly to muscle weakness that occurs after spaceflight (35, 36). This is somewhat paradoxical considering that maximal force output is higher in IIx/IIb isoforms compared to IIa (37, 38). Similarly, shortening velocity is higher in IIb compared to IIa/IIx (39) even though it was reduced with LPCAT3 overexpression. Taken together, the switch in skeletal muscle fiber-type observed with LPCAT3 overexpression cannot in itself explain muscle weakness. In contrast, CSA of muscle fibers were drastically reduced with LPCAT3 overexpression in IIa and IIx fibers. These observations are more likely to be responsible for the loss of force-generating capacity induced by LPCAT3 overexpression. In addition, LPCAT3 appears to induce skeletal muscle edema, an observation that may be a sign of injury and is associated with myopathies (40). Injury can likely be ruled out based on the lack of skeletal muscle fibrosis in LPCAT3-MKI mice vs. control mice. It is also important to acknowledge that these cross-sectional analyses were performed in TA, whereas force measurements were performed in EDL.
In conclusion, the current study provides evidence that diet-induced reductions in lysophospholipids, specifically lyso-PC, may promote the loss in skeletal muscle force-generating capacity induced by obesity and/or diabetes. The findings are highlighted by a remarkable correlation between 16:0 lyso-PC with maximal force, as well as a robust reduction in strength observed in LPCAT3-MKI mice. Future studies will further investigate the mechanism by which lyso-PC control fiber CSA, potentially by affecting muscle protein turnover.
Supplementary Material
5. Acknowledgements:
This work was supported by NIH grants DK107397, DK109888, AG063077 (to K.F.), AG050781 (to M.J.D.), HL125695 (to J.M.M.), American Heart Association 18PRE33960491 (to A.R.P.V.), American Heart Association 19PRE34380991 (to J.M.J.), a pilot grant from University of Utah Center on Aging (to K.F. and M.J.D.), and the Larry H. and Gail Miller Family Foundation (to P.J.F). The University of Utah Metabolomics, Mass Spectrometry, and Proteomics core is supported by S10 OD016232, S10 OD021505, and U54 DK110858.
Nonstandard Abbreviations:
- CL
Cardiolipin
- DAG
Diacylglycerol
- EDL
Extensor digitorum longus
- HFD
High-fat diet
- Lyso-PC
Lysophosphatidylcholine
- Lyso-PE
Lysophosphatidylethanolamine
- LPCAT3
Lysophosphatidylcholine acyltransferase 3
- MKI
Muscle-specific knock-in
- MS/MS
Tandem mass spectrometry
- PC
Phosphatidylcholine
- PE
Phosphatidylethanolamine
- PG
Phosphatidylglycerol
- PI
Phosphatidylinositol
- PS
Phosphatidylserine
- PL
Phospholipid
- QqQ
Triple-quadrupole
- QTOF
Quadrupole time-of-flight
- SCD
Standard chow diet
- TA
Tibialis anterior
- TAG
Triacylglycerol
Footnotes
Conflict of Interest: The authors have no conflict of interest to disclose.
References
- 1.Martignoni ME, Kunze P, and Friess H (2003) Cancer cachexia. Mol Cancer 2, 36. [DOI] [PMC free article] [PubMed] [Google Scholar]
- 2.Aversa Z, Zhang X, Fielding RA, Lanza I, and LeBrasseur NK (2019) The clinical impact and biological mechanisms of skeletal muscle aging. Bone 127, 26–36 [DOI] [PMC free article] [PubMed] [Google Scholar]
- 3.Powers SK, Kavazis AN, and DeRuisseau KC (2005) Mechanisms of disuse muscle atrophy: role of oxidative stress. Am J Physiol Regul Integr Comp Physiol 288, R337–344 [DOI] [PubMed] [Google Scholar]
- 4.Vincent AE, Ng YS, White K, Davey T, Mannella C, Falkous G, Feeney C, Schaefer AM, McFarland R, Gorman GS, Taylor RW, Turnbull DM, and Picard M (2016) The Spectrum of Mitochondrial Ultrastructural Defects in Mitochondrial Myopathy. Sci Rep 6, 30610. [DOI] [PMC free article] [PubMed] [Google Scholar]
- 5.Eshima H, Siripoksup P, Mahmassani ZS, Johnson JM, Ferrara PJ, Verkerke ARP, Salcedo A, Drummond MJ, and Funai K (2020) Neutralizing mitochondrial ROS does not rescue muscle atrophy induced by hindlimb unloading in female mice. J Appl Physiol (1985) 129, 124–132 [DOI] [PMC free article] [PubMed] [Google Scholar]
- 6.Paran CW, Zou K, Ferrara PJ, Song H, Turk J, and Funai K (2015) Lipogenesis mitigates dysregulated sarcoplasmic reticulum calcium uptake in muscular dystrophy. Biochim Biophys Acta 1851, 1530–1538 [DOI] [PMC free article] [PubMed] [Google Scholar]
- 7.Johnson JM, Ferrara PJ, Verkerke ARP, Coleman CB, Wentzler EJ, Neufer PD, Kew KA, de Castro Bras LE, and Funai K (2018) Targeted overexpression of catalase to mitochondria does not prevent cardioskeletal myopathy in Barth syndrome. J Mol Cell Cardiol 121, 94–102 [DOI] [PMC free article] [PubMed] [Google Scholar]
- 8.D’Souza DM, Al-Sajee D, and Hawke TJ (2013) Diabetic myopathy: impact of diabetes mellitus on skeletal muscle progenitor cells. Front Physiol 4, 379. [DOI] [PMC free article] [PubMed] [Google Scholar]
- 9.Eshima H, Tamura Y, Kakehi S, Kakigi R, Hashimoto R, Funai K, Kawamori R, and Watada H (2020) A chronic high-fat diet exacerbates contractile dysfunction with impaired intracellular Ca(2+) release capacity in the skeletal muscle of aged mice. J Appl Physiol (1985) 128, 1153–1162 [DOI] [PMC free article] [PubMed] [Google Scholar]
- 10.Kell RT, Bell G, and Quinney A (2001) Musculoskeletal fitness, health outcomes and quality of life. Sports Med 31, 863–873 [DOI] [PubMed] [Google Scholar]
- 11.Rizzoli R, Reginster JY, Arnal JF, Bautmans I, Beaudart C, Bischoff-Ferrari H, Biver E, Boonen S, Brandi ML, Chines A, Cooper C, Epstein S, Fielding RA, Goodpaster B, Kanis JA, Kaufman JM, Laslop A, Malafarina V, Manas LR, Mitlak BH, Oreffo RO, Petermans J, Reid K, Rolland Y, Sayer AA, Tsouderos Y, Visser M, and Bruyere O (2013) Quality of life in sarcopenia and frailty. Calcif Tissue Int 93, 101–120 [DOI] [PMC free article] [PubMed] [Google Scholar]
- 12.Kelley DE, and Goodpaster BH (2001) Skeletal muscle triglyceride. An aspect of regional adiposity and insulin resistance. Diabetes Care 24, 933–941 [DOI] [PubMed] [Google Scholar]
- 13.Funai K, and Semenkovich CF (2011) Skeletal muscle lipid flux: running water carries no poison. Am J Physiol Endocrinol Metab 301, E245–251 [DOI] [PMC free article] [PubMed] [Google Scholar]
- 14.Ferrara PJ, Rong X, Maschek JA, Verkerke AR, Siripoksup P, Song H, Green TD, Krishnan KC, Johnson JM, Turk J, Houmard JA, Lusis AJ, Drummond MJ, McClung JM, Cox JE, Shaikh SR, Tontonoz P, Holland WL, and Funai K (2021) Lysophospholipid acylation modulates plasma membrane lipid organization and insulin sensitivity in skeletal muscle. J Clin Invest 131 [DOI] [PMC free article] [PubMed] [Google Scholar]
- 15.Senoo N, Miyoshi N, Kobayashi E, Morita A, Tanihata J, Takeda S, and Miura S (2020) Glycerophospholipid profile alterations are associated with murine muscle-wasting phenotype. Muscle Nerve 62, 413–418 [DOI] [PubMed] [Google Scholar]
- 16.Hinkley JM, Cornnell HH, Standley RA, Chen EY, Narain NR, Greenwood BP, Bussberg V, Tolstikov VV, Kiebish MA, Yi F, Vega RB, Goodpaster BH, and Coen PM (2020) Older adults with sarcopenia have distinct skeletal muscle phosphodiester, phosphocreatine, and phospholipid profiles. Aging Cell 19, e13135. [DOI] [PMC free article] [PubMed] [Google Scholar]
- 17.Funai K, Song H, Yin L, Lodhi IJ, Wei X, Yoshino J, Coleman T, and Semenkovich CF (2013) Muscle lipogenesis balances insulin sensitivity and strength through calcium signaling. J Clin Invest 123, 1229–1240 [DOI] [PMC free article] [PubMed] [Google Scholar]
- 18.Verkerke ARP, Ferrara PJ, Lin C-T, Johnson JM, Ryan TE, Maschek JA, Eshima H, Paran CW, Laing BT, Siripoksup P, Tippetts TS, Wentzler EJ, Huang H, Spangenburg EE, Brault JJ, Villanueva CJ, Summers SA, Holland WL, Cox JE, Vance DE, Neufer PD, and Funai K (2019) Phospholipid methylation regulates muscle metabolic rate through Ca2+ transport efficiency. Nature Metabolism 1, 876–885 [DOI] [PMC free article] [PubMed] [Google Scholar]
- 19.Heden TD, Johnson JM, Ferrara PJ, Eshima H, Verkerke ARP, Wentzler EJ, Siripoksup P, Narowski TM, Coleman CB, Lin CT, Ryan TE, Reidy PT, de Castro Bras LE, Karner CM, Burant CF, Maschek JA, Cox JE, Mashek DG, Kardon G, Boudina S, Zeczycki TN, Rutter J, Shaikh SR, Vance JE, Drummond MJ, Neufer PD, and Funai K (2019) Mitochondrial PE potentiates respiratory enzymes to amplify skeletal muscle aerobic capacity. Sci Adv 5, eaax8352. [DOI] [PMC free article] [PubMed] [Google Scholar]
- 20.Rashid T, Nemazanyy I, Paolini C, Tatsuta T, Crespin P, de Villeneuve D, Brodesser S, Benit P, Rustin P, Baraibar MA, Agbulut O, Olivier A, Protasi F, Langer T, Chrast R, de Lonlay P, de Foucauld H, Blaauw B, and Pende M (2019) Lipin1 deficiency causes sarcoplasmic reticulum stress and chaperone-responsive myopathy. EMBO J 38 [DOI] [PMC free article] [PubMed] [Google Scholar]
- 21.Schweitzer GG, Collier SL, Chen Z, McCommis KS, Pittman SK, Yoshino J, Matkovich SJ, Hsu FF, Chrast R, Eaton JM, Harris TE, Weihl CC, and Finck BN (2019) Loss of lipin 1-mediated phosphatidic acid phosphohydrolase activity in muscle leads to skeletal myopathy in mice. FASEB J 33, 652–667 [DOI] [PMC free article] [PubMed] [Google Scholar]
- 22.Funai K, Lodhi IJ, Spears LD, Yin L, Song H, Klein S, and Semenkovich CF (2016) Skeletal Muscle Phospholipid Metabolism Regulates Insulin Sensitivity and Contractile Function. Diabetes 65, 358–370 [DOI] [PMC free article] [PubMed] [Google Scholar]
- 23.Vance DE, and Vance JE (2008) Biochemistry of Lipids, Lipoproteins, and Membranes, Elsevier [Google Scholar]
- 24.Lands WE (1958) Metabolism of glycerolipides; a comparison of lecithin and triglyceride synthesis. J Biol Chem 231, 883–888 [PubMed] [Google Scholar]
- 25.Shindou H, Hishikawa D, Harayama T, Eto M, and Shimizu T (2013) Generation of membrane diversity by lysophospholipid acyltransferases. J Biochem 154, 21–28 [DOI] [PubMed] [Google Scholar]
- 26.Shindou H, and Shimizu T (2009) Acyl-CoA:lysophospholipid acyltransferases. J Biol Chem 284, 1–5 [DOI] [PubMed] [Google Scholar]
- 27.Eto M, Shindou H, Koeberle A, Harayama T, Yanagida K, and Shimizu T (2012) Lysophosphatidylcholine acyltransferase 3 is the key enzyme for incorporating arachidonic acid into glycerophospholipids during adipocyte differentiation. Int J Mol Sci 13, 16267–16280 [DOI] [PMC free article] [PubMed] [Google Scholar]
- 28.Martin SA, Gijon MA, Voelker DR, and Murphy RC (2014) Measurement of lysophospholipid acyltransferase activities using substrate competition. J Lipid Res 55, 782–791 [DOI] [PMC free article] [PubMed] [Google Scholar]
- 29.Ferrara PJ, Verkerke ARP, Brault JJ, and Funai K (2018) Hypothermia Decreases O2 Cost for Ex Vivo Contraction in Mouse Skeletal Muscle. Med Sci Sports Exerc 50, 2015–2023 [DOI] [PMC free article] [PubMed] [Google Scholar]
- 30.Murphy MM, Lawson JA, Mathew SJ, Hutcheson DA, and Kardon G (2011) Satellite cells, connective tissue fibroblasts and their interactions are crucial for muscle regeneration. Development 138, 3625–3637 [DOI] [PMC free article] [PubMed] [Google Scholar]
- 31.Park SW, Goodpaster BH, Strotmeyer ES, de Rekeneire N, Harris TB, Schwartz AV, Tylavsky FA, and Newman AB (2006) Decreased muscle strength and quality in older adults with type 2 diabetes: the health, aging, and body composition study. Diabetes 55, 1813–1818 [DOI] [PubMed] [Google Scholar]
- 32.Almurdhi MM, Reeves ND, Bowling FL, Boulton AJ, Jeziorska M, and Malik RA (2016) Reduced Lower-Limb Muscle Strength and Volume in Patients With Type 2 Diabetes in Relation to Neuropathy, Intramuscular Fat, and Vitamin D Levels. Diabetes Care 39, 441–447 [DOI] [PMC free article] [PubMed] [Google Scholar]
- 33.Eid S, Sas KM, Abcouwer SF, Feldman EL, Gardner TW, Pennathur S, and Fort PE (2019) New insights into the mechanisms of diabetic complications: role of lipids and lipid metabolism. Diabetologia 62, 1539–1549 [DOI] [PMC free article] [PubMed] [Google Scholar]
- 34.Saini-Chohan HK, Mitchell RW, Vaz FM, Zelinski T, and Hatch GM (2012) Delineating the role of alterations in lipid metabolism to the pathogenesis of inherited skeletal and cardiac muscle disorders: Thematic Review Series: Genetics of Human Lipid Diseases. J Lipid Res 53, 4–27 [DOI] [PMC free article] [PubMed] [Google Scholar]
- 35.Martin TP, Edgerton VR, and Grindeland RE (1988) Influence of spaceflight on rat skeletal muscle. J Appl Physiol (1985) 65, 2318–2325 [DOI] [PubMed] [Google Scholar]
- 36.Miu B, Martin TP, Roy RR, Oganov V, Ilyina-Kakueva E, Marini JF, Leger JJ, Bodine-Fowler SC, and Edgerton VR (1990) Metabolic and morphologic properties of single muscle fibers in the rat after spaceflight, Cosmos 1887. FASEB J 4, 64–72 [DOI] [PubMed] [Google Scholar]
- 37.Pellegrino MA, Canepari M, Rossi R, D’Antona G, Reggiani C, and Bottinelli R (2003) Orthologous myosin isoforms and scaling of shortening velocity with body size in mouse, rat, rabbit and human muscles. J Physiol 546, 677–689 [DOI] [PMC free article] [PubMed] [Google Scholar]
- 38.Toniolo L, Cancellara P, Maccatrozzo L, Patruno M, Mascarello F, and Reggiani C (2008) Masticatory myosin unveiled: first determination of contractile parameters of muscle fibers from carnivore jaw muscles. Am J Physiol Cell Physiol 295, C1535–1542 [DOI] [PubMed] [Google Scholar]
- 39.Bottinelli R, Schiaffino S, and Reggiani C (1991) Force-velocity relations and myosin heavy chain isoform compositions of skinned fibres from rat skeletal muscle. J Physiol 437, 655–672 [DOI] [PMC free article] [PubMed] [Google Scholar]
- 40.McMahon CJ, Wu JS, and Eisenberg RL (2010) Muscle edema. AJR Am J Roentgenol 194, W284–292 [DOI] [PubMed] [Google Scholar]
Associated Data
This section collects any data citations, data availability statements, or supplementary materials included in this article.


