Abstract
Inadequate adherence to chronic medications is a far-reaching problem with financial and human health consequences. By a wide margin, non-adherence is the leading cause of therapeutic failures of HIV pre-exposure chemoprophylaxis (PrEP) and antiretroviral therapy (ART). It has been proven that HIV infection can be prevented by daily dosing of emtricitabine and tenofovir disoproxil fumarate. Measurement of intracellular tenofovir diphosphate in red blood cells has been established as an effective way to assess cumulative adherence, however, the LC-MS-based analytical method developed for the purpose is both complicated and expensive. Here, we report a simple method for adherence monitoring based on direct MS quantification of intracellular tenofovir diphosphate in human whole blood. The method requires only microliters of whole blood, employs special membranes to perform plasma separation and concomitant desalting during blood collection, and uses nanoelectrospray on a triple quadrupole instrument. Quantitative performance in this proof-of-concept study includes RSDs of < 15% and successful analysis of a small number of patient samples with medium to high adherence levels. The results correlate with those of a validated LC-MS/MS method, and an R2 value of 0.9962 is achieved. This methodology has promise for extension to point-of-care testing using miniature mass spectrometers.
Keywords: Tenofovir diphosphate, Adherence monitoring, HIV prevention, Plasma separation, Ambient ionization mass spectrometry, Nucleotides
Introduction
In 2017, 1.8 million people became newly infected with HIV worldwide [1]. Oral emtricitabine and tenofovir disoproxil fumarate (FTC-TDF) can provide protection against acquisition of HIV (pre-exposure chemoprophylaxis, PrEP), provided that the patient adheres to a daily dosing regimen [2]. Commonly used methods for assessing adherence such as self-reporting or pill counts can be inaccurate [3], whereas direct measurement of drug concentrations in the patients’ blood is objective and quantitative. For adherence monitoring for PrEP programs, the direct measurement of the parent drug tenofovir (TFV) in urine or plasma can be performed; however, the result may be biased because it only reflects the most recent dose. A patient can be non-adherent between clinic visits, and a dose taken immediately before a clinic visit would give result that would represent “white coat” adherence.
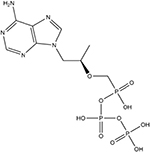
Members of our team have established that concentration levels in red blood cells (RBCs) of the major tenofovir metabolite, tenofovir diphosphate (TFV-DP, structure shown in Table 1), represent a reliable indicator of cumulative adherence [4, 5]. It was found that TFV-DP has a long half-life time of 17 days in RBC that accumulates with repeated dosing. Results from controlled pharmacokinetic studies indicate that, by measuring TFV-DP concentrations in RBCs, it is possible to differentiate cumulative dosing in the preceding 1–2 months, analogous to measurement of hemoglobin A1C to estimate cumulative glucose exposure. The measurement of TFV-DP concentration in RBCs is routinely employed to monitor patient adherence in PrEP programs and trials [4].
Table 1.
Chemical structures and MRM transitions used for quantitation
| TFV-DP | 13C-TFV-DP | |
|---|---|---|
| Chemical structures |
|
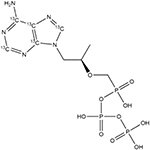
|
| Precursor ion m/z | 222.5 (doubly charged) | 225.0 (doubly charged) |
| Quantifier product ion m/z | 366.0 | 371.0 |
| Qualifier product ion m/z | 348.0 | 353.0 |
| Collision energya | 12 | 16 |
| Tube lens (V) | 31 | 31 |
Manufacturer’s nominal units
The current analytical method developed for the measurement of intracellular TFV-DP involves collection of whole blood samples as dried blood spots (DBS), multiple solid-phase extraction steps, enzymatic digestion by phosphatases, preconcentration, and LC-MS/MS analysis [4, 5]. The results from this process are accurate and precise, but the method requires expensive instrumentation and expertise and turnaround times are long, all of which hinder broader adoption. Ambient MS techniques require little to no sample preparation, and ionization is performed outside of mass spectrometers under ambient conditions [6], making this approach an attractive solution to analytical tasks such as quantitation of drugs in blood at point-of-care [7, 8] especially if the method can be adapted to a miniature mass spectrometer [9, 10]. Following the initial reports on desorption electrospray ionization (DESI) [11] and direct analysis in real time (DART) [12], numerous ambient ionization methods have been reported, including dielectric barrier discharge ionization (DBDI) [13], paper spray ionization (PSI) [14, 15], and nanospray desorption electrospray ionization (nano-DESI) [16]. Working with biological samples in their native environment, however, can still be challenging, given the limited separation performed prior to analysis. A further complication with TFV-DP is that it is found intracellularly and measurement requires cell lysis. Direct analysis of TFV-DP in whole blood is associated with challenges not amenable to established ambient ionization methods: the complex matrix severely suppresses ionization of the analyte, and its hydrophilic nature means that the compound cannot easily be extracted from the aqueous blood matrix.
We report a simple method to directly quantify TFV-DP in human whole blood. The method involves plasma separation with specialized membrane filters to reduce ion suppression. Quantitative results are obtained in a significantly shorter time than by the earlier LC-MS methodology, and the study sets the stage for future point-of-care analysis using miniature MS instrumentation.
Experimental
Materials and chemicals
Whatman 31ET paper and the 3-mm Harris Uni-Core Punch were purchased from Sigma-Aldrich. Vivid plasma membrane (VPM, grade GF) and CytoSep membrane (grade 1660) were purchased from Pall Corporation. TFV-DP and stable isotope–labeled 13C-TFV-DP were purchased from Moravek, Inc. The chemical structures of TFV-DP and 13C-TFV-DP are shown in Table 1. Human whole blood with K2 EDTA as anticoagulant was purchased from Innovative Research, Inc., and used within 1 week of receipt. Borosilicate glass capillaries were purchased from Sutter Instruments and pulled to 5-μm-inner diameter nanotips using the P-97 tip puller from the same vendor. All solvents and other chemicals were purchased from Fischer Scientific.
Plasma separation to isolate RBCs using membranes
The procedure for plasma separation using a membrane is shown in Fig. 1 (using the membrane VPM as an example). To separate plasma using VPM, this membrane was placed on top of a layer of 31ET paper with the rough side (larger pores) facing up. Whole blood (5 μL) was then dispensed on top of the VPM, and the 31ET wicked away any excess amount of plasma. In order to establish a calibration curve by spiking TFV-DP standards, a 3-mm-diameter disc was punched from the center of each 5 μL blood spot and this sample was spiked with 2 μL TFV-DP in 70:30 methanol/water (v/v) over a range of concentrations. Three blood spots were made for each concentration. Each 3-mm punch was placed in a 1.5-mL Eppendorf tube pre-loaded with 50 μL of solvent (for example, 70:30 acetonitrile/water, v/v) containing 90 ng/mL internal standard (13C-TFV-DP). The tube was kept at room temperature for 30 min to lyse the cells and to extract the metabolite. Three punches spiked at the same level of TFV-DP were extracted in different tubes; the resulting extracts were pooled to reduce possible variability in extraction efficiency. Ten microliters of the pooled extracted solvent was loaded into a nanocapillary tip for MS analysis. The procedure used for plasma separation with CytoSep membranes was similar except that it did not require the use of the underlying 31ET paper.
Fig. 1.
Direct analysis of TFV-DP in whole blood by plasma filtration with VPM. (a) Deposit 5 μL of whole blood onto VPM. (b) Punch out a 3-mm circle from the blood spot. (c) Extract a 3-mm punch with 50 μL of solvent for 30 min. (d) Analyze using negative nESI in MRM mode
The procedure used for analysis of patient samples is even simpler because it does not require spiking with standards. A whole blood sample was collected, and three 5 μL blood spots were deposited on the plasma separation membrane. Three-millimeter-diameter discs were punched out from each spot, then directly extracted in solvent, and the extracts were pooled for nanoelectrospray ionization (nESI) MS analysis.
MS analysis
A TSQ Quantum Access Max from Thermo Fisher Scientific was used to perform all MS analyses. Pure TFV-DP and 13C-TFV-DP standard solutions were nanosprayed directly into the MS to perform optimization using instrument software control. An MRM method was established based on the optimized parameters. The transitions used in the MRM method were doubly charged at m/z 222.5 → m/z 366 and 348 for TFV-DP and m/z 225 → m/z 371 and 353 for 13C-TFV-DP. These transitions are loss of one phosphate group (m/z 79). Singly charged TFV-DP and 13C-TFV-DP ions were of lower abundance so they are not chosen. The transitions and instrumental conditions used for quantitation are listed in Table 1.
Calibration and quality control
A matrix-matched calibration curve was established for quantitation. Calibration standards were prepared at 171 fmol/punch (CAL1), 683 fmol/punch (CAL2), 1366 fmol/punch (CAL3), and 3416 fmol/punch (CAL4) by spiking 2 μL of 38 ng/mL, 152 ng/mL, 304 ng/mL, and 760 ng/mL TFV-DP onto 3-mm punches, respectively. Quality control (QC) samples were prepared at 342 fmol/punch (QC1) and 1708 fmol/punch (QC2) by spiking 2 μL of 76 ng/mL and 380 ng/mL TFV-DP onto 3-mm punches, respectively. MS analyses were performed in replicates (n = 3) for each calibration standard or QC standard.
Human subject samples
Human subject samples were collected following informed consent at the University of Colorado Denver under IRB protocol COMIRB 09–0761. Whole blood samples were collected on VPM and shipped to Purdue University on dry ice for analysis using the newly developed method. Four replicates were run for each sample. The extraction took 30 min, but multiple samples were processed in parallel and the number of samples processed was not limited by any equipment requirement. Thus, the average assay time was 10 min per sample when running four replicates for five samples. Blood from the same blood draw was also spotted on Whatman 903 cards following published procedures, for TFV-DP analyses by validated LC-MS/MS at the University of Colorado Antiviral Pharmacology Laboratory [4, 5]. Briefly, a 3-mm punch was extracted using 70:30 methanol/water (v/v). The lysed and extracted solution was then purified through solid-phase extraction (SPE) followed by dephosphorylation using phosphatase to convert TFV-DP back to tenofovir. This sample was then desalted and concentrated using another SPE cartridge before injected into the LC-MS system for quantitation. Resulting TFV-DP was interpreted with adherence tables generated through directly observed dosing studies [17]. The turnaround time of this assay from sample extraction to LC-MS/MS analysis was about 24 h.
Results and discussion
Considerations for direct MS analysis of TFV-DP
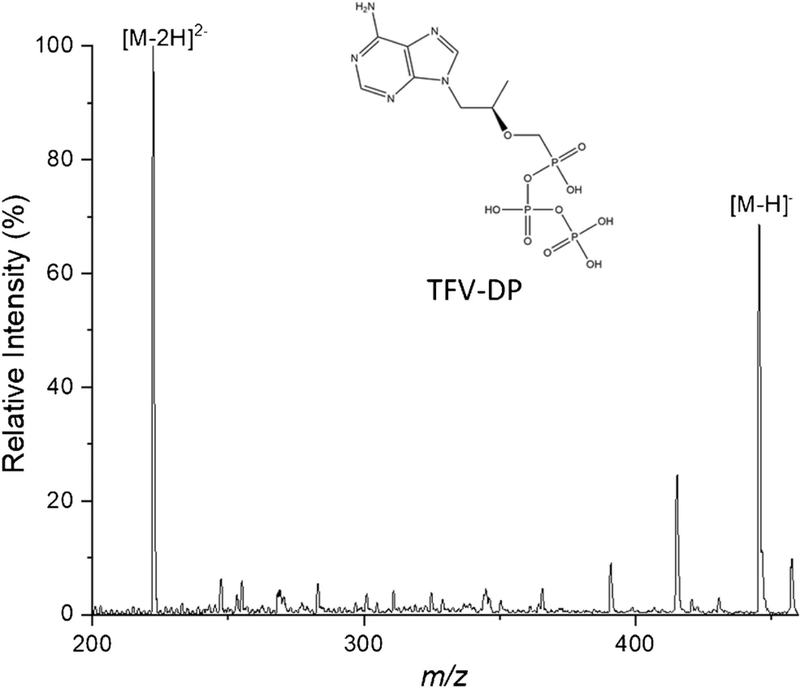
In order to achieve a fast and simple measurement, traditional separations cannot be used in the procedure. nESI was performed using a concentrated TFV-DP solution of 3.8 μg/mL in 70:30 methanol/water (v/v) in the negative ion mode. Full MS spectra (range m/z 50–460) were collected, and an example is shown in Fig. 2. The most intense peaks are m/z 222.5 and 446, corresponding to doubly charged and singly charged TFV-DP, respectively. This feature is associated with the presence of multiple phosphate groups in TFV-DP. The presence of both charge states did not affect quantitative performance (RSD < 15%, discussed later), but it is important to realize that the relative abundances of these ions depend on instrumental conditions. The phosphate groups make the compound very hydrophilic, making it challenging to extract from blood with organic solvent due to low partition into organic phase (negative log P). This step was therefore not attempted.
Fig. 2.
Mass spectrum of TFV-DP solution (3.8 μg/mL) nanosprayed in negative mode showing the singly charged diphosphate at m/z 446 and the doubly charged ion at m/z 222.5
Another challenge for direct analysis of intracellular TFV-DP in whole blood is the severe matrix effect. We spiked high concentrations of TFV-DP (ppm levels) into refrigerated human whole blood (to slow down analyte hydrolysis) and explored a variety of direct analysis methods, including extraction nESI [18], PSI [14], and slug-flow microextraction [19], which have proven suitable for low-level blood analysis of many other drugs. However, none met the performance requirements for TFV-DP analysis. Besides the low extraction efficiency, we found that the signal intensity of TFV-DP is susceptible to the presence of salt in the final spray solution (see Electronic Supplementary Material (ESM) Fig. S1; discussion of ion suppression is provided in the ESM). As whole blood is a salty matrix, this indicates that desalting will be a crucial step for direct TFV-DP analysis.
Direct analysis of TFV-DP by plasma separation using membranes
RBC preservation during the desalting process was important because TFV-DP in RBC is the moiety of interest. Membrane filters (VPM and CytoSep) which are available for separation of plasma from whole blood can be repurposed for collection of blood cells while filtering out the plasma. As plasma dissolves most of the salt in blood, this simple step helps to clean up the sample for direct MS analysis. VPM has an asymmetric pore size distribution in the vertical direction, so blood cells will be trapped inside the pores when entering from the large-pore diameter side while liquid and small molecules will pass through to the next layer (a 31ET filter paper) or spread out on the VPM. The VPM is made of polysulfone, which is hydrophobic and should have low retention for TFV-DP. CytoSep is a fibrous material that retains RBCs on the surface while plasma moves through the matrix, and some degree of hemolysis can be expected during plasma separation with CytoSep.
For plasma removal using VPM, 5 μL of human whole blood was dispensed onto the VPM with a layer of 31ET paper placed underneath. The blood was quickly absorbed into VPM and plasma spread throughout the membrane (ESM Fig. S2), while excess plasma was wicked away by the 31ET paper. A 3-mm punch could be taken easily without drying the blood spots. The blood cells from 5 μL whole blood occupied a circular space with a diameter slightly larger than 3 mm, allowing 3-mm punches to be taken without wasting blood sample. Simulated tenofovir metabolite–containing samples were made by spiking 2 μL of TFV-DP (in methanol) onto 3-mm punches before adding 50 μL of extraction solvent. The extraction solvents (described below) contained 90 ng/mL stable isotope–labeled 13C-TFV-DP as internal standard (TFV-DP-IS). The spiking procedure is similar when using CytoSep for plasma separation.
We explored extraction with pure water, methanol, and mixtures of methanol/water, all of which caused salts and cell debris to be washed off the punches, resulting in an unstable spray and severe capillary clogging. Although filtering may help alleviate the issue, this introduces an extra step while also increases the loss of analytes due to their retention in the filter. Acetonitrile was found to be capable of providing clean extracts. Because TFV-DP is very hydrophilic, water was mixed with acetonitrile to improve extraction efficiency; however, too much water in the mixture again yielded dirty extracts. The optimal solvent mixture was found to be 70:30 acetonitrile/water, v/v.
To investigate the signal improvement after plasma separation, one 3-mm punch from a DBS made using either 31ET, VPM, or CytoSep was placed in 50 μL of 1 μg/mL TFV-DP solutions and vortexed for 2 min, then 10 μL of each solution was loaded into the nanocapillary tip to perform nESI. A pure TFV-DP solution of the same concentration was also analyzed as a reference. As shown in Fig. S3 (see ESM), ion suppression still exists after plasma separation. However, the signal was improved ca. 5 times using VPM or CytoSep when compared with 31ET. Total ion chronograms shown in Fig. S4 (see ESM) indicate that the signal intensities were stable for more than 1 min with plasma separation using CytoSep or VPM, but not stable without plasma separation when using 31ET alone. Considering that the actual concentration of TFV-DP is much lower in blood samples, the improvement could be even more profound. Because the possibility of hemolysis (premature destruction of the RBCs) and the difficulty we experienced in cutting 3-mm punches from CytoSep (due to the special features of this material), VPM was chosen to perform the subsequent quantitative studies.
Direct quantitation of simulated whole blood samples after plasma separation using VPM
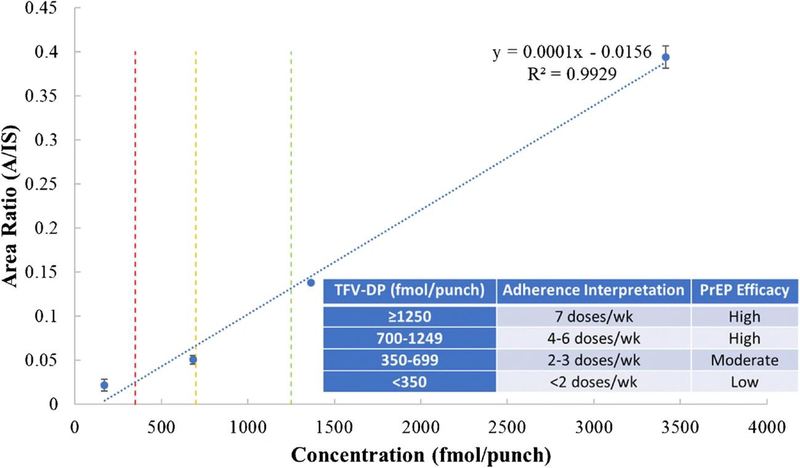
Quantitative performance was explored by establishing a calibration curve using VPM to perform plasma separation (Fig. 3). RSD values < 10% were obtained for all calibration standards except for CAL1, where RSD was 30% and the signal was less than 10 times that of the blank, both of which are unacceptable. The concentration unit used to express the data is fmol/punch to reflect the amount of TFV-DP on each 3-mm punched disc and to facilitate correlations with published results. It was reported in a directly observed dosing study [5, 17] that TFV-DP in DBS above 1250 fmol/punch was associated with daily dosing, 700–1249 fmol/punch was associated with 4–6 tablets per week, 350–699 fmol/punch for 2 or 3 tablets per week, and 349 fmol/punch or less to fewer than 2 tablets per week [5]. Three lines have been drawn at 350 fmol/punch, 700 fmol/punch, and 1250 fmol/punch in the calibration curve (Fig. 3) to show the critical thresholds corresponding to these dosages. These thresholds are clinically relevant as ≥ 4 doses per week are associated with ≥ 96% PrEP efficacy, as noted qualitatively in the inset of Fig. 3 [20]. QC samples were measured after establishing the calibration curve, and RSD values of 5.3% and 5.2% were obtained for QC1 (342 fmol/punch) and QC2 (1708 fmol/punch), respectively (ESM Table S1). Accuracy was 23.4% for QC1 and 14.6% for QC2. The calibration curve covers the entire range of doses, indicating that it should be useful for adherence monitoring.
Fig. 3.
Calibration curve with VPM for plasma separation, n = 3. Red line, 350 fmol/punch; yellow line, 700 fmol/punch; green line, 1250 fmol/punch. Inset, qualitative PrEP efficacy associated with interpreted doses
Proof-of-concept validation of the method using human subject samples
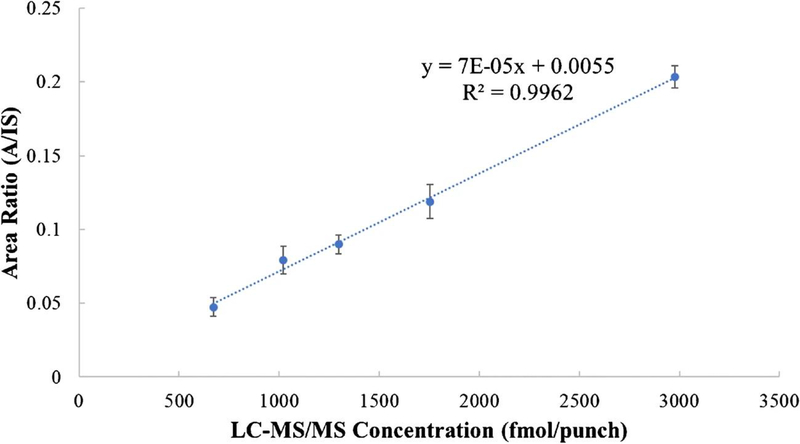
Whole blood samples were collected following the current procedure using VPM from five human subjects taking PrEP, with four subjects showing high adherence levels and one subject showing a moderate adherence level. The blood collection was similar to that used for conventional DBS [21]; thus, it can be easily integrated into existing clinical procedures. Samples were stored at − 80 °C until analysis, as TFV-DP degrades after a few days at higher temperatures (ESM Fig. S5, discussion of storage conditions on analytes stability is provided in the ESM). We calculated the concentration based on the calibration curve (“calculated concentration”) and compared those to the LC-MS/MS results from the University of Colorado Antiviral Pharmacology Laboratory (“TFV-DP concentration”) as shown in Table 2 [4, 5]. The RSDs were all below 15%. There were consistent underestimations compared to the established LC-MS/MS method, by an average of ~ 20%, which was not unexpected: the matrix-matched calibration in the current study was established using spiked samples, which did not take into consideration the difference in the extraction efficiency of spiked compound vs. intracellular compound. The different media used for collecting blood samples (VPM vs. Whatman 903 protein savers card) also mean that the amount of RBCs in each 3-mm punch may be different. Nevertheless, we were able to establish a strong linear relationship between the current method and the validated LC-MS/MS method (Fig. 4, R2 = 0.9962). By correlating results from the current direct analysis method with those from more sophisticated method, subject dosage regimes were determined. The analysis of five human samples provides evidence that the current method could be used for assessment of cumulative adherence to PrEP.
Table 2.
Comparison of the quantitation results of the current method to the validated LC-MS/MS method [4, 5]
| Subject ID | Adherence level | TFV-DP concentration from the validated method (fmol/punch) (n = 1) | Calculated concentration from the current method (fmol/punch) (n = 4) | Bias (%) | RSD (%) |
|---|---|---|---|---|---|
| 1 | High | 1297 | 1055 | − 19 | 6.9 |
| 2 | High | 1021 | 947 | − 7 | 11.8 |
| 3 | High | 2977 | 2190 | − 26 | 3.6 |
| 4 | Medium | 671 | 630 | − 6 | 13.3 |
| 5 | High | 1754 | 1345 | − 23 | 9.8 |
Fig. 4.
Linear relationship of the quantitative results obtained using the new method developed in this study and those obtained from the validated LC-MS/MS method
Conclusions
We report a simple method for direct quantitation of TFV-DP in whole blood after filtering off plasma, because TFV-DP ionization is sensitive to salts. Plasma separation was realized using specialized membrane filters (VPM or CytoSep), and the retained blood cells were lysed for direct MS analysis using nESI. With VPM membranes, we demonstrated that the method is quantitative. The method is simple, fast, and cost-effective and only takes microliters of whole blood for analysis, making fingerstick samples suitable for blood collection. In this proof-of-concept study, concentrations of TFV-DP in human subject samples were successfully measured and a strong linear relationship with an existing validated conventional LC-MS/MS method was established, providing evidence that this simple method could be used for assessing adherence by measuring TFV-DP. The data from this simple method show systematically lower levels of TFV-DP (ca. 20%) than those from the reference method. A full validation of the methodology with a large sample set is necessary to establish the robustness and clinical value of the method. The average assay time per sample was less than 10 min (turnaround time about 30 min; virtually, an unlimited number of samples can be processed in parallel), which is significantly shorter than the 24-h turnaround time required using the earlier validated method. The method does not require extra steps during sample collection when compared with conventional DBS collection and thus can be easily integrated into existing procedures in clinical laboratories or point-of-care MS instrumentation. This could involve the use of miniature mass spectrometers at point-of-care for measurement of TFV-DP. Besides direct analysis of TFV-DP, the plasma separation method developed here may also be used for fast analysis of other intracellular compounds in blood cells such as other therapeutic nucleotide analogs [22].
Supplementary Material
Acknowledgments
The authors acknowledge the support from Bindley Biosciences Center at Purdue University and thank Zhuoer Xie and Robert Schrader for their artistic contributions to the figures.
Funding information
The study received funding from the National Institutes of Health under award numbers R01AI122298 and R44GM119584.
Compliance with ethical standards Human subject samples were collected at the University of Colorado Anschutz Medical Campus (Denver). The study was approved by the Colorado Multiple Institutional Review Board (IRB) under protocol COMIRB 09-0761, and all participants gave written informed consent.
Footnotes
Conflict of interest The authors declare that they have no conflict of interest.
Electronic supplementary material The online version of this article (https://doi.org/10.1007/s00216-019-02304-0) contains supplementary material, which is available to authorized users.
References
- 1.UNAIDS Global HIV & AIDS statistics—2018 fact sheet. https://www.unaids.org/en/resources/fact-sheet.Accessed 26 June 2019.
- 2.Grant RM, Lama JR, Anderson PL, McMahan V, Liu AY, Vargas L, et al. Preexposure chemoprophylaxis for HIV prevention in men who have sex with men. N Engl J Med. 2010;363(27):2587–99. 10.1056/Nejmoa1011205. [DOI] [PMC free article] [PubMed] [Google Scholar]
- 3.Berg KM, Arnsten JH. Practical and conceptual challenges in measuring antiretroviral adherence. J Acquir Immune Defic Syndr. 2006;43(Suppl 1):S79–87. 10.1097/01.qai.0000248337.97814.66. [DOI] [PMC free article] [PubMed] [Google Scholar]
- 4.Castillo-Mancilla JR, Zheng JH, Rower JE, Meditz A, Gardner EM, Predhomme J, et al. Tenofovir, emtricitabine, and tenofovir diphosphate in dried blood spots for determining recent and cumulative drug exposure. AIDS Res Hum Retrovir. 2013;29(2):384–90. 10.1089/AID.2012.0089. [DOI] [PMC free article] [PubMed] [Google Scholar]
- 5.Zheng JH, Rower C, McAllister K, Castillo-Mancilla J, Klein B, Meditz A, et al. Application of an intracellular assay for determination of tenofovir-diphosphate and emtricitabine-triphosphate from erythrocytes using dried blood spots. J Pharm Biomed Anal. 2016;122:16–20. 10.1016/j.jpba.2016.01.038. [DOI] [PMC free article] [PubMed] [Google Scholar]
- 6.Cooks RG, Ouyang Z, Takats Z, Wiseman JM. Detection technologies. Ambient mass spectrometry. Science. 2006;311(5767): 1566–70. 10.1126/science.1119426. [DOI] [PubMed] [Google Scholar]
- 7.Shi RZ, El Gierari el TM, Manicke NE, Faix JD. Rapid measurement of tacrolimus in whole blood by paper spray-tandem mass spectrometry (PS-MS/MS). Clin Chim Acta. 2015;441:99–104. 10.1016/j.cca.2014.12.022. [DOI] [PubMed] [Google Scholar]
- 8.Yannell KE, Kesely KR, Chien HD, Kissinger CB, Cooks RG. Comparison of paper spray mass spectrometry analysis of dried blood spots from devices used for in-field collection of clinical samples. Anal Bioanal Chem. 2017;409(1):121–31. 10.1007/s00216-016-9954-5. [DOI] [PubMed] [Google Scholar]
- 9.Ferreira CR, Yannell KE, Jarmusch AK, Pirro V, Ouyang Z, Cooks RG. Ambient ionization mass spectrometry for point-of-care diagnostics and other clinical measurements. Clin Chem. 2016;62(1):99–110. 10.1373/clinchem.2014.237164. [DOI] [PMC free article] [PubMed] [Google Scholar]
- 10.Snyder DT, Pulliam CJ, Ouyang Z, Cooks RG. Miniature and fieldable mass spectrometers: recent advances. Anal Chem. 2016;88(1):2–29. 10.1021/acs.analchem.5b03070. [DOI] [PMC free article] [PubMed] [Google Scholar]
- 11.Takats Z, Wiseman JM, Gologan B, Cooks RG. Mass spectrometry sampling under ambient conditions with desorption electrospray ionization. Science. 2004;306(5695):471–3. 10.1126/science.1104404. [DOI] [PubMed] [Google Scholar]
- 12.Cody RB, Laramee JA, Durst HD. Versatile new ion source for the analysis of materials in open air under ambient conditions. Anal Chem. 2005;77(8):2297–302. 10.1021/ac050162j. [DOI] [PubMed] [Google Scholar]
- 13.Na N, Zhao M, Zhang S, Yang C, Zhang X. Development of a dielectric barrier discharge ion source for ambient mass spectrometry. J Am Soc Mass Spectrom. 2007;18(10):1859–62. 10.1016/j.jasms.2007.07.027. [DOI] [PubMed] [Google Scholar]
- 14.Wang H, Liu J, Cooks RG, Ouyang Z. Paper spray for direct analysis of complex mixtures using mass spectrometry. Angew Chem Int Ed. 2010;49(5):877–80. 10.1002/anie.200906314. [DOI] [PubMed] [Google Scholar]
- 15.Liu J, Wang H, Manicke NE, Lin JM, Cooks RG, Ouyang Z. Development, characterization, and application of paper spray ionization. Anal Chem. 2010;82(6):2463–71. 10.1021/ac902854g. [DOI] [PubMed] [Google Scholar]
- 16.Roach PJ, Laskin J, Laskin A. Nanospray desorption electrospray ionization: an ambient method for liquid-extraction surface sampling in mass spectrometry. Analyst. 2010;135(9):2233–6. 10.1039/c0an00312c. [DOI] [PubMed] [Google Scholar]
- 17.Anderson PL, Liu AY, Castillo-Mancilla JR, Gardner EM, Seifert SM, McHugh C, et al. Intracellular tenofovir-diphosphate and emtricitabine-triphosphate in dried blood spots following directly observed therapy. Antimicrob Agents Chemother. 2018;62(1). 10.1128/AAC.01710-17. [DOI] [PMC free article] [PubMed] [Google Scholar]
- 18.Ren Y, Liu J, Li L, McLuckey MN, Ouyang Z. Direct mass spectrometry analysis of untreated samples of ultralow amounts using extraction nano-electrospray. Anal Methods. 2013;5(23). 10.1039/C3AY41149D. [DOI] [PMC free article] [PubMed] [Google Scholar]
- 19.Ren Y, McLuckey MN, Liu J, Ouyang Z. Direct mass spectrometry analysis of biofluid samples using slug-flow microextraction nano-electrospray ionization. Angew Chem Int Ed. 2014;53(51):14124–7. 10.1002/anie.201408338. [DOI] [PMC free article] [PubMed] [Google Scholar]
- 20.Anderson PL, Glidden DV, Liu A, Buchbinder S, Lama JR, Guanira JV, et al. Emtricitabine-tenofovir concentrations and pre-exposure prophylaxis efficacy in men who have sex with men. Sci Transl Med. 2012;4(151):151ra125. 10.1126/scitranslmed.3004006. [DOI] [PMC free article] [PubMed] [Google Scholar]
- 21.Wagner M, Tonoli D, Varesio E, Hopfgartner G. The use of mass spectrometry to analyze dried blood spots. Mass Spectrom Rev. 2016;35(3):361–438. 10.1002/mas.21441. [DOI] [PubMed] [Google Scholar]
- 22.Jansen RS, Rosing H, Schellens JH, Beijnen JH. Mass spectrometry in the quantitative analysis of therapeutic intracellular nucleotide analogs. Mass Spectrom Rev. 2011;30(2):321–43. 10.1002/mas.20280. [DOI] [PubMed] [Google Scholar]
Associated Data
This section collects any data citations, data availability statements, or supplementary materials included in this article.


