
Figure 4. 1H-NMR and 1H-ROESY spectra of the TbFUT1 reaction product.
(A) One-dimensional 1H-NMR spectrum. The arrow points to the α-Fuc H1 doublet. (B) Enlargement of the 3.2–5.1 ppm region of the two-dimensional 1H-ROESY spectrum. (a) indicates the crosspeak resulting from a through-space connectivity between α-Fuc H1 and β-Gal H2.
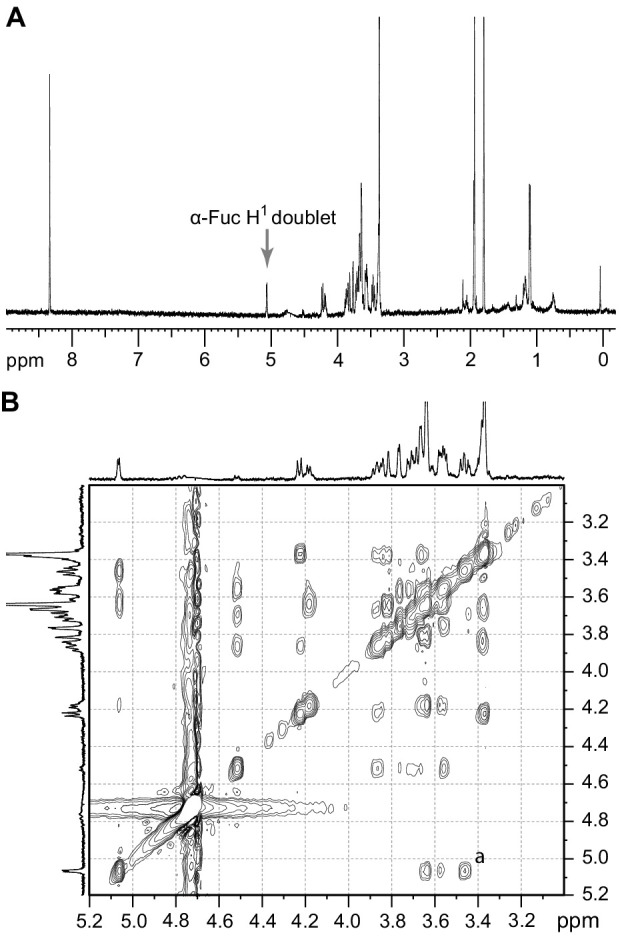
Figure 4—figure supplement 1. GC-MS methylation linkage analysis of the purified reaction product.

(A) Chromatogram of the partially methylated alditol acetates (PMAAs) obtained from the reaction product. The peaks are annotated to reflect their origin in the oligosaccharide: t-Fuc: non-reducing terminal fucose; 2-Gal: 2-O-substituted galactose; 3-GlcNAc: 3-O-substituted N-acetylglucosamine; 2-Fuc: 2-O-substituted fucose. (B–E) Electron-impact MS spectra for the peaks at 15.9, 18.6, 24.7, and 14.1 min, respectively. The insets in each panel show the fragmentation patterns.