

Abstract
BACKGROUND:
Visualization of aortic valve dynamics is important in diagnosing valvular diseases but is challenging to perform with MRI due to the limited temporal resolution.
PURPOSE:
To develop an MRI technique with sub-millisecond temporal resolution and demonstrate its application in visualizing rapid aortic valve opening and closing in human subjects in comparison with echocardiography and conventional MRI techniques.
POPULATION:
12 healthy subjects.
STUDY TYPE:
Prospective.
FIELD STRENGTH/SEQUENCE:
3T; gradient-echo-train-based sub-millisecond periodic event encoded imaging (get-SPEEDI) and balanced steady-state free precession (bSSFP).
ASSESSMENT:
Images were acquired using get-SPEEDI with a temporal resolution of 0.6 ms. get-SPEEDI was triggered by an electrocardiogram so that each echo in the gradient echo train corresponded to an image at a specific time point, providing a time-resolved characterization of aortic valve dynamics. For comparison, bSSFP was also employed with 12 ms and 24 ms temporal resolutions, respectively. The durations of the aortic valve rapid opening (Tro), rapid closing (Trc), and the maximal aortic valve area (AVA) normalized to height were measured with all three temporal resolutions. M-mode echocardiograms with a temporal resolution of 0.8 ms were obtained for further comparison.
STATISTICAL TEST:
Parameters were compared between the three sequences, together with the echocardiography results, with a Mann–Whitney U test.
RESULTS:
Significantly shorter Tro (mean±standard deviation: 27.5±6.7 ms) and Trc (43.8±11.6 ms) and larger maximal AVA/height (2.01±0.29 cm2/m) were measured with get-SPEEDI compared to either bSSFP sequence (Tro of 56.3±18.8 and 63.8±20.2 ms; Trc of 68.2±16.6 and 72.8±18.2 ms; maximal AVA/height of 1.63±0.28 and 1.65±0.32 cm2/m for 12ms and 24ms temporal resolutions, respectively, p<0.05). In addition, the get-SPEEDI results were more consistent with those measured using echocardiography, especially for Tro (29.0±4.1 ms, p=0.79) and Trc (41.6±4.3 ms, p=0.16).
DATA CONCLUSION:
get-SPEEDI allows for visualization of human aortic valve dynamics and provided values closer to those measured using echocardiography than the bSSFP sequences.
Keywords: aortic valve, aortic valve area, cardiovascular magnetic resonance imaging, sub-millisecond, temporal resolution, ultra-fast MRI
Introduction
The aortic valve, comprised of three semilunar cuspids, is the last valve through which blood enters the aorta. It regulates the blood flow from the left ventricle to the aorta and opens and closes rapidly. The aortic valve opening-closing process consists of three phases: a rapid opening, a slow closing, and a rapid closing phase (1). Measured in vivo (1) or in vitro (2), the first and the last phases happen on the order of several tens of milliseconds and can be altered in malfunctioning aortic valve. Abnormalities of aortic valve opening and closing are common and lead to stenosis and regurgitation, which are primary causes of morbidity and mortality (3). To fully characterize aortic valve movement with imaging, a temporal resolution on the order of milliseconds or shorter is needed. Transthoracic echocardiography is a common tool for visualizing aortic valve movement because of its high temporal resolution and wide availability. However, echocardiography can be restricted by poor acoustic windows (4) and image quality, compromising the ability to provide sufficient tissue contrast.
For the past two decades, MRI has been increasingly used to evaluate cardiovascular diseases, including valvular abnormalities (4,5). However, the limited temporal resolution of MRI remains a barrier for visualizing certain rapidly moving valvular processes. Even with the highest temporal resolution currently available in MRI, only few time points can be acquired during the rapid phases of aortic valve opening and closing (6). Sub-millisecond periodic event encoded dynamic imaging (SPEEDI), an MRI technique with sub-millisecond temporal resolution (7), allows for a temporal resolution as high as 0.2 ms, suggesting new opportunities to visualize the rapid dynamics of aortic valve movement (8). However, SPEEDI relies on phase-encoded free-induction decay (FID) signals, leading to long total imaging times despite the use of sparse sampling techniques, such as compressed sensing (CS) (7,8). To apply SPEEDI to imaging the human aortic valve, the scan times in SPEEDI must be reduced further.
The purpose of our study was to develop a gradient-echo-train-based version of SPEEDI (get-SPEEDI) and demonstrate the technical feasibility for visualization of the rapid opening and closing of the aortic valve on healthy human subjects in comparison with conventional MRI techniques and echocardiography.
Materials and Methods
Subjects
With IRB approval, twelve healthy human subjects were recruited from the community after obtaining consent for MRI scan (eight males and four females to match the gender distribution of cardiovascular disease for the age group enrolled in this study (9)). Seven of them were re-recruited to receive additional echocardiography examinations.
get-SPEEDI
Briefly, the SPEEDI (7,8) sequence employs phase-encoding exclusively for spatial encoding, allowing the signals (e.g., FIDs or spin echoes) to capture the time evolution of a periodic event. It is synchronized with a periodic event so that the same time point of the MRI signal from different TRs with distinct phase-encoding values can be grouped into a k-space matrix, with each k-space matrix corresponding to a specific time point. After a Fourier transform, the collection of resulting images temporally resolves the periodic event with a temporal resolution determined by the dwell time.
To shorten the acquisition time, we implemented SPEEDI with a gradient echo train (i.e., get-SPEEDI). This variation employs both frequency and phase encodings in an echo train without using inter-echo phase-encoding blips (Fig. 1). The get-SPEEDI sequence is synchronized with a cyclic event (e.g., heartbeat and the associated electrocardiogram (ECG) trigger), so that each echo in the gradient echo train can be positioned in a distinct k-space matrix, and all echoes in the echo train spread across a series of time-resolved k-space matrices (k-space 1, k-space 2, … k-space N). This process is repeated M times, each with a different phase-encoding step, until all 2D k-space matrices are adequately sampled. After applying 2D Fourier transforms to the k-space matrices, a set of time-resolved images are produced to characterize the underlying dynamic process. The temporal resolution in get-SPEEDI is determined by echo spacing (esp), which is typically less than 1 ms, particularly when ramp-sampling is used (10).
Figure 1.
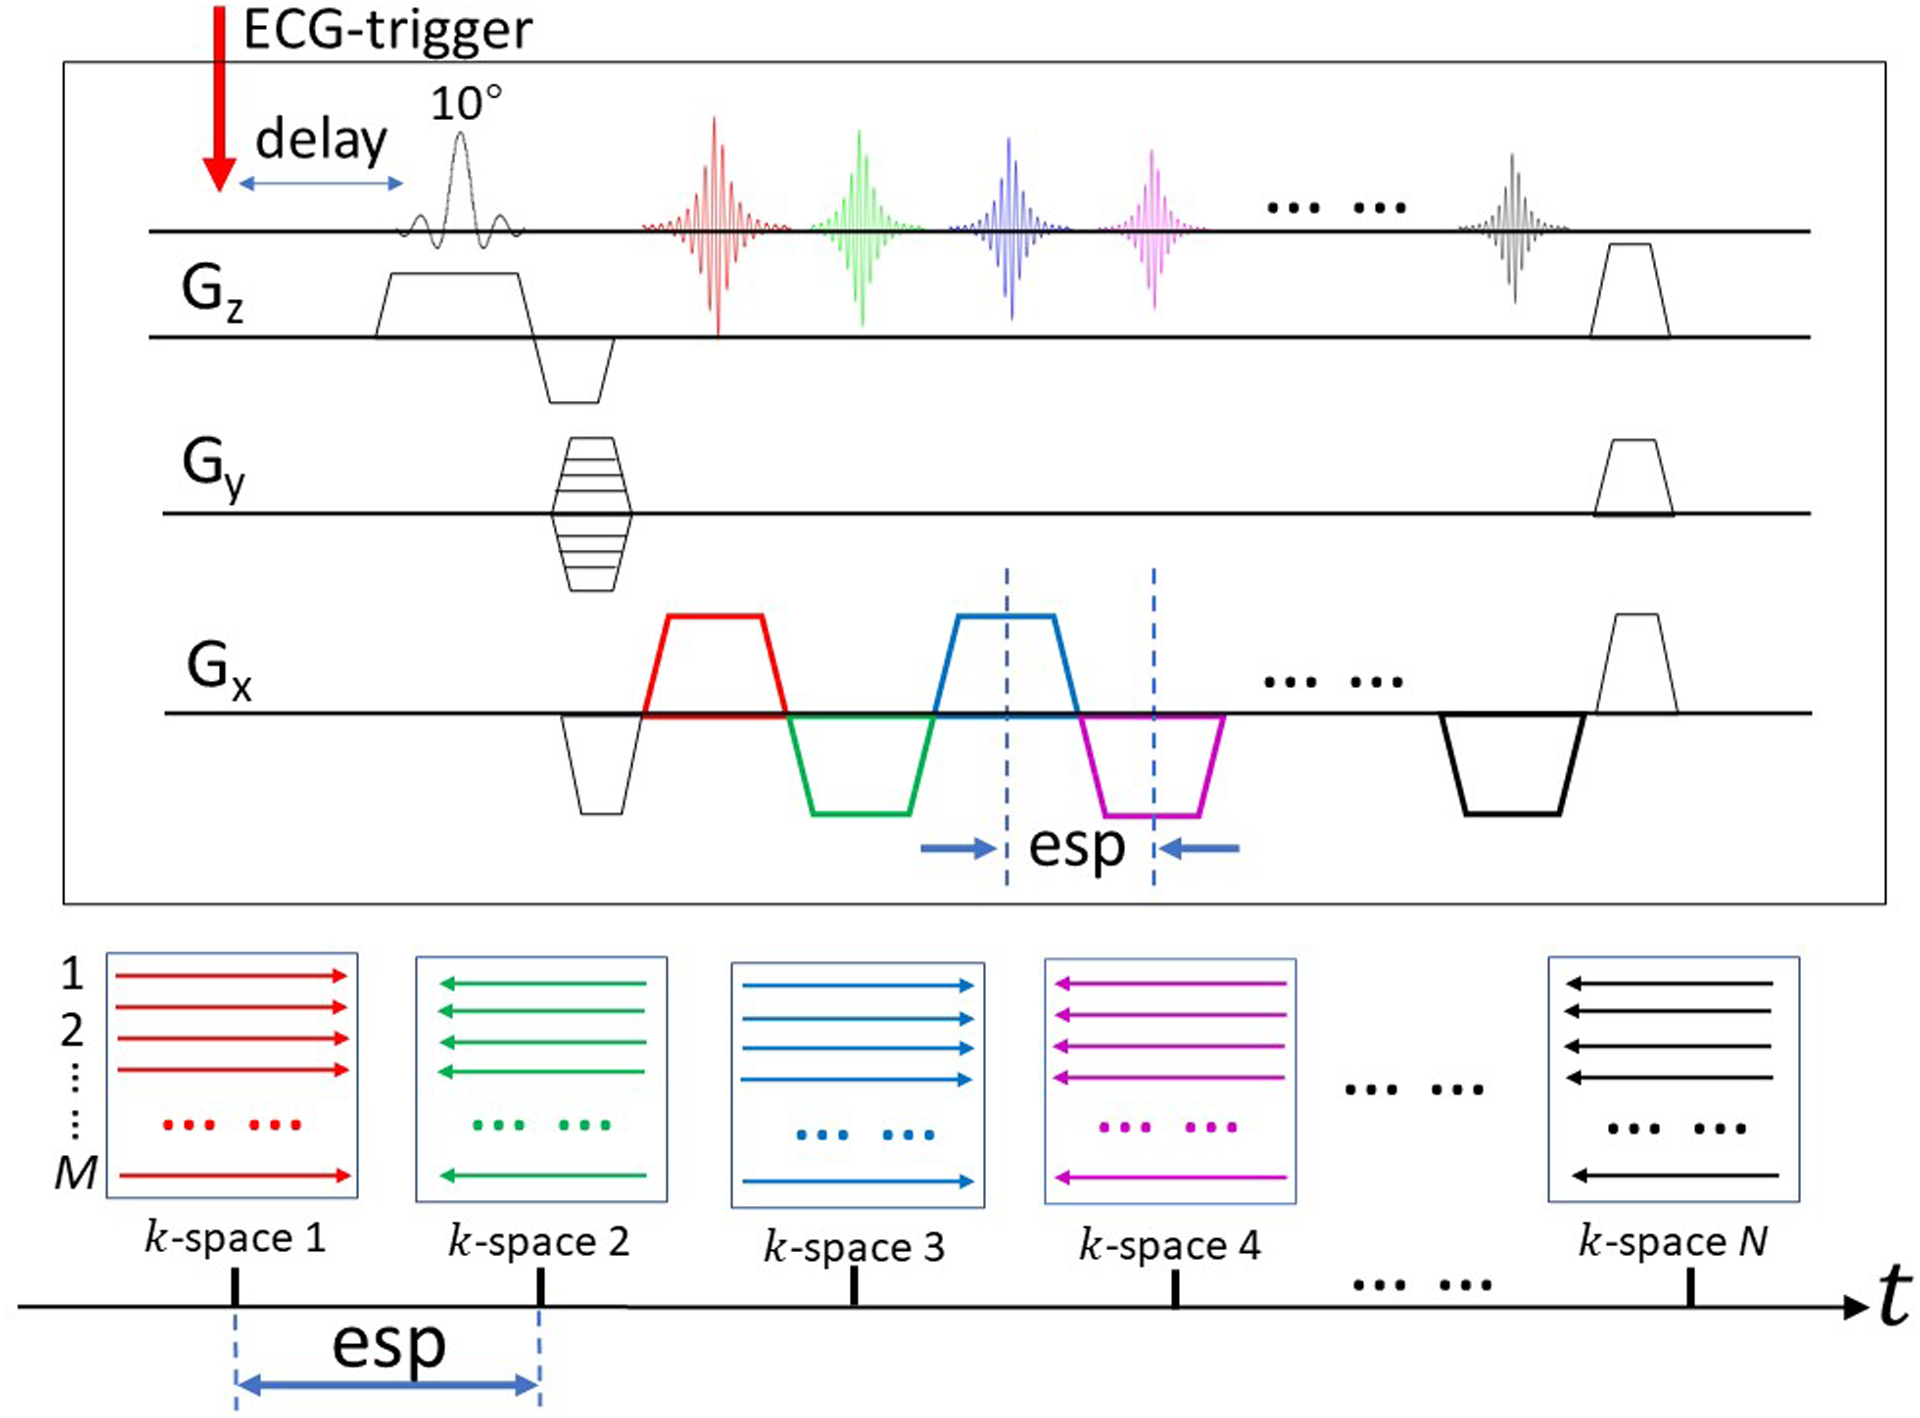
Sequence diagram illustrating the principles of get-SPEEDI. The sequence is synchronized with a cyclic event (e.g., an electrocardiogram or ECG trigger). Each echo in the gradient echo train is positioned in a distinct k-space matrix, and all echoes in the echo train are spread across a series of time-resolved k-space matrices (k-space 1, k-space 2, … k-space N, whose colors correspond to the colors in the echo train labeled on the Gx gradient). To fully sample k-space, M phase-encoding gradient steps with M triggers are required. The temporal resolution of get-SPEEDI is determined by echo spacing (esp) which is typically less than a millisecond.
Interleaved Multi-phase Strategy
To completely capture the full dynamics of aortic valve opening and closing, an interleaved multi-phase acquisition strategy was used, as shown in Fig. 2. L concatenated acquisition blocks (i.e., echo-train readout blocks) were first used to cover multiple phases after a trigger delay (delay 1). Within each block, whose duration was Tblock, a total of N k-space matrices was produced. The times needed for the RF pulse, slice-selection gradient, phase-encoding gradient, spoiler gradient, etc., led to a gap (Textra) in-between the acquisition blocks. To fill in the gaps, a second set of acquisition blocks with a longer trigger delay (delay 2) was subsequently used to “dovetail” the preceding acquisition blocks with a shorter trigger delay, as shown in Fig. 2B. If Textra > Tblock, then additional delays were added until the gaps were fully covered. Using this interleaved multi-phase acquisition strategy with m delays, a continuous characterization of the aortic valve movement was achieved with m×L×N images without any temporal gaps.
Figure 2.

Timing diagram of the interleaved multi-phase acquisition strategy. (A) L blocks (note that each block represents an echo-train readout window) were acquired within an R-R interval to cover a time span of the dynamic process, with each block containing N images. (B) Two different trigger delays (delay 1 in blue and delay 2 in red) were employed so that the temporal gap in-between the acquisition blocks were “dovetailed” to achieve a complete coverage of the dynamic process. A continuous characterization of the entire aortic valve movement was achieved without any temporal gaps with 2×L×N images.
MR Image Acquisition
The get-SPEEDI sequence in Figs. 1 and 2 was implemented on a 3 Tesla GE MR750 scanner (General Electric Healthcare, Waukesha, Wisconsin), followed by scanning the twelve human subjects using a 32-channel cardiac coil. After acquisition of scout images, a series of standard cine balanced steady-state free precession (bSSFP) images were obtained in the 2-chamber, 3-chamber, 4-chamber, and short-axis views. The imaging parameters for the cine bSSFP sequences were: repetition time (TR) = 3.3 ms, echo time (TE) = 1.3 ms, flip angle = 50°, slice thickness = 8 mm, field-of-view (FOV) = 38 cm × 22 cm, acquisition matrix size = 216×224, acceleration factor = 2, views per segment = 18, and acquisition time = 7 s in a single breath hold.
For en face visualization of the aortic valve, the 3-chamber view was used to prescribe a slice orthogonal to the outflow tract of the aorta (11). The key acquisition parameters of the get-SPEEDI sequence were: TR = 20 ms, TE = 3 ms, flip angle = 10°, slice thickness = 8 mm, FOV = 22 cm × 22 cm, reconstruction matrix size = 118 × 118, esp = 0.6 ms, L = 30–36, N = 16, total number of k-space lines M = 80, m = 2, and acquisition time = 160 heart beats (~3–4 minutes). The first trigger delay (delay 1) was set at 12 ms, which was the minimal value allowed by the scanner. The duration of each acquisition block, Tblock, was 9.6 ms (N × esp), which required the second trigger delay (delay 2) to be 9.6 ms after the first trigger delay to cover the gap between two adjacent acquisition blocks. Hereafter, we refer to this sequence as get-SPEEDI-0.6ms.
For comparison, images from the same en face plane were acquired using a commercial bSSFP sequence with two temporal resolutions of 12 ms (bSSFP-12ms) and 24 ms (bSSFP-24ms) that were similar to what is typically used clinically. The imaging parameters for the bSSFP-12ms and bSSFP-24ms were identical to those used in the get-SPEEDI sequence, except for TR = 3.2 ms, TE = 1.3 ms, flip angle = 50°, acquisition matrix size = 216 × 112, views per segment = 8 and 4, respectively.
To manage respiratory motion, breath holds were used in all three pulse sequences. The respiratory motion was monitored through a bellows to ensure that different breath holds were consistent at the same location in the tidal wave. For the get-SPEEDI-0.6ms acquisition, 8–10 breath holds were employed depending on the individuals’ respiratory pattern and heart rate. The typical duration of each breath hold was between 15 and 20 seconds. For the bSSFP-12ms and bSSFP-24ms acquisitions, single-breath and two-breath holds were used, corresponding to the scan times of ~12–15 s and ~25–30 s, respectively.
MR Image Reconstruction and Analysis
The acquired k-space data from the get-SPEEDI sequence were reconstructed offline using customized Matlab programs (MathWorks, Inc., Natick, MA). Images from each coil channel were first reconstructed and then combined using a sum-of-squares algorithm. Following reconstruction, the images were ordered according to the strategies depicted in Fig. 2 to produce a time series. The images from the bSSFP sequences were reconstructed using software provided by the scanner manufacturer.
On each image in the time-series, the planimetric aortic valve area (AVA) was extracted as a quantitative measure to monitor the dynamic change of the aortic valve. A coarse region of interest (ROI) was first manually drawn within the aortic valve (Fig. 3, blue contour). The coarse ROI was automatically refined by an active contour detection algorithm (12), which was capable of determining the edge of the aortic valve (Fig. 3, red contour). The detected edge was subsequently used as the initial ROI for the next frame to extract AVA. To limit the errors that might be accumulating throughout the frames, multiple initial ROIs were drawn at an interval of every 100 frames. The AVAs in all frames were plotted as a function of time, together with the contemporaneously acquired ECG waveform. This process was applied to image sets acquired from each of the three sequences: get-SPEEDI-0.6ms, bSSFP-12ms, and bSSFP-24ms.
Figure 3.
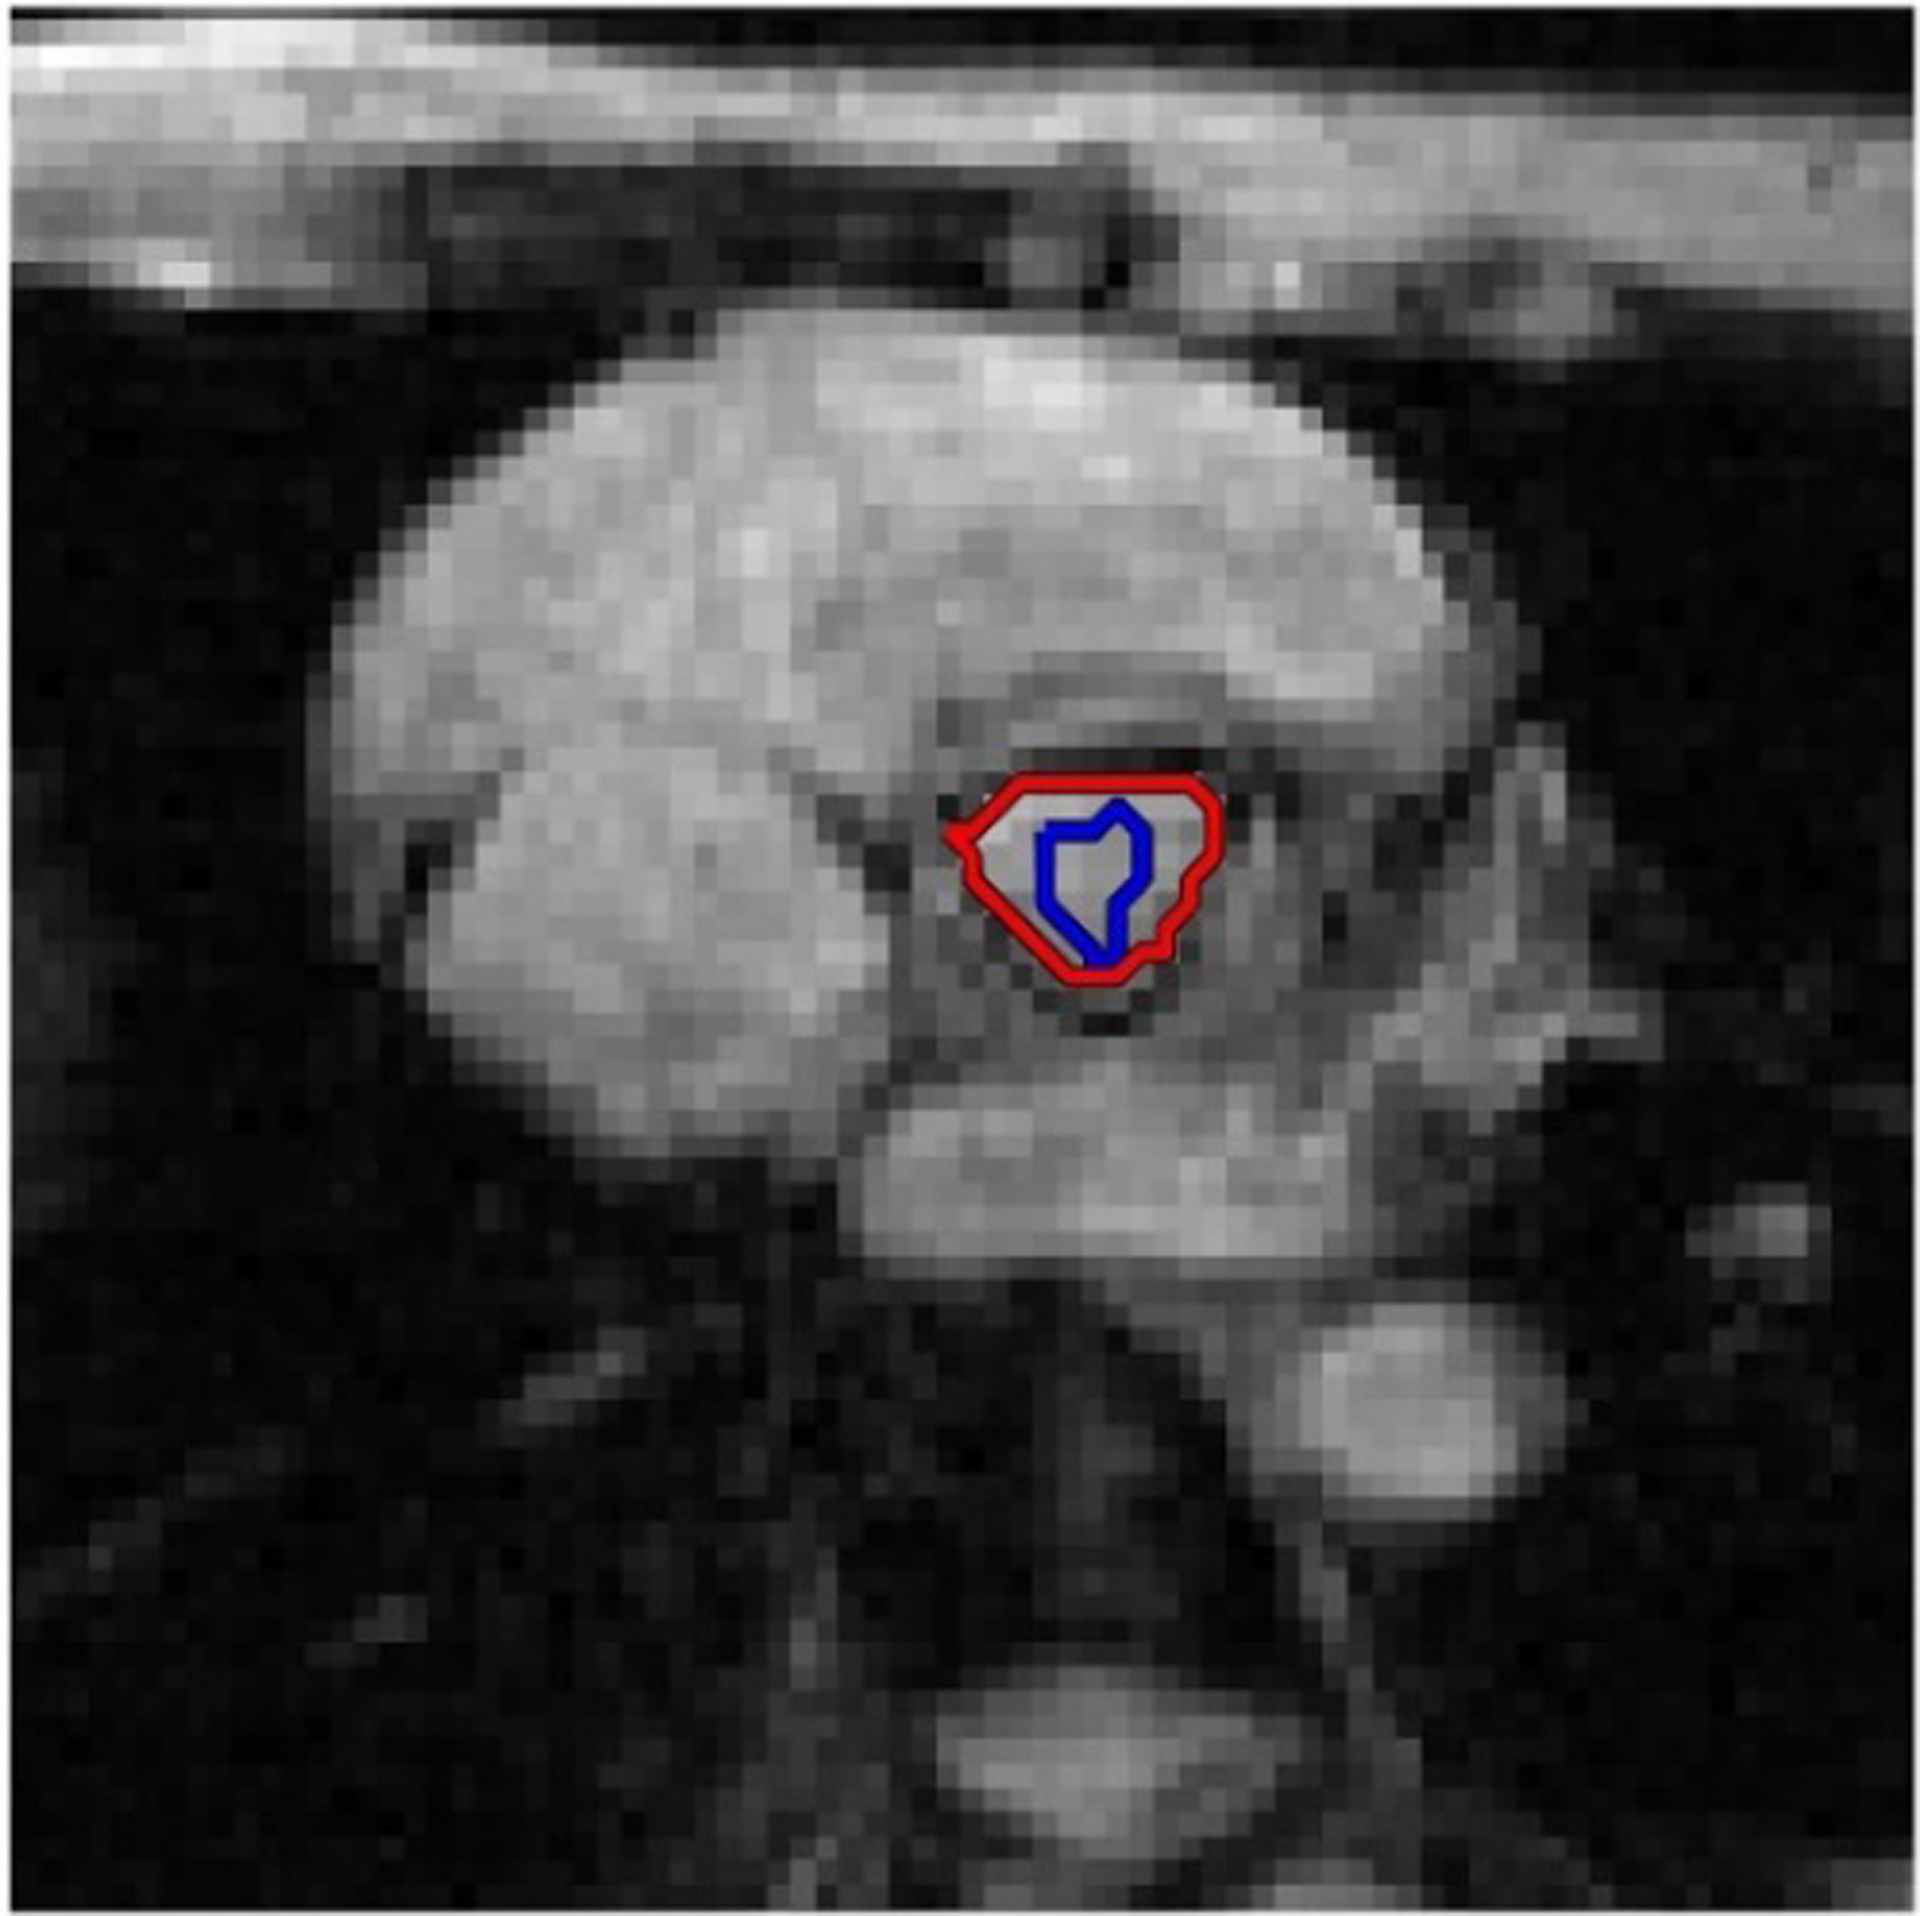
Illustration of the aortic valve area (AVA) extraction process. A coarse region of interest (ROI) was first manually drawn within the aortic valve (blue contour). The coarse ROI was automatically refined by an active contour detection algorithm (12), which was capable of determining the edge of the aortic valve (red contour). The detected edge was subsequently used as the initial ROI for the next frame for AVA extraction.
From the AVA curves, the durations of the rapid opening (Tro), slow closing (Tsc), and rapid closing (Trc) phases, as well as the entire duration and the maximal AVA, were determined for each of the three sequences and each of the twelve subjects. Specifically, the start point of the rapid opening phase and the end point of the rapid closing phase were chosen as the points where the AVA began to ascend from zero and returned to zero, respectively. The end point of the rapid opening phase was selected as the point where the maximal AVA occurred. The start point of the rapid closing phase was determined by taking the second derivative of the AVA curve. The slow closing phase was in-between the end of rapid opening and the beginning of rapid closing phases. To account for differences in subject size, the maximal AVA was normalized to the subject height in the comparisons (13).
Ultrasound Echocardiography
To obtain an independent measurement of the dynamics of aortic valve opening and closing, 2D cross-sectional ultrasound images and 1D M-mode echocardiography were performed on seven of the twelve subjects enrolled in the study. All transthoracic ultrasound scans were carried out on an iE33 ultrasound system (Philips Healthcare, Best, the Netherlands) with a frame rate of 66 Hz for 2D cross-sectional B-mode, and 1.25 kHz for 1D M-mode. The latter corresponded to a temporal resolution of 0.8 ms, which was comparable to the temporal resolution of get-SPEEDI-06ms and used for the image analysis.
From the M-mode echocardiogram, the duration of each different phase of aortic valve opening and closing was determined in a manner similar to those described above for the AVA curves measured by the three MRI sequences. The measurements of the durations were accomplished by using RadiAnt DICOM Viewer (Version 2020.2. Jul 19, 2020. URL: https://www.radiantviewer.com). On each subject, the measurement was performed by averaging over three cardiac cycles for each of the three phases (rapid opening, slow closing, and rapid closing) as well as the entire opening-closing process.
Statistical Analysis
To quantitatively determine the effect of different temporal resolutions on the aortic valve dynamics measurement, the durations of the three phases and the maximal AVA/height were compared between the sequences with different temporal resolutions using a Mann–Whitney U test. Bonferroni correction was performed for multiple comparisons between the get-SPEEDI-0.6ms and bSSFP-12ms acquisitions, and between get-SPEEDI-0.6ms and bSSFP-24ms acquisitions, with statistical significance set to p < 0.05. In addition, the durations of difference phases were also compared between get-SPEEDI-0.6ms and ultrasound echocardiography.
Results
The mean age of the twelve subjects for MRI scan was 30.4±5.0 years with a heart rate of 66.3±6.4 beats/min, which was not significantly different from that of the seven subjects receiving ultrasound echocardiography (age: 30.1±3.9 years, p = 0.938; heart rate: 70.2±5.3 beats/min, p = 0.076).
Figure 4 shows a set of time-resolved get-SPEEDI-0.6ms images during the rapid opening (Fig. 4A) and rapid closing (Fig. 4B) phases of the aortic valve from a representative subject. A movie showing the entire opening-closing process of aortic valve from the subject is provided in the Supporting Information. The entire opening-closing process of aortic valve is shown in the time evolution plot of the AVA (Fig. 5), together with the corresponding ECG waveform.
Figure 4.

Multiple frames showing the dynamics during the rapid opening (A) and closing (B) phases of the aortic valve of a healthy human subject (30-year-old male), captured with a temporal resolution of 0.6 ms using a get-SPEEDI sequence. The en face aortic valve view is shown within the red boxes, where the three cusps of aortic valve are clearly visible. The first frame was acquired at 42 ms in (A) and 322 ms in (B), respectively, following an electrocardiogram (ECG) trigger. Additional magnified views can be found in Fig. S1 of Supplementary Information.
Figure 5.

A plot of the time evolution of the aortic valve area (AVA) measured by get-SPEEDI with a temporal resolution of 0.6 ms (black) from the subject in Fig. 4, together with the electrocardiogram (ECG) waveform in light blue. The entire process of opening and closing of the aortic valve consists of three phases: a rapid opening phase (Tro = 19 ms), a slow closing phase (Tsc = 268 ms), and a rapid closing phase (Trc = 47 ms), as shown by the red dash lines. The opening process started immediately after the QRS-complex, and the closing process ended after the T-wave, as reported using an alternative method (29). The vertical line on the ECG indicates when trigger occurs, which also defined the t = 0 ms time point.
Figure 6A shows the comparison of three AVA curves obtained with get-SPEEDI-0.6ms, bSSFP-12ms, and bSSFP-24ms from another representative healthy subject. Although the three curves exhibited similar trends and a similar overall duration between opening and closing of the aortic valve, the curve from get-SPEEDI-0.6ms revealed more details than the other two curves from bSSFP-12ms and bSSFP-24ms, particularly during the rapid opening and rapid closing phases. In the rapid opening phase during which the aortic valve opened maximally, an overshoot was observed in the AVA curve with get-SPEEDI-0.6ms, but not with bSSFP-12ms or bSSFP-24ms. The overshoot was confirmed by the corresponding M-mode echocardiography (Fig. 6B). Such overshoot has also been well reported in the literature (14,15). Figure 6C further illustrates a correlation of the three different phases of the aortic valve opening and closing between SPEEDI-based MRI results (Fig. 6A) and the M-mode echocardiogram.
Figure 6.

(A): Comparison of the aortic valve area (AVA) time-evolution curves obtained with three different temporal resolutions from a representative healthy subject (24-year-old male). Although the three phases of aortic valve opening and closing were observable in all three curves with similar trends and a similar overall duration, the curve from the get-SPEEDI sequence (red) revealed more details than the other two curves from the bSSFP sequences (green and blue), particularly during the rapidly opening and rapidly closing phases (black circles). Importantly, an overshoot was observed only with get-SPEEDI. This overshoot is evident in the M-mode echocardiogram and well reported in the literature (14,15). (B): The corresponding 2D cross-sectional B-mode ultrasound image (frame rate = 66 Hz; upper frame) and the 1D M-mode echocardiogram showing one cardiac cycle (1.25 kHz; temporal resolution = 0.8 ms; lower frame), where the rapid opening phase, the rapid closing phase, and an overshoot close to the end of the rapid opening were qualitatively demonstrated. (C): A magnified view of the 1D M-mode echocardiogram in (B), with the duration of each phase labeled by the red underlines. The timings of the aortic valve opening and closing phases were quantitatively measured, which further illustrate a good correlation of the three different phases of the aortic valve opening and closing between SPEEDI-based MRI results (A) and the M-mode echocardiogram. The group-based quantitative results are summarized in Table 1.
Table 1 summarizes the dynamics of the opening and closing processes of the aortic valve measured by the three MRI sequences, as well as ultrasound echocardiography. The maximal AVA/height measured by get-SPEEDI-0.6ms (2.01±0.29 cm2/m) was significantly larger than that measured by bSSFP-12ms (1.63±0.28 cm2, p < 0.05) or bSSFP-24ms (1.65±0.32 cm2/m, p < 0.05). The entire opening-closing periods measured by bSSFP-12ms (318.4±29.0 ms), and bSSFP-24ms (337.1±21.2 ms) were not significantly different from that measured by get-SPEEDI-0.6ms (323.0±29.1 ms; p = 0.84 and p = 0.35, respectively). However, the rapid valve opening time (Tro = 27.5±6.7 ms) and rapid valve closing time (Trc = 43.8±11.6 ms) measured by get-SPEEDI-0.6ms were both significantly shorter than those measured using either bSSFP sequence with a lower temporal resolution (12ms: Tro = 56.3±18.8 ms and Trc = 68.2±16.6 ms, p < 0.05; 24ms: Tro = 63.8±20.2 ms and Trc = 72.8±18.2 ms, p < 0.05). Importantly, Table 1 further illustrates that get-SPEEDI-0.6ms matched well with M-mode ultrasound echocardiography (temporal resolution = 0.8 ms) in revealing the durations of all three phases, especially the rapid opening and rapid closing phases (Tro = 27.5±6.7 vs. 29.0±4.1 ms, p = 0.79; Trc = 43.8±11.6 vs. 41.6±4.3 ms, p = 0.16). In contrast, the results from the two bSSFP sequences differed substantially from those obtained with ultrasound echocardiography.
Table 1.
Aortic valve phase durations and the maximal aortic valve area (AVA) measurements from MR sequences with different temporal resolutions and ultrasound.
| get-SPEEDI-0.6ms | bSSFP-12ms | bSSFP-24ms | Ultrasound Echocardiography | p-value | |||
|---|---|---|---|---|---|---|---|
| 0.6 vs. 12 ms | 0.6 vs. 24 ms | 0.6 vs. Ultrasound | |||||
| Rapid opening (Tro, ms) | 27.5±6.7 | 56.3±18.8 | 63.8±20.2 | 29.0±4.1 | <0.001 | <0.001 | 0.789 |
| Slow closing (Tsc, ms) | 237.3±37.6 | 193.9±50.0 | 198.9±35.9 | 229.8±15.6 | 0.08 | 0.051 | 0.837 |
| Rapid closing (Trc, ms) | 43.8±11.6 | 68.2±16.6 | 72.8±18.2 | 41.6±4.3 | <0.001 | <0.001 | 0.160 |
| Total (ms) | 323.0±29.1 | 318.4±29.0 | 337.1±21.2 | 300.4±18.2 | 0.84 | 0.35 | 0.066 |
| AVA (cm2) | 3.40±0.54 | 2.77±0.53 | 2.80±0.61 | - | 0.02 | 0.03 | - |
| AVA/height (cm2/m) | 2.01±0.29 | 1.63±0.28 | 1.65±0.32 | - | 0.01 | 0.02 | - |
Note: SPEEDI (sub-millisecond periodic event encoded dynamic imaging); get-SPEEDI (gradient-echo-train-based SPEEDI); bSSFP (balanced steady-state free precession).
p-Values shown in bold font indicate significant differences after performing a Bonferroni correction.
Discussion
In our study, we demonstrated a potential 2D application of get-SPEEDI for capturing ultrafast, cyclic biological events with a sub-millisecond temporal resolution. Using get-SPEEDI, we were able to visualize the opening and closing of the human aortic valve with a temporal resolution of 0.6 ms. Compared to conventional bSSFP sequences with lower temporal resolutions, get-SPEEDI provided additional temporal information (e.g., the overshoot), particularly during the rapid opening and rapid closing phases, and revealed shorter durations of these two phases as well as a larger maximal AVA normalized to height.
Unlike traditional fast MRI techniques, get-SPEEDI achieves an ultra-high temporal resolution not by accelerating k-space traversal speed, but by minimizing the inter-echo spacing in a train of gradient echoes. This approach has resulted in a drastic improvement in temporal resolution by 2–4 orders of magnitude, making sub-millisecond MRI possible. Compared with FID-based SPEEDI (7,8), get-SPEEDI trades the temporal resolution for substantially shortened scan times (e.g., 64-fold), yet still maintains the sub-millisecond capability, which can be particularly useful when ultra-fast temporal resolution (e.g., ~50 μs) is not necessary.
The three phases of aortic valve opening and closing have been well investigated in animals and humans using echocardiography or X-ray (1,16–18). Despite its advantages in spatial resolution, blood flow quantitation, tissue characterization, and absence of ionizing radiation, MRI has limited applications to imaging valvular diseases largely due to inadequate temporal resolution. Even with fast sequences such as bSSFP, the limited temporal resolution likely led to the overestimation of the rapid opening and closing durations we observed (Tro of 56.3 ms and 63.8 ms, Trc of 68.2 ms and 72.8 ms for 12ms and 24ms temporal resolutions, respectively), as compared to echocardiographic values (Tro of 29.0 ms and Trc of 41.6 ms). With its sub-millisecond temporal resolution, get-SPEEDI produced aortic valve opening and closing durations (Tro of 27.5 ms and Trc of 43.8 ms) that were more consistent with the values from echocardiography performed in this study as well as reported in other studies (Tro and Trc of ~30 ms and ~50 ms, respectively) (14,17). Additionally, a short duration of overshoot (~15 ms) was observed only by get-SPEEDI when the aortic valve opened maximally. This overshoot, likely caused by the vortex formed in the sinuses (19), was observed in the M-mode echocardiogram in this study and reported by others (14,15), but was missed by the two bSSFP sequences with an inferior temporal resolution.
The maximal AVA normalized to the height is a robust parameter for defining high risk in asymptomatic aortic stenosis as suggested by previous studies (13,17). get-SPEEDI measured a maximal AVA/height (2.01±0.29 cm2/m) that was significantly larger than those obtained using bSSFP (1.63±0.28 cm2 and 1.65±0.32 cm2/m for 12ms and 24 ms temporal resolutions, respectively), and closer to what was reported in the literature (2.18 ± 0.68 cm2/m) (20). The reason was not likely related to the temporal resolution difference, as down-grading the temporal resolution of the get-SPEEDI dataset did not alter the results (see Table S1 in Supporting Information). It may be attributed to other factors such as the discernibility of the edge when detecting the AVA, different image contrast between bSSFP and get-SPEEDI, or possible physiological variations. The actual cause requires further investigation.
Limitations
First, despite the substantially decreased scan times in get-SPEEDI compared to FID-based SPEEDI, the acquisition time remains longer than many other cardiac MRI sequences, such as bSSFP, and other modalities, such as echocardiography and CT, leading to multiple breath holds and potential position inconsistency between breath holds. This problem can be mitigated by incorporating respiratory navigating technique or k-space acceleration techniques, such as SENSitivity Encoding (SENSE) (21), GeneRalized Auto-calibrating Partial Parallel Acquisition (GRAPPA) (22), and Compressive Sensing (CS) (23). A recent study (24) has demonstrated that the acquisition time of get-SPEEDI can be shortened by 50% using random k-space undersampling and image reconstruction based on joint spatiotemporal partial separability and sparsity constraints (25). Because the scan times of get-SPEEDI were already long, we did not attempt to compare get-SPEEDI with FID-based SPEEDI which would require an even longer scan time. Second, the spatial resolution of get-SPEEDI (1.8 mm × 1.8 mm × 8 mm) was lower than that of ultrasound echocardiography and CT. The spatial resolution, however, can be improved by combining get-SPEEDI with other techniques such as reduced FOV without compromising the temporal resolution or the scan times (26). Third, the T2* decay throughout the echo train can lead to varying image contrast throughout the time series, which may potentially be a problem in tissues with short T2* values. Should T2* decay become problematic, T2* mapping and (or) T2* correction techniques can be employed for mitigation (27). Fourth, the AVA was measured from only one slice, which may lead to underestimation (4). A multi-slice acquisition can help alleviate this issue by employing simultaneous multi-slice imaging without increasing the acquisition time (28). Finally, the present study enrolled only healthy subjects. The performance of get-SPEEDI on patients with irregular heartbeat remains to be demonstrated. However, given the reported resilience of SPEEDI to variations in periodicity of a cyclic event (e.g., SPEEDI continued working well even with 50% trigger timing variations as demonstrated in (8)), get-SPEEDI is expected to perform well under conditions such as arrythmia, turbulent flow, and other cardiac pathologies.
Conclusion
We have demonstrated a sequence – get-SPEEDI – to visualize human aortic valve dynamics with a temporal resolution of 0.6 ms. With get-SPEEDI, the different phases of aortic valve opening and closing have been be measured and found consistent with those measured using ultrasound. This technique may be useful for the evaluation of valvular diseases, such as stenosis and regurgitation, that have been conventionally studied using echocardiography.
Supplementary Material
Acknowledgements
This work was supported in part by the National Institutes of Health under award numbers 5R01EB026716-01 and 1S10RR028898. The content is solely the responsibility of the authors and does not necessarily represent the official views of the National Institutes of Health. The authors would like to thank Dr. Karen L. Xie and Mr. Jianping Han for their assistance with transthoracic echocardiography.
Financial Interest and Grant Support:
Xiaohong Joe Zhou is a consultant to General Electric Healthcare. For the remaining authors none were declared. This work was supported in part by grants from the National Institutes of Health (NIH 1S10RR028898 and NIH R01EB026716).
Abbreviations:
- AVA
aortic valve area
- bSSFP
balanced steady-state free precession
- ECG
electrocardiogram
- FID
free induction decay
- get
gradient echo train
- RF
radio frequency
- ROI
regions of interest
- SPEEDI
sub-millisecond periodic event encoded dynamic imaging
References:
- 1.Leyh RG, Schmidtke C, Sievers H-H, Yacoub MH. Opening and Closing Characteristics of the Aortic Valve After Different Types of Valve-Preserving Surgery. Circulation. 1999;100(21):2153–2160. doi: 10.1161/01.CIR.100.21.2153. [DOI] [PubMed] [Google Scholar]
- 2.Fries R, Graeter T, Aicher D, et al. In vitro comparison of aortic valve movement after valve-preserving aortic replacement. J Thorac Cardiovasc Surg. 2006;132(1):32–37. doi: 10.1016/j.jtcvs.2006.02.034. [DOI] [PubMed] [Google Scholar]
- 3.Arjunon S, Rathan S, Jo H, Yoganathan AP. Aortic Valve: Mechanical Environment and Mechanobiology. Ann Biomed Eng. 2013;41(7):1331–1346. doi: 10.1007/s10439-013-0785-7. [DOI] [PMC free article] [PubMed] [Google Scholar]
- 4.Kupfahl C Evaluation of aortic stenosis by cardiovascular magnetic resonance imaging: comparison with established routine clinical techniques. Heart. 2004;90(8):893–901. doi: 10.1136/hrt.2003.022376. [DOI] [PMC free article] [PubMed] [Google Scholar]
- 5.Pouleur A-C, le Polain de Waroux J-B, Pasquet A, Vancraeynest D, Vanoverschelde J-LJ, Gerber BL. Planimetric and continuity equation assessment of aortic valve area: Head to head comparison between cardiac magnetic resonance and echocardiography. J Magn Reson Imaging. 2007;26(6):1436–1443. doi: 10.1002/jmri.21182. [DOI] [PubMed] [Google Scholar]
- 6.Krishnamurthy R, Pednekar A, Cheong B, Muthupillai R. High temporal resolution SSFP cine MRI for estimation of left ventricular diastolic parameters. J Magn Reson Imaging. 2010;31(4):872–880. doi: 10.1002/jmri.22123. [DOI] [PubMed] [Google Scholar]
- 7.Zhong Z, Karaman MM, Zhou XJ. MRI with Sub-Millisecond Temporal Resolution: An Example Employing Spatially Resolved Eddy Current Characterization. ISMRM2019. Montreal; P0247.
- 8.Zhong Z, Sun K, Karaman MM, Zhou XJ. MRI with Sub-Millisecond Temporal Resolution. Magn Reson Med. 2021;85(5):2434–2444. doi: 10.1002/mrm.28588. [DOI] [PMC free article] [PubMed] [Google Scholar]
- 9.Mosca L, Barrett-Connor E, Kass Wenger N. Sex/Gender Differences in Cardiovascular Disease Prevention: What a Difference a Decade Makes. Circulation. 2011;124(19):2145–2154. doi: 10.1161/CIRCULATIONAHA.110.968792. [DOI] [PMC free article] [PubMed] [Google Scholar]
- 10.Bernstein MA, King KF, Zhou XJ. Handbook of MRI pulse sequences. Amsterdam: Elsevier, Academic Press; 2004. [Google Scholar]
- 11.Society for Cardiovascular Magnetic Resonance, Board of Trustees Task Force on Standardized Protocols, Kramer CM, et al. Standardized cardiovascular magnetic resonance (CMR) protocols 2013 update. J Cardiovasc Magn Reson. 2013;15(1):91. doi: 10.1186/1532-429X-15-91. [DOI] [PMC free article] [PubMed] [Google Scholar]
- 12.Chan TF, Vese LA. Active contours without edges. IEEE Trans Image Process. 2001;10(2):266–277. doi: 10.1109/83.902291. [DOI] [PubMed] [Google Scholar]
- 13.Tribouilloy C, Bohbot Y, Maréchaux S, et al. Outcome Implication of Aortic Valve Area Normalized to Body Size in Asymptomatic Aortic Stenosis. Circ Cardiovasc Imaging. 2016;9(11):e005121. doi: 10.1161/CIRCIMAGING.116.005121. [DOI] [PubMed] [Google Scholar]
- 14.Laniado S, Yellin E, Terdiman R, Meytes I, Stadler J. Hemodynamic correlates of the normal aortic valve echogram. A study of sound, flow, and motion. Circulation. 1976;54(5):729–737. doi: 10.1161/01.CIR.54.5.729. [DOI] [PubMed] [Google Scholar]
- 15.van Steenhoven AA, Veenstra PC, Reneman RS. The effect of some hemodynamic factors on the behaviour of the aortic valve. J Biomech. 1982;15(12):941–950. doi: 10.1016/0021-9290(82)90012-4. [DOI] [PubMed] [Google Scholar]
- 16.Handke M, Heinrichs G, Beyersdorf F, Olschewski M, Bode C, Geibel A. In vivo analysis of aortic valve dynamics by transesophageal 3-dimensional echocardiography with high temporal resolution. J Thorac Cardiovasc Surg. 2003;125(6):1412–1419. doi: 10.1016/S0022-5223(02)73604-0. [DOI] [PubMed] [Google Scholar]
- 17.Higashidate M, Tamiya K, Beppu T, Imai Y. Regulation of the aortic valve opening. J Thorac Cardiovasc Surg. 1995;110(2):496–503. doi: 10.1016/S0022-5223(95)70246-6. [DOI] [PubMed] [Google Scholar]
- 18.Thubrikar MJ, Heckman JL, Nolan SP. High speed cine-radiographic study of aortic valve leaflet motion. J Heart Valve Dis. 1993;2(6):653–661. [PubMed] [Google Scholar]
- 19.Bellhouse B, Bellhouse F. Fluid mechanics of model normal and stenosed aortic valves. Circ Res. 1969;25(6):693–704. [PubMed] [Google Scholar]
- 20.Hofmann T, Kasper W, Meinertz T, Spillner G, Schlosser V, Just H. Determination of aortic valve orifice area in aortic valve stenosis by two-dimensional transesophageal echocardiography. Am J Cardiol. 1987;59(4):330–335. doi: 10.1016/0002-9149(87)90808-3. [DOI] [PubMed] [Google Scholar]
- 21.Pruessmann KP, Weiger M, Scheidegger MB, Boesiger P. SENSE: sensitivity encoding for fast MRI. Magn Reson Med. 1999;42(5):952–962. [PubMed] [Google Scholar]
- 22.Griswold MA, Jakob PM, Heidemann RM, et al. Generalized autocalibrating partially parallel acquisitions (GRAPPA). Magn Reson Med. 2002;47(6):1202–1210. doi: 10.1002/mrm.10171. [DOI] [PubMed] [Google Scholar]
- 23.Lustig M, Donoho D, Pauly JM. Sparse MRI: The application of compressed sensing for rapid MR imaging. Magn Reson Med. 2007;58(6):1182–1195. doi: 10.1002/mrm.21391. [DOI] [PubMed] [Google Scholar]
- 24.Luo Q, Zhong Z, Sun K, Zhou XJ. Accelerated Ultrahigh Temporal-Resolution MRI with Random k-Space Undersampling. ISMRM2021. Online; P0834.
- 25.Zhao B, Haldar JP, Christodoulou AG, Liang Z-P. Image reconstruction from highly undersampled (k, t)-space data with joint partial separability and sparsity constraints. IEEE Trans Med Imaging. 2012;31(9):1809–1820. doi: 10.1109/TMI.2012.2203921. [DOI] [PMC free article] [PubMed] [Google Scholar]
- 26.Zhong Z, Merkitch D, Karaman MM, et al. High-Spatial-Resolution Diffusion MRI in Parkinson Disease: Lateral Asymmetry of the Substantia Nigra. Radiology. 2019;291(1):149–157. doi: 10.1148/radiol.2019181042. [DOI] [PMC free article] [PubMed] [Google Scholar]
- 27.Zhou X, Liang Z-P, Cofer GP, Beaulieu CF, Suddarth SA, Johnson GA. Reduction of ringing and blurring artifacts in fast spin-echo imaging. J Magn Reson Imaging. 1993;3(5):803–807. doi: 10.1002/jmri.1880030518. [DOI] [PubMed] [Google Scholar]
- 28.Poser BA, Setsompop K. Pulse sequences and parallel imaging for high spatiotemporal resolution MRI at ultra-high field. NeuroImage. 2018;168:101–118. doi: 10.1016/j.neuroimage.2017.04.006. [DOI] [PMC free article] [PubMed] [Google Scholar]
- 29.Ostadfar A Biofluid Dynamics in Human Organs. Biofluid Mech. Elsevier; 2016. p. 111–204. doi: 10.1016/B978-0-12-802408-9.00004-1. [DOI] [Google Scholar]
Associated Data
This section collects any data citations, data availability statements, or supplementary materials included in this article.