

Abstract
Purpose
Omega-3 fatty acids have been shown to reduce the incidence and slow the growth of mammary gland cancer in rodent models. Since exposure to dietary components during the critical developmental times of gestation and lactation may alter risk for mammary gland cancer in females, we tested whether exposure to increased levels of long-chain omega-3 fatty acids from fish oils would be preventive or promotional to mammary gland cancer in the offspring.
Methods:
Normal SV129 female mice were fed AIN 76 diets containing either 10% corn oil (control, 50% omega 6, n-6) or 5% of an omega-3 (n-3) fatty acid concentrate (fish oil 60% n-3) + 5% canola oil (10% n-3 + 20% n-6). Females were then mated with C(3)1 TAg transgenic mice. At weaning (3 weeks), pups were randomized to either the corn (C) or fish oil (F) diet, 15–17 mice per group. Four experimental groups were generated: FF, FC, CF and CC. Tumor incidence and multiplicity were assessed at the following time points 120, 130 and 140 days of age. A panel of genes encoding signal transduction proteins were analyzed in mammary glands at 130 days.
Results:
Mice never exposed to fish oil (CC group) had a significantly higher incidence and multiplicity of mammary gland tumors than mice exposed to fish oil throughout life (FF group). Mice exposed to fish oil during a portion of life (CF or FC) had intermediate tumor incidences and multiplicities. Results also indicate that maternal consumption of fish oil increased the expression of genes associated with immune system activation (Ccl20, Cd5, Il2, Lef1, Lta).
Conclusions:
Adequate omega-3 fatty acids in the maternal diet may reduce the risk for mammary gland cancer in the offspring. If humans make dietary change by consuming more omega-3 fat instead of corn oil with 0% omega 3 fat, breast cancer may be reduced in the next generation.
Keywords: omega 3, mammary gland, cancer prevention, mouse model
Introduction
A comprehensive report published in 2018 by World Cancer Research Fund (WCRF) and American Institute for Cancer Research (AICR) under Continuous Update Project (CUP) states that over 2 million new cases of breast cancer were diagnosed in 2018 [1]. Based on the report, countries with the highest incidence rates of breast cancers are in Europe, Oceania and North America. The report stresses that overweight is an increased risk factor for breast cancer development. In this context, food intake becomes an essential player in slowing or increasing the risk for breast cancer development. A diversity of approaches involving food (e.g., nuts, veggies, fruits, spices) [2–5], food components (e.g., fat, vitamins, minerals) [6, 7] and dietary supplements (e.g., quercetin, curcumin, resveratrol) [8–10] are recognized as complementary methodologies in cancer prevention and treatment. It is recognized that the maternal diet during pregnancy impacts the mammary gland health of offspring in animal models [11–15]. The impact of in utero high-fat exposure is not limited only to the mammary glands [15, 16]. It is well known that dietary fat also affects the development of the immune system [15, 17, 18]. Human studies are coming along and supporting the positive impact of omega-3 (n-3) FA (EPA (eicosapentaenoic acid) and DHA (docosahexaenoic acid)) supplemented maternal diet on the infants’ immune system development [19]. The fish oil supplemented maternal diet (during late pregnancy and/or lactation) and feeding infant formula enriched in ARA (arachidonic acid) and DHA seems to alter the immune function markers in a direction that is beneficial for the infant’s health in the first year of life [19]. The beneficial effect of n-3 FA on the immune system development and lowering inflammation is associated with a decreased risk of breast cancer development [20–22]. Conversely, in many studies, high levels of n-6 FA are associated with inflammation, increased risk of obesity and the development of mammary tumors [11, 23, 24]. The questions are: 1. How efficient is a diet rich in n-3 FA consumed by mother and/or offspring to reduce the incidence of breast tumors when compared with a diet high in n-6 FA consumed by both mother and offspring? 2. If the diet of the mother is rich in n-6 fats and the offspring have a rich n-3 FA diet to what extend can this lower the risk of developing mammary tumors in the offspring? In this study, we chose a mixture of fish oil (to provide premade long-chain n-3 FAs) and canola oil (18C, n-3 FA and less of the essential n-6 linoleic acid than corn oil) as a source of n-3 FA. The beneficial effect of fish oil intake can rely on less active inflammatory response, production of anti-inflammatory molecules, inhibition of nuclear factor-κB and decreased signalling through growth factor receptor [21, 25, 26]. Animal models offer a handy approach to overcome the tremendous challenge of following up the effects of maternal/early life infant diet on the adult long-term health.
Methods
Animals
Forty-six female SV 129 mice, at 6 weeks of age, were obtained from Charles River Laboratories (Wilmington, MA). Mice that bear a transgene for the SV40 large T antigen with a C3(1) rat prostatic steroid binding protein promoter were obtained from Dr. Jeffrey Green for breeding. The hemizygous female transgenic mice are expected to develop mammary gland cancer due to expression of the large T antigen in the mammary gland [27]. The transgenic line was maintained in the laboratory and all experimental mice were genotyped to ensure presence of the transgene [28]. All animal work was approved by the Marshall University School of Medicine Institutional Animal Care and Use Committee.
Study design
Mice were quarantined for 2 weeks, and then moved to a study room. SV129 females were split into two groups and numbered for identification. Twenty-three female mice were placed on a diet containing 10% w/w corn oil (high n-6, control diet) [28] and 23 female mice were placed on a diet containing 5% w/w fish oil concentrate + 5% canola oil w/w (high n-3 diet, test diet). After 2 weeks, these females were bred with homozygous C3(1)/TAg male mice. The hemizygous female pups from these breedings were the experimental mice NOT the wild-type mother mice. Pups were weaned at 21 days old and placed on the two diets resulting in four experimental groups: corn/corn (CC); corn/fish (CF); fish/corn (FC) and fish/fish (FF) (the first diet is the maternal diet and the second diet is the pup’s diet). Mice that were not exposed to an n-3 diet at any time are considered the baseline controls. The offspring were housed three to four in a cage, individually numbered for identification, and weighed weekly.
Diet
Diets were prepared in the Marshall University School of Medicine animal diet prep room. Diets were based on the AIN-76A formula and only the fat content was altered to obtain a 10% by weight total fat [28]. The diets were isocaloric and isonutrient, and are relevant to human consumption. The dry ingredients of the diet, except sugar, were obtained in bulk from MP Biomedicals (Solon, Ohio). Omega-3 concentrates from fish oil (containing 60% EPA and DHA) were obtained from Zone Labs Inc. (Danvers, MA). Sugar and oil (100% canola oil and 100% corn oil) were obtained locally. Diets were prepared in batches as needed. The diet mixture was pressed into trays and cut into small squares. Individual cage sized portions (25–30 g) were stored in sealed containers at −20°C to prevent oxidation of the fat and bacterial growth in the food. Mice had free access to food and water and were fed fresh food daily. Food removed from cages was discarded.
Assessment of transgene copy number
Ear punches stored at −20°C were digested as previously described [28]. The presence of SV40 Tag transgene was assessed by real-time PCR method, using an ABI Prism 7000 instrument (Applied Biosystems, Foster City, CA).
Body weights
Body weights were recorded each week (data not shown) and terminally.
Necropsy
Mice were euthanized at 120, 130, 140 days of age. The left 4th mammary gland was quickly removed and frozen in liquid nitrogen. All ten mammary glands were examined for the presence of a tumor 1 mm or larger. All tumors detected were measured, removed and weighed, thus total tumor weight and numbers include many tumors that were too small to be detected by palpation. The number of tumors in each gland and the number of glands with tumor were recorded for every mouse. Samples of inguinal fat and liver were removed and frozen in liquid nitrogen until further analyses.
Whole mount mammary glands of C3(1)TAG/129 female mice: glands were flattened, fixed and defatted in xylene then stained with hematoxylin and eosin [29, 30]. The pictures were taken using a 2.5X objective on a Zeiss microscope and a zoom factor of 100 on the Kodak digital camera.
Fatty acid composition
The fatty acid composition of mammary glands, liver and fat pad at 130 days was analyzed by gas chromatography. Frozen tissues were thawed and homogenized in distilled water containing 0.1% BHT to prevent oxidation of the fatty acids. Lipids were extracted with chloroform/methanol, and the fatty acids were methylated followed by separation and identification using gas chromatography. Briefly, gas chromatography was performed using a PerkinElmer Clarus 500 Gas Chromatograph (Shelton, CT) with an Elite-WAX Polyethylene Glycol Capillary Column (Length: 30m, Inner Diameter: 0.53mm), at 220°C for 100 min with a helium carrier gas flow rate of 2ml/min. A fatty acid methyl ester standard (Nu-Chek-Prep, Elysian, MN) GLC #704, which contained ten fatty acids (methyl esters of stearate, oleate, linoleate, alpha linolenate, gamma linolenate, homogamma linolenate, arachidonate, eicosapentaenoate, docosapentaenoate, and docosahexaenoate) was used for peak identification. The fatty acid methyl esters were reported as the percent of the total methylated fatty acids (area under the curve).
Gene expression assay
Mouse Signal Transduction Pathway Finder™ RT2 Profiler™ PCR Array, RT2 First Strand Kit and SuperArray RT2 qPCR Master Mix (SuperArray Bioscience Corporation, Frederick, MD) were used to analyze the expression of a panel of genes in mammary glands without any visible tumors at 130 days. Frozen tissue was homogenized in Tri Reagent (Sigma-Aldrich, St. Louis, Mo) following the protocol of the manufacturer to isolate the RNA. RNA quality control was performed for all samples. The gene expression assay followed the protocol provided by SuperArray. The relative fold differences in gene expression and statistical analyses were calculated on SuperArray software.
Immunohistochemistry
Expressions of proliferating cell nuclear antigen (PCNA) were assessed in mouse mammary gland at 140 days by immunohistochemistry. Paraffin sections (six per slides) were deparaffinized in xylene, hydrated in a series of graded ethanol, and rinsed in distilled water. Antigen retrieval was done in a microwave oven using Vector Antigen Unmasking solution (Vector Laboratories, Inc., Burlingame, CA). Endogenous peroxidase and Avidin/Biotin activity were blocked by 3% hydrogen peroxide and by Vector Avidin/Biotin blocking kit (Vector Laboratories, Inc., Burlingame, CA), respectively, following the manufacturers protocols. Following the blocking, the sections were probed with mouse anti-PCNA (Biogenex, San Ramon, CA). Vector M.O.M kit (Vector Laboratories, Inc., Burlingame, CA) was used to localize mouse primary antibodies. Sections were incubated with 3, 3’-diaminobenzidine (Vector Laboratories, Inc., Burlingame, CA) and counterstained using hematoxylin. The number of PCNA positively stained nuclei per 1000 cells was compared between the four diet groups. Counting was performed within viable areas of lesions.
Results
Diet influence on body weight
The body weight was recorded terminally for each mouse. The mean weight of CF group at 120 days was significant higher compared to all other groups (Fig 1a). There was no significant difference between the four groups in body weight at 130 days. FC group at 140 days had a mean weight significant lower compared to CF and CC groups (Fig 1a).
Figure 1.
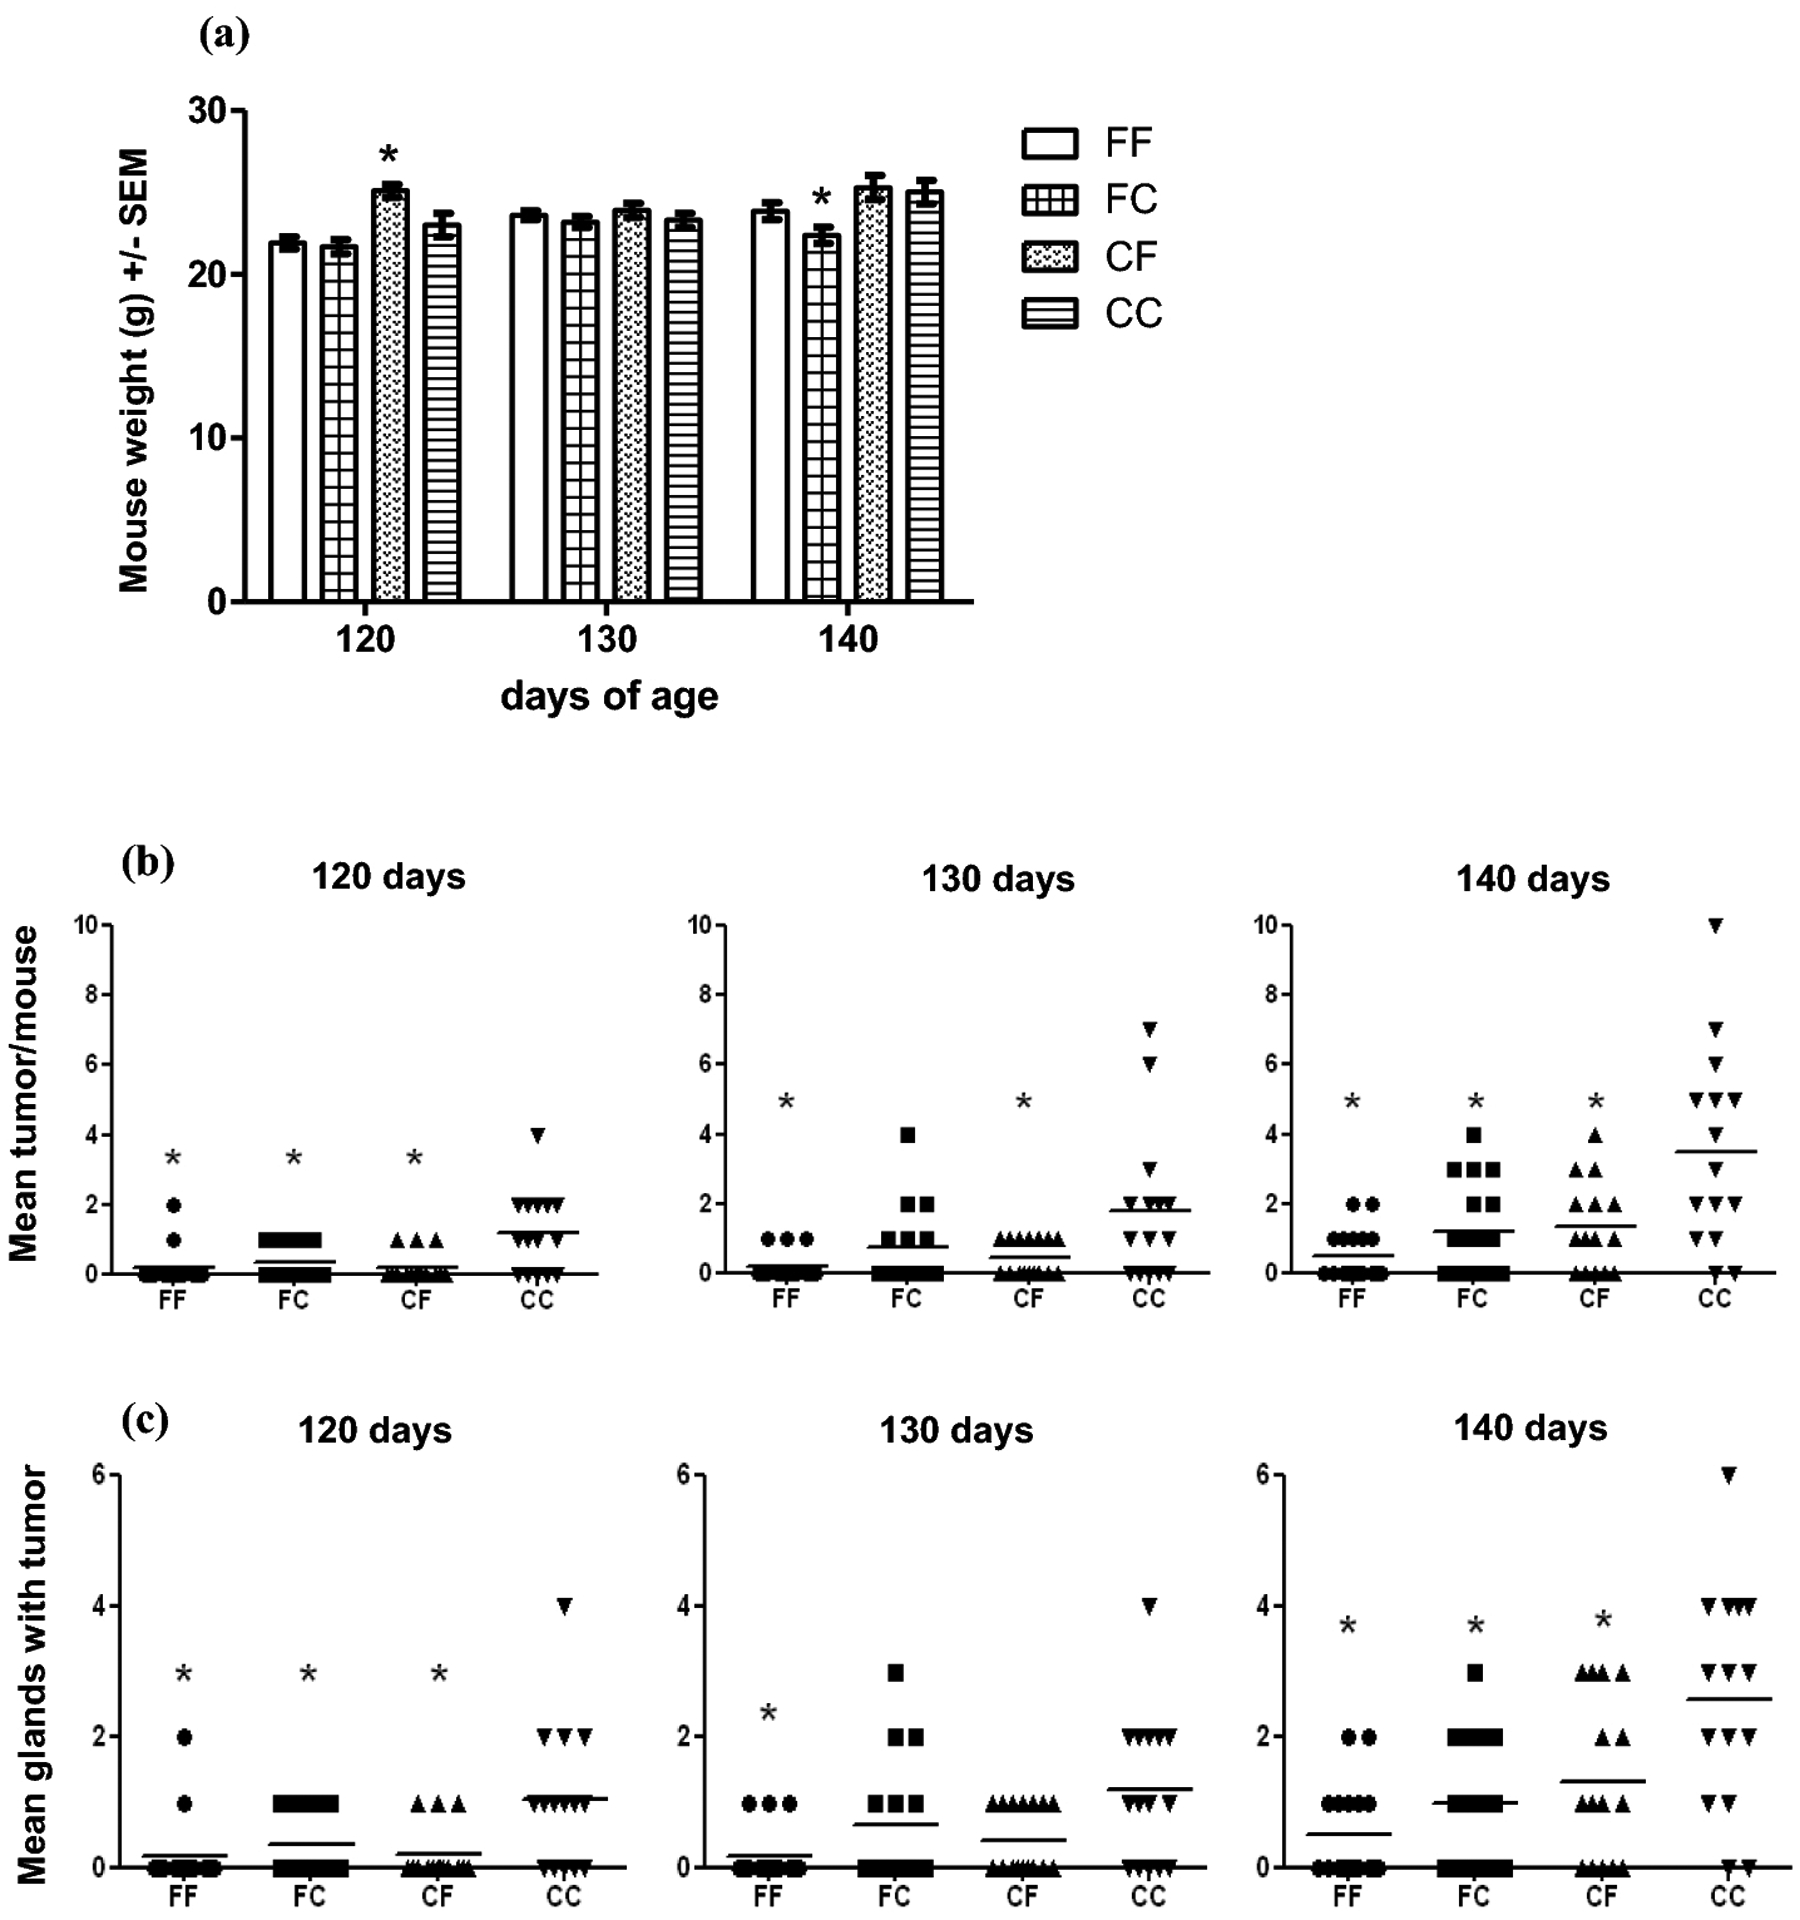
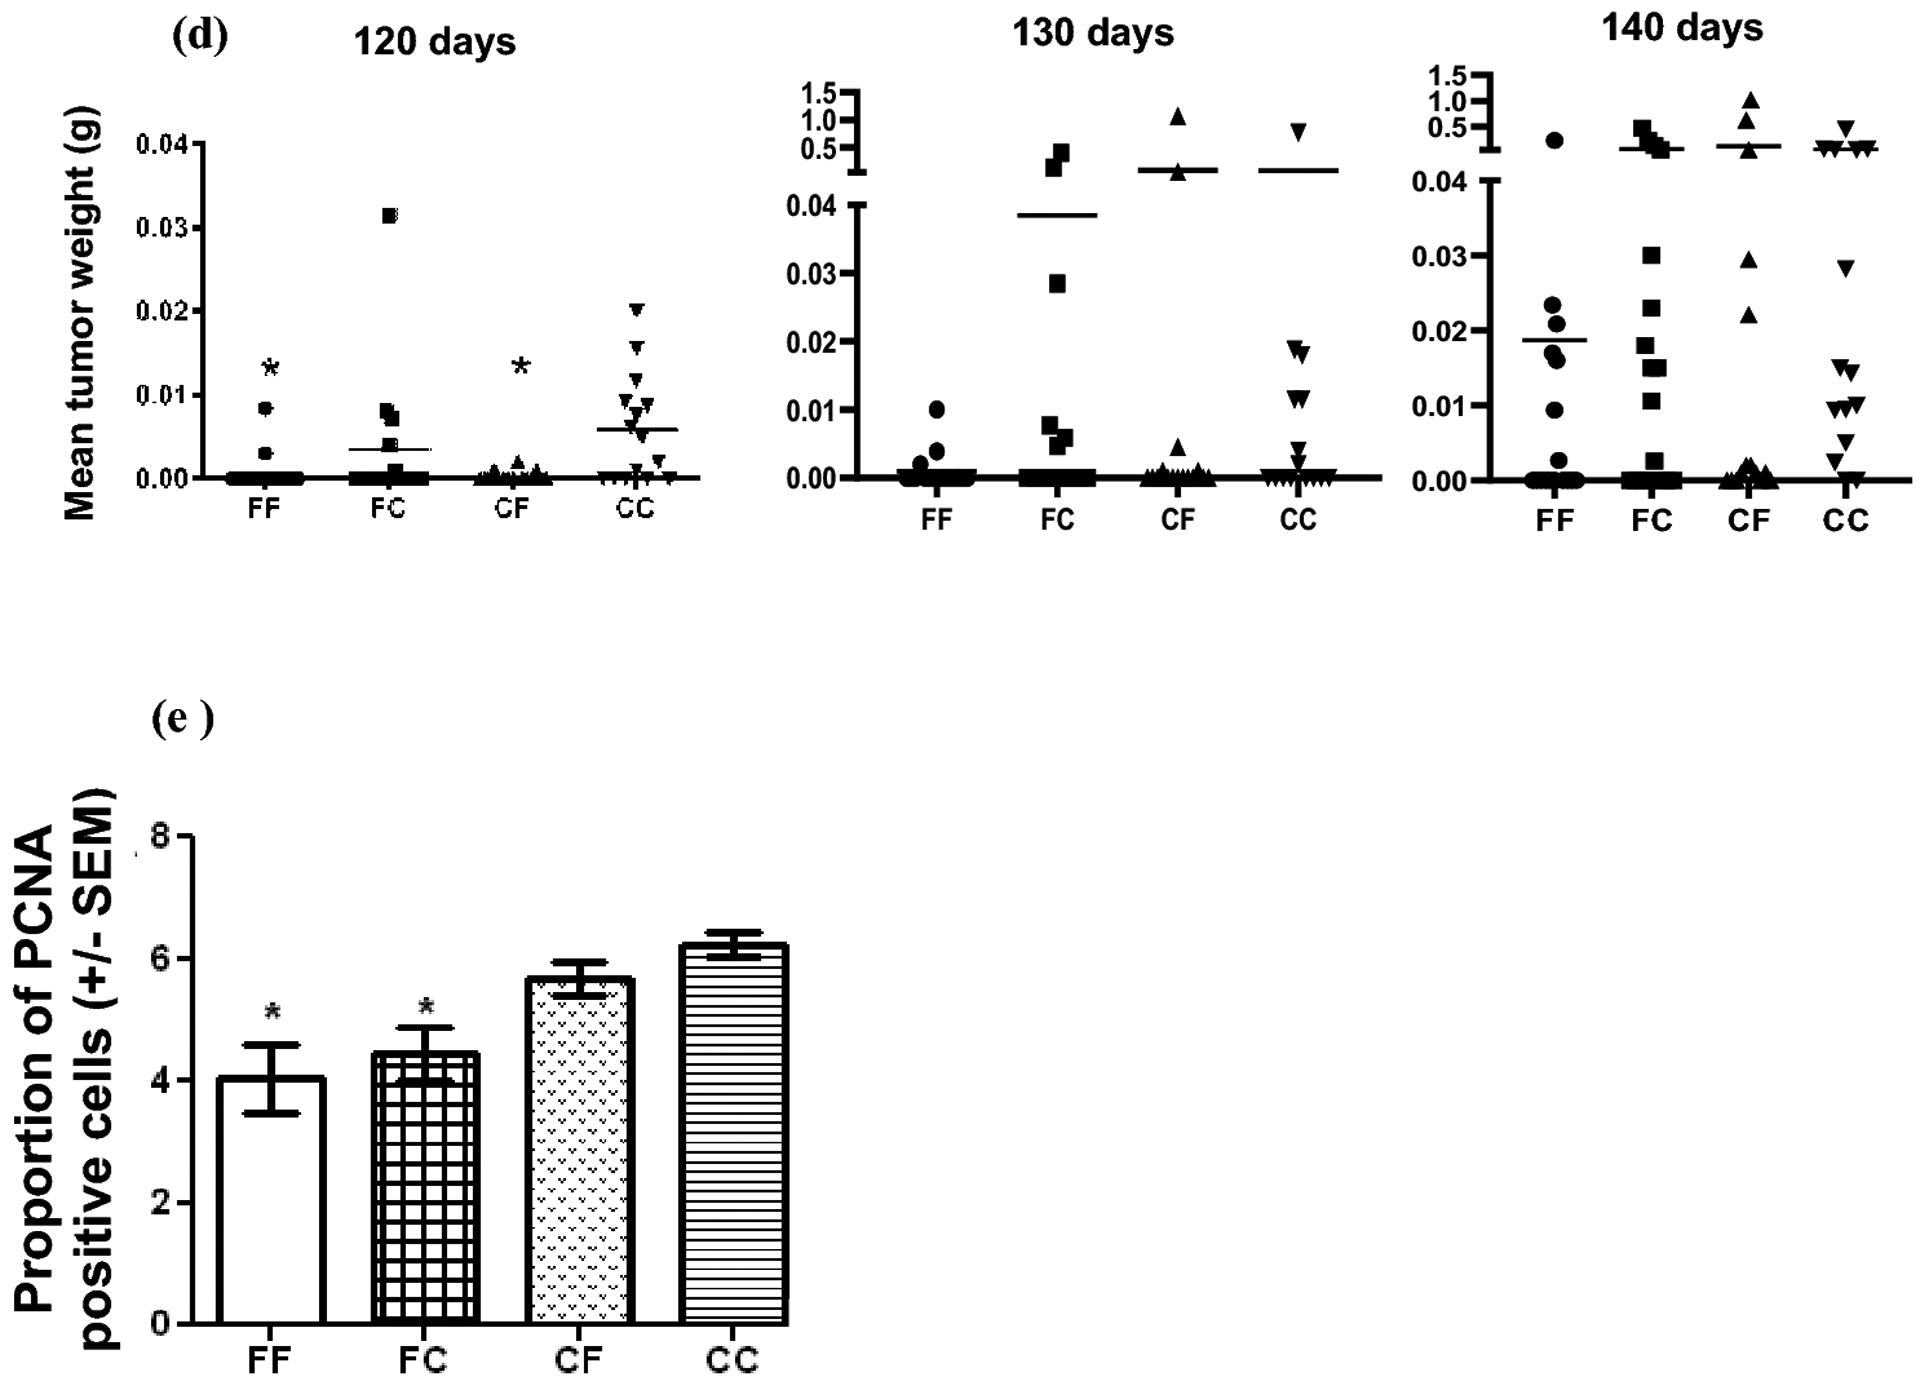
a Mean body weight at 120, 130 and 140 days. Body weight was determined for each mouse. There was significant difference between the groups at 120 and 140 days of age. At 120 days, CF* group had the highest mean weight compared to FF, FC and CC groups. At 140 days FC* group had the lowest mean weight compared to CF and CC. p<0.05 by Newman-Keuls Multiple Comparison Test, n>15. b Number of tumors per mouse. The mean number of tumors at 120 and 140 days was statistically lower in the FF, FC and CF groups than in CC group. The mean number of tumors at 130 days was statistically lower in the FF and CF groups than in CC group. (1 way ANOVA, Bonferroni’s Multiple Comparison). c Number of glands with tumor per mouse. 1 way ANOVA, Bonferroni’s Multiple Comparison Test showed that the number of glands with tumor per mouse was significantly lower in FF group than in CC group at all time points. FC and CF groups had a significantly lower number of glands with tumor than CC group at 120 and 140 days. d Tumor mass. The tumor mass at 120 days was significantly less in the FF and CF groups than in the CC group by Kruskal-Wallis test, Dunn’s Multiple Comparison. n>15, *p<0.05 for all statistical analysis. e Effect of diet on PCNA expression at 140 days. Expression of PCNA was significantly lower in FF and FC groups than in CC group. n=4, *p<0.05 by one-way Anova, Bonferroni’s Multiple Comparison Test
Diet influence on tissue lipid composition
The lipid composition of mammary glands, liver and fat pad at 130 days of age is shown in Table 1. At 130 days of age, the lipid composition of the tissues reflected the current diet of the mice. Gas chromatography was performed for FF and FC groups. The tissues of mice fed with fish oil containing diet had significantly more (p<0.05 by T-test) n-3 fatty acids (ALA, EPA, DPA, DHA) and significantly less (p<0.05 by T-test) n-6 fatty acids (LNA, GLA) than the mice switched to the corn oil-containing diet. The content of ARA (n-6) in mammary glands and fat pads was not statistically different (p>0.05 by T-test) between the groups (FF and FC). There was a statistically significant increase (p<0.05 by T-test) of ARA in the liver of mice switched to corn diet at weaning compared to fish diet fed mice.
Table 1.
Tissue lipid composition at 130 days.
| FF | FC | p value | FF | FC | p value | FF | FC | p value | |
|---|---|---|---|---|---|---|---|---|---|
| LNA | 14.26±0.92 | 42.47±1.86 | 0.000000 | 11.78±0.80 | 31.72±2.53 | 0.000006 | 15.97±0.35 | 47.77±0.30 | 0.000000 |
| GLA | 0.04±0.01 | 0.08±0.01 | 0.000448 | 0.04±0.01 | 0.49±0.09 | 0.000070 | 0.03±0.01 | 0.07±0.01 | 0.000014 |
| ARA | 0.19±0.04 | 0.26±0.05 | 0.065569* | 7.27±0.39 | 13.75±1.24 | 0.000058 | 0.13±0.03 | 0.13±0.01 | 1.000000* |
| ALA | 2.47±0.47 | 0.29±0.01 | 0.000089 | 1.05±0.19 | 0.15±0.03 | 0.000093 | 2.74±0.20 | 0.38±0.02 | 0.000000 |
| EPA | 1.13±0.37 | 0.05±0.01 | 0.001086 | 11.49±1.35 | 0.20±0.05 | 0.000003 | 1.07±0.54 | 0.04±0.01 | 0.008769 |
| DPA | 0.25±0.05 | 0.04±0.01 | 0.000183 | 2.70±0.05 | 0.26±0.06 | 0.000000 | 0.27±0.10 | 0.02±0.00 | 0.002893 |
| DHA | 0.50±0.15 | 0.02±0.01 | 0.000691 | 20.68±1.24 | 4.38±0.41 | 0.000000 | 0.64±0.27 | 0.02±0.00 | 0.00397 |
The percents of assayed fatty acids of mammary gland, liver and fat pad at 130 days are shown. The results of T-tests between each pair of treatments for each tissue are shown, n =4.
indicates a p>0.05 which is not statistically significant. LNA—linoleic acid; GLA—gamma linolenic acid; ARA—arachidonic acid; ALA—α-linolenic acid; EPA—eicosapentaenoic acid; DPA—docosapentaenoic acid; DHA—docosahexaenoic acid.
Diet influence on tumor multiplicity and weight
The total number of tumors, glands with tumors, the tumor weight per mouse (Fig 1b, c, d) and the number of tumor-free animals (Table 2) were assessed in C3(1)TAG/129 female offspring at 120, 130, 140 days of age. The presence of the transgene was confirmed in all pups used in the experiment (data not showed). Images of fully developed mammary gland, hyperplasia and mammary tumor are presented in Supplementary Fig 1.
Table 2.
Tumor free animals at 120, 130 and 140 days
| FF | FC | CF | CC | %FF-%FC | %FF-%CF | %FF-%CC | FF | FC | CF | CC | FF | FC | CF | CC | |
|---|---|---|---|---|---|---|---|---|---|---|---|---|---|---|---|
| 120 | 87.5 | 62.5 | 80 | 33.33 | 25 | 7.5 | 54.17 | 14 | 10 | 12 | 5 | 16 | 16 | 15 | 15 |
| 130 | 87.5 | 60 | 68.75 | 53.33 | 27.5 | 18.75 | 34.17 | 14 | 9 | 11 | 8 | 16 | 15 | 16 | 15 |
| 140 | 64.7 | 38.88 | 33.33 | 13.33 | 25.82 | 31.37 | 51.37 | 11 | 7 | 5 | 2 | 17 | 18 | 15 | 15 |
Multiplicity:
Since these mice bear a tumor promoting transgene, all mice are expected to develop tumors at some point. As shown in Fig 1b, the tumor multiplicity (mean number of tumors per mouse) at 120 and 140 days of age was significantly lower (p<0.05 by one-way ANOVA, Bonferroni’s Multiple Comparison) in the FF, FC and CF groups than in the CC group. At 130 days of age, Fig 1b, the multiplicity of tumors in the FF and CF groups was significantly lower than in the CC group. The number of glands with tumor at each time point for each group is presented in Fig 1c. The one-way ANOVA, Bonferroni’s Multiple Comparison revealed that there were significant effects due to the diet. The number of glands with tumor was significantly lower in the FF group than in the CC group at all time points, p<0.05. FC and CF groups at 120 and 140 days showed significantly lower number of glands with tumours per mouse compared to CC group (Fig 1c), p<0.05. The percent of tumor-free animals was higher for FF group at all time points investigated (Table 2). The comparison of the groups showed that the percentage of tumor-free animals had the same pattern for all time points investigated. At 120 days, there were 7.5%, 25% and 54.17% more tumor-free animals in FF group than in CF, FC and CC group, respectively. At 130 days, there were 27.5%, 18.75% and 34.17% more tumor-free animals in FF group than in FC, CF and CC group. At 140 days, the difference followed the same trend: 25.82%, 31.37% and 51.33% more tumor-free animals in FF group than in FC, CF and CC group. Mice exposed to the fish oil containing diet at any time (FF, FC and CF groups) were free of tumors at a higher rate than the mice never exposed to fish oil diet (CC group). As expected, the number of tumor-free animals decreased with time in all groups (Table 2). Tumor mass: The mean tumor mass, calculated from autopsy data, indicates a difference in tumor burden due to the diet. In Fig 1d, the tumor mass in the FF and CF groups was significantly lower (p<0.004 by Kruskal-Wallis test) than that of the CC group at 120 days. At 130 and 140 days, there were not statistically differences among the groups. The comparison of the groups showed that the difference between the number of tumors/mouse, glands with tumor/mouse and tumor mass/mouse, respectively, was not statistically significant between the FF and FC or CF groups nor between FC and CF groups (Fig 1 b, c, d).
Diet influence on gene expression at 130 days of age
The diet-induced changes in genes expression associated with reduction of tumor number per mouse were assessed by RT-PCR (the raw data are available as Supplementary Table 1). The assay was performed on mammary gland tissue without any visible tumor from C3(1)TAG/129 mice offspring at 130 days of age. The CC group was the control group, the FF, FC and CF groups were the experimental groups for analysis. For a better understanding of similarities and differences in gene expression of different diet groups, the following groups were compared too: FF versus FC; FF versus CF; FC versus CF (Table 3). Table 3 presents genes that were analyzed and found to be at least two fold different between the compared groups. Differences in gene expression were likely induced by the maternal diet: 1. FF and FC groups had a similar trend in gene expression when compared to CC group. A significant fold up regulation of Ccl2, Ccl20, Cd5, Il2, Il2ra, Il4ra, Lef1, Lta gene expression suggests that the maternal diet might be responsible for boosting the immune response of progeny. 2. The CF group did not show a significant change in any of the genes analysed when compared to CC group. 3. The only statistically significant difference between FF and FC groups was present in two of the 84 genes investigated: Csf2 (Colony stimulating factor 2 (granulocyte-macrophage)) and Fasn (Fatty acid synthase). 4. The gene expression trend was similar when FF and FC groups were compared to CF. Although the trend was similar, a statistically significant difference was only present between FC/CF groups.
Table 3.
Mammary gland gene expression at 130 days
| LR family, apoptosis inhibitory protein 1 | Naipl | Anti-apoptotic | 11.54 | 0.046 | 18.97 | 0.001 | 1.62 | 0.442 | −1.64 | 0.274 | 11.72 | 0.267 | 11.72 | 0.098 |
| Baculoviral IAP repeat-containing 3 | Birc3 | Apoptotic suppressor | 2.31 | 0.011 | 2.37 | 0.008 | 1.22 | 0.482 | −1.03 | 0.885 | 1.94 | 0.268 | 1.94 | 0.098 |
| Bone morphogenetic protein 4 | Bmp4 | Growth and differentiation factor | −2.03 | 0.026 | −2.07 | 0.013 | −1.45 | 0.058 | 1.02 | 0.849 | 0.70 | 0.266 | −1,43 | 0.054 |
| Chemokine (C-C motif) ligand 2 | Ccl2 | Augments monocyte anti-tumor activity | 2.39 | 0.062 | 2.56 | 0.056 | 1.34 | 0.590 | −1.07 | 0.759 | 1.92 | 0.267 | 1.92 | 0,075 |
| Chemokine (C-C motif) ligand 20 | Ccl20 | Chemoattractant produced by activated T cells | 3.53 | 0.008 | 3.72 | 0.008 | −1 | 0.991 | −1.05 | 0.729 | 3.73 | 0.267 | 3.73 | 0.008 |
| CD5 antigen | Cd5 | Regulator of T cell activation | 28.29 | 0.050 | 36.22 | 0.0008 | 3.75 | 0.350 | −1.28 | 0.684 | 9.66 | 0.271 | 9.66 | 0.039 |
| Cyclin-dependent kinase inhibitor 2A | Cdkn2a | Tumor suppressor | 2.75 | 0.060 | 1.74 | 0.272 | −1.26 | 0.546 | 1.58 | 0.098 | 2.19 | 0.181 | 2.19 | 0.022 |
| Colony stimulating factor 2 (granulocyte-macrophage) | Csf2 | Granulocytes and monocytes growth factor | 1.00 | 0.626 | 2.13 | 0.473 | −1.21 | 0.963 | −2.13 | 0.027 | 2.58 | 0.268 | 2.58 | 0.643 |
| Fas ligand (TNF superfamily, member 6) | Fasl | Apoptosis | 3.69 | 0.018 | 4.45 | 0.008 | 1.31 | 0.374 | −1.21 | 0.491 | 3.40 | 0.267 | 3.40 | 0.025 |
| Fatty acid synthase | Fasn | Catalyzes the formation of long-chain fatty acids from acetyl-CoA, malonyl-CoA and NADPH. | −2.59 | 0.007 | −1.15 | 0.311 | −1.08 | 0.728 | −2.26 | 0.011 | 0.94 | 0.631 | −1.06 | 0.683 |
| Hexokinase 2 | Hk2 | Glucose metabolism | −2.23 | 0.004 | −1.35 | 0.032 | 1.18 | 0.348 | −1.65 | 0.065 | 0.62 | 0.350 | −1.60 | 0.096 |
| Interleukin 2 | Il2 | Regulator of immune activation | 5.04 | 0.003 | 4.98 | 0.038 | −2.36 | 0.263 | 1.01 | 0.893 | 11.72 | 0.267 | 11.72 | 0.024 |
| Interleukin 2 receptor, alpha chain | Il2ra | Receptor for interleukin-2 | 2.44 | 0.028 | 2.44 | 0.059 | 1.07 | 0.726 | −1.00 | 0.947 | 2.28 | 0.267 | 2.28 | 0.155 |
| Interleukin 4 receptor, alpha | Il4ra | Receptor for both interleukin 4 and interleukin 13 | 2.04 | 0.076 | 2.06 | 0.063 | 1.29 | 0.532 | −1.01 | 0.966 | 1.60 | 0.267 | 1.60 | 0.327 |
| Lymphoid enhancer binding factor 1 | Lef1 | Participates in the Wnt signaling pathway; Regulates T-cell receptor alpha enhancer function | 41.32 | 0.003 | 62.05 | 0.0007 | 4.72 | 0.353 | −1.50 | 0.096 | 13.16 | 0.268 | 13.16 | 0.022 |
| Leptin | Lep | Fat metabolism | −1.99 | 0.137 | −3.06 | 0.026 | −1.29 | 0.266 | 1.54 | 0.411 | 0.42 | 0.201 | −2.38 | 0.066 |
| Lymphotoxin A | Lta | Stimulation of B-cells; inhibition of tumor angiogenesis | 11.87 | 0.009 | 23.9 | 0.014 | 2.32 | 0.359 | −2.01 | 0.107 | 10.30 | 0.269 | 10.30 | 0.065 |
| Matrix metallopeptidase10 | Mmp10 | Degrades proteoglycans and fibronectin | 4.18 | 0.211 | 5.11 | 0.094 | −1.15 | 0.530 | −1.22 | 0.978 | 5.88 | 0.267 | 5.88 | 0.084 |
| Nitric oxide synthase 2, inducible | Nos2 | Produces nitric oxide | 3.59 | 0.266 | 3.28 | 0.163 | −1.27 | 0.647 | 1.09 | 0.944 | 4.17 | 0.266 | 4.17 | 0.149 |
| Peroxisome proliferator activated receptor gamma | Pparg | Adipogenesis regulator | −1.78 | 0.072 | −1.64 | 0.054 | 1.32 | 0.261 | −1.08 | 0.850 | 0.46 | 0.273 | −2.18 | 0.038 |
| Transcription factor 7, T-cell specific | Tcf7 | Wnt signaling pathway | 9.18 | 0.048 | 10.62 | 0.001 | 1.94 | 0.379 | −1.16 | 0.857 | 5.47 | 0.285 | 5.47 | 0.037 |
| Tumor necrosis factor | Tnf | Cytokine involved in cell proliferation, differentiation, apoptosis, lipid metabolism, coagulation | 2.84 | 0.008 | 2.77 | 0.001 | 1.2 | 0.545 | 1.02 | 0.811 | 2.30 | 0.266 | 2.30 | 0.101 |
| WNT1 inducible signaling pathway protein 1 | Wisp1 | Downstream regulator in the Wnt signaling pathway. Associated with cell survival | 3.79 | 0.034 | 2.03 | 0.030 | 1.11 | 0.808 | 1.60 | 0.400 | 1.12 | 0.267 | 1.12 | 0.565 |
Gene expression was analyzed in 3 mammary glands from mice at 130 days of age. Mammary tissue without macroscopic tumor was selected for assay. Most significant differences in gene expression were due to the diet of the mother. FF=fish/fish; FC=fish/corn; CF=corn/fish; CC=corn/corn; p by ttest
The diet of the mother during pregnancy and lactation can be important to ‘set up’ or imprint the offspring in such a way that cancer development during adult life might be altered.
Diet influence on PCNA expression
Maternal consumption of a high n-3 diet (FF and FC groups) was able to up regulate certain genes in female offspring (Table 3) and to reduce the expression of PCNA (Fig 1e). The diet induced changes in cell proliferation was assessed by immunohistochemistry of PCNA (Proliferating Cell Nuclear Antigen) expression in mammary gland tissue of mice at 140 days of age. FF and FC groups had a significantly lower expression of PCNA than CC group by one-way Anova, Bonferroni’s Multiple Comparison Test.
Discussion
Western diet is well known for its high n-6 fat composition and the negative impact on the human health [24, 31–33]. On the basis of this understanding, a high n-6:n-3 ratio is likely to support the development and progression of breast cancer while a low n-6:n-3 ratio has beneficial effects of slowing down the cancer progression [34]. Even more, the results presented herein point out that fish oil consumption was able to delay the breast cancer development in mice genetically modified to develop the tumours. C3(1)/SV40 TAg model used in this study is very well characterized [35]. The breast invasive carcinoma was observed in 100% of homozygous female mice at 16 weeks of age (112 days). Hemizygous female mice used in this study resulted from the breeding of SV129 female with C3(1)/SV40 TAg males. The hemizygous female mice bearing the transgene were prone to develop breast tumours. The efficiency of fish oil consumption by both mother and offspring to reduce the incidence of the tumors in this study was significant. This was translated into 87.5% tumor-free animals at the age of 17 weeks (120 days) compared to the mice on a diet rich in n-6 FA (corn oil) where the percentage of tumor-free animals at 120 days was only 33.33%. The efficiency of fish oil diet to slow down the tumor progression was shown in a longer term. At the age of 20 weeks (140 days), the percentage of tumor-free animals in the FF group was 64.7% compared to only 13.33% in the CC group. Similar pattern in percentage difference of free tumor animals was shown between the two groups (FF and CC) at 120 and 140 days. The consumption of fish oil after weaning appeared to delay the development of tumors. Exposure of mothers or/and offspring to a fish oil diet seemed to be beneficial though not a significantly reduction on tumor multipliticy. Even though the intermediate groups (FC and CF) showed a high tumor multiplicity at 140 days the mean glands with tumor and mean tumor/mouse scored less than in the CC group which never had a fish oil intake. The underlying mechanism for the efficiency of fish oil diet in slowing down breast cancer development may rely on the immune system boost. The efficiency of fish oil supplementation in breast cancer prevention and immune regulation was also shown on HER-2/ neu transgenic mouse model [36]. In our study, the fish oil immune regulation was supported by the fact that the gene expression of Cd5 (regulator of T cell activation), Lef1 (regulates T-cell receptor alpha enhancer function), Lta (responsible for B-cells stimulation) were highly up-regulated in mammary glands from mice that were on a fish oil diet (mother and/or offspring). The data showed that the most significant differences in gene expression were due to the diet of the mother. The diet of the mother appears to improve the lifelong outcome in the offspring. Il2 (regulator of immune activation), Il2ra (receptor for interleukin-2), Tcf7 (Transcription factor 7, T-cell specific) were also up-regulated in offspring whose mothers were on fish oil diet. The same diet was also responsible for Bmp4 (growth and differentiation factor) down-regulation. The marker for proliferating cells, PCNA staining additionally supported the fact that the fish oil diet of the mother highly and negatively impacted the development of tumors in offspring. The findings of this study are in line with our [12, 26, 28] and others investigations [11, 37–39] in supporting the fact that a healthier n-3:n-6 ratio is beneficial for diseases promoted by inflammation [34, 40–42]. The study supports the notion that an n-3-rich diet consumed by the mother may reduce cancer development and/or progression in offspring. In humans, the positive impact of n-3 FA on the immune system function is also supported by different clinical trials [19, 21, 26, 43]. In patients with early CLL, fish oil supplements reduced NFkB activation by altering lymphocyte mRNA expression in patients with higher initial NFkB activation [26]. A study published in 2017 by Paixão EMDS et al. showed that newly diagnosed breast cancer patients treated with fish oil supplements were able to maintain the level of CD4+ T cells and had less inflammatory response [21]. An extended review by Richard et al. (2016) covered the importance of DHA in postnatal/breast-feeding for the immune system development in early life [19].
In humans, it is very difficult to track how the diet of the mother (before/during pregnancy and lactation) can affect not only the early life development of the infants but the health events that occur in adult life. Epigenetic events that occur in utero might lead to changes in gene expression that persist throughout life and animal models provide a good glimpse on what and how that might be.
Supplementary Material
Supplementary Figure 1 Whole mount mammary glands of C3(1)TAG/129 female mice. In pups at weaning (3 weeks old), the mammary gland was developing. In adult mice, the mammary gland was fully developed, with hyperplastic areas and tumors.
Funds
This work was supported by Grant Number R01CA114018 (to W.E.H.).
Abbreviations
- n-3
Omega 3
- n-6
Omega 6
- C
corn oil
- F
fish oil
- FA
fatty acids
- LNA
linoleic acid
- GLA
gamma linolenic acid
- ARA
arachidonic acid
- ALA
α-linolenic acid
- EPA
eicosapentaenoic acid
- DPA
docosapentaenoic acid
- DHA
docosahexaenoic acid
- Naip1
NLR family, apoptosis inhibitory protein 1
- Birc3
Baculoviral IAP repeat-containing 3
- Bmp4
Bone morphogenetic protein 4
- Ccl2
Chemokine (C-C motif) ligand 2
- Ccl20
Chemokine (C-C motif) ligand 20
- Cd5
CD5 antigen
- Cdkn2a
Cyclin-dependent kinase inhibitor 2A
- Csf2
Colony stimulating factor 2 (granulocyte-macrophage)
- Fasl
Fas ligand (TNF superfamily, member 6)
- Fasn
Fatty acid synthase
- Hk2
Hexokinase 2
- Il2
Interleukin 2
- Il2ra
Interleukin 2 receptor, alpha chain
- Il4ra
Interleukin 4 receptor, alpha
- Lef1
Lymphoid enhancer binding factor 1
- Lep
Leptin
- Lta
Lymphotoxin A
- Mmp10
Matrix metallopeptidase10
- Nos2
Nitric oxide synthase 2, inducible
- Pparg
Peroxisome proliferator activated receptor gamma
- Tcf7
Transcription factor 7, T-cell specific
- Tnf
Tumor necrosis factor
- Wisp1
WNT1 inducible signaling pathway protein 1
Footnotes
Publisher's Disclaimer: This Author Accepted Manuscript is a PDF file of an unedited peer-reviewed manuscript that has been accepted for publication but has not been copyedited or corrected. The official version of record that is published in the journal is kept up to date and so may therefore differ from this version.
Conflict of interest The authors declare that they have no conflict of interest.
Ethical approval All animal work was approved by the Marshall University School of Medicine Institutional Animal Care and Use Committee.
References
- 1. https://www.wcrf.org/dietandcancer/cancer-trends/breast-cancer-statistics.
- 2.De Souza RGM, Schincaglia RM, Pimente GD, Mota JF (2017) Nuts and human health outcomes: A systematic review. Nutrients 9(12). 10.3390/nu9121311 [DOI] [PMC free article] [PubMed] [Google Scholar]
- 3.Li Y, Buckhaults P, Li S, Tollefsbol T (2018) Temporal Efficacy of a Sulforaphane-Based Broccoli Sprout Diet in Prevention of Breast Cancer through Modulation of Epigenetic Mechanisms. Cancer Prev Res 11(8):451–464. 10.1158/1940-6207.CAPR-17-04234. [DOI] [PMC free article] [PubMed] [Google Scholar]
- 4.Aune D, Giovannucci E, Boffetta P, Fadnes LT, Keum N, Norat T, Greenwood DC, Riboli E, Vatten LJ, Tonstad S (2017) Fruit and vegetable intake and the risk of cardiovascular disease, total cancer and all-cause mortality-A systematic review and dose-response meta-analysis of prospective studies. Int J Epidemiol 46(3):1029–1056. 10.1093/ije/dyw319 [DOI] [PMC free article] [PubMed] [Google Scholar]
- 5.Zheng J, Zhou Y, Li Y, Xu DP, Li S, Bin Li H (2016) Spices for prevention and treatment of cancers. Nutrients 8(8). doi: 10.3390/nu8080495 [DOI] [PMC free article] [PubMed] [Google Scholar]
- 6.Bojková B, Winklewski PJ, Wszedybyl-Winklewska M (2020) Dietary fat and cancer—which is good, which is bad, and the body of evidence. Int J Mol Sci 21(11):1–56. doi: 10.3390/ijms21114114 [DOI] [PMC free article] [PubMed] [Google Scholar]
- 7.Jain A, Tiwari A, Verma A, Jain SK (2017) Vitamins for Cancer Prevention and Treatment: An Insight. Curr Mol Med 17(5):321–340. doi: 10.2174/1566524018666171205113329 [DOI] [PubMed] [Google Scholar]
- 8.Kim DH, Khan H, Ullah H, Hassan STS, Smejkal K, Efferth T, Mahomoodally MF, Xu S Habtemariam S, Filosa R, Lagoa R, Rengasamy KR (2019) MicroRNA targeting by quercetin in cancer treatment and chemoprotection. Pharmacol Res 147(104346). doi: 10.1016/j.phrs.2019.104346 [DOI] [PubMed] [Google Scholar]
- 9.Bostan M, Petrică-Matei G, Ion G, Radu N, Mihaila M, Hainarosie R, Brasoveanu LI, Roman V, Constantin C, Neagu MT (2019) Cisplatin effect on head and neck squamous cell carcinoma cells is modulated by ERK1/2 protein kinases. Exp Ther Med 18(6):5041–5051. doi: 10.3892/etm.2019.8139 [DOI] [PMC free article] [PubMed] [Google Scholar]
- 10.Bostan M, Petrică-Matei GG, Radu N, Hainarosie R, Stefanescu CD, Diaconu CC, Roman V (2020) The Effect of Resveratrol or Curcumin on Head and Neck Cancer Cells Sensitivity to the Cytotoxic Effects of Cisplatin. Nutrients 12(9):2596. doi: 10.3390/nu12092596 [DOI] [PMC free article] [PubMed] [Google Scholar]
- 11.Nguyen NM, de Oliveira Andrade F, Jin L, Zhang X, Macon M, Cruz MI, Benitez C, Wehrenberg B, Yin C, Wang X, Xuan J, de Assis S, Hilakivi-Clarke L (2017) Maternal intake of high n-6 polyunsaturated fatty acid diet during pregnancy causes transgenerational increase in mammary cancer risk in mice. Breast Cancer Res 19(1):1–13. doi: 10.1186/s13058-017-0866-x [DOI] [PMC free article] [PubMed] [Google Scholar]
- 12.Hardman WE, Ion G, Akinsete JA, Witte TR (2011) Dietary walnut suppressed mammary gland tumorigenesis in the C(3)1 TAg mouse. Nutr Cancer 63(6):960–970. doi: 10.1080/01635581.2011.589959 [DOI] [PMC free article] [PubMed] [Google Scholar]
- 13.Govindarajah V, Leung YK, Ying J, Gear R, Bornschein RL, Medvedovic M, Shuk-Mei Ho SM (2016) In utero exposure of rats to high-fat diets perturbs geneexpression profiles and cancer susceptibility of prepubertal mammary glands. J Nutr Biochem 29:73–82. doi: 10.1016/j.jnutbio.2015.11.003 [DOI] [PMC free article] [PubMed] [Google Scholar]
- 14.De Assis S, Warri A, Cruz MI, Laja O, Tian Y, Zhang B, Wang Y, Huang THM, Hilakivi-Clarke L (2012) High-fat or ethinyl-oestradiol intake during pregnancy increases mammary cancer risk in several generations of offspring. Nat Commun 3. doi: 10.1038/ncomms2058 [DOI] [PMC free article] [PubMed] [Google Scholar]
- 15.Zhang X, de Oliveira Andrade F, Zhang H, Cruz I, Clarke R, Gaur P, Verma V, Hilakivi-Clarke L (2020) Maternal obesity increases offspring’s mammary cancer recurrence and impairs tumor immune response. Endocr Relat Cancer 27(9):469–482. doi: 10.1530/ERC-20-0065 [DOI] [PMC free article] [PubMed] [Google Scholar]
- 16.Lomas-Soria C, Reyes-Castro LA, Rodríguez-González GL, Ibanez CA, Bautista CJ, Cox LA, Nathanielsz PW, Zambrano E (2018) Maternal obesity has sex-dependent effects on insulin, glucose and lipid metabolism and the liver transcriptome in young adult rat offspring. J Physiol 596(19):4611–4628. doi: 10.1113/JP276372 [DOI] [PMC free article] [PubMed] [Google Scholar]
- 17.Kossoy G, Stark A, Tendler Y, Ben-Hur H, Beniashvili D, Madar Z, Zusman I (2002) Transplacental effects of high fat diets on functional activity of the spleen and lymph nodes, cell kinetics and apoptosis in mammary gland tumors in female rat offspring. Int J Mol Med 10(6):773–778. doi: 10.3892/ijmm.10.6.773 [DOI] [PubMed] [Google Scholar]
- 18.Radzikowska U, Rinaldi AO, Çelebi Sözener Z, Karaguzel D, Wojcik M, Cypryk K, Akdis M, Akdis CA, Sokolowska M (2019) The Influence of Dietary Fatty Acids on Immune Responses. Nutrients 11(12):2990. doi: 10.3390/nu11122990 [DOI] [PMC free article] [PubMed] [Google Scholar]
- 19.Richard C, Lewis ED, Field CJ (2016) Evidence for the essentiality of arachidonic and docosahexaenoic acid in the postnatal maternal and infant diet for the development of the infant’s immune system early in life. Appl Physiol Nutr Metab 41(5):461–475. doi: 10.1139/apnm-2015-0660 [DOI] [PubMed] [Google Scholar]
- 20.Chung H, Lee YS, Mayoral R, Oh DY, Siu JT, Webster NJ, Sears DD, Olefsky JM, Ellies LG (2015) Omega-3 fatty acids reduce obesity-induced tumor progression independent of GPR120 in a mouse model of postmenopausal breast cancer. Oncogene 34(27):3504–3513. doi: 10.1038/onc.2014.283 [DOI] [PMC free article] [PubMed] [Google Scholar]
- 21.Paixão EM da S, Oliveira AC de M, Pizato N, Muniz-Junqueira MI, Magalhães KG, Nakano EY, Ito MK (2017) The effects of EPA and DHA enriched fish oil on nutritional and immunological markers of treatment naïve breast cancer patients: a randomized double-blind controlled trial. Nutr J 16(1):71. doi: 10.1186/s12937-017-0295-9 [DOI] [PMC free article] [PubMed] [Google Scholar]
- 22.Hill EM, Esper RM, Sen A, Simon BR, Aslam MN, Jiang Y, Dame MK, McClintock SD, Colacino JA, Djuric Z, Wicha MS, Smith WL, Brenner DE (2019) Dietary polyunsaturated fatty acids modulate adipose secretome and is associated with changes in mammary epithelial stem cell self-renewal. J Nutr Biochem 71:45–53. doi: 10.1016/j.jnutbio.2019.05.007 [DOI] [PMC free article] [PubMed] [Google Scholar]
- 23.Zanoaga O, Jurj A, Raduly L, Cojocneanu-Petric R, Fuentes-Mattei E, Wu O, Braicu C, Gherman CD, Berindan-Neagoe I (2018) Implications of dietary ω−3 and ω−6 polyunsaturated fatty acids in breast cancer (Review). Exp Ther Med 15(2):1167–1176. doi: 10.3892/etm.2017.5515 [DOI] [PMC free article] [PubMed] [Google Scholar]
- 24.Simopoulos AP (2016) An increase in the Omega-6/Omega-3 fatty acid ratio increases the risk for obesity. Nutrients 8(3):1–17. doi: 10.3390/nu8030128 [DOI] [PMC free article] [PubMed] [Google Scholar]
- 25.Fabian CJ, Kimler BF, Hursting SD (2015) Omega-3 fatty acids for breast cancer prevention and survivorship. Breast Cancer Res 17(1):1–11. doi: 10.1186/s13058-015-0571-6 [DOI] [PMC free article] [PubMed] [Google Scholar]
- 26.Fahrmann JF, Ballester OF, Ballester G, Witte TR, Salazar AJ, Kordusky B, Cowen KG, Ion G, Primerano DA, Boskovic G, Denvir J, Hardman WE (2013) Inhibition of nuclear factor kappa B activation in early-stage chronic lymphocytic leukemia by omega-3 fatty acids. Cancer Invest 31(1):29–43. doi: 10.3109/07357907.2012.743553 [DOI] [PubMed] [Google Scholar]
- 27.Maroulakou IG, Anver M, Garrett L, Green JE (1994) Prostate and mammary adenocarcinoma in transgenic mice carrying a rat C3(1) simian virus 40 large tumor antigen fusion gene. Proc Natl Acad Sci U S A 91(23):11236–11240. doi: 10.1073/pnas.91.23.11236 [DOI] [PMC free article] [PubMed] [Google Scholar]
- 28.Ion G, Akinsete JA, Hardman WE (2010) Maternal consumption of canola oil suppressed mammary gland tumorigenesis in C3(1) TAg mice offspring. BMC Cancer 10:81. doi: 10.1186/1471-2407-10-81 [DOI] [PMC free article] [PubMed] [Google Scholar]
- 29. http://www.protocol-online.org/cgi-bin/prot/view_cache.cgi?ID=2149.
- 30.Tucker DK, Foley JF, Bouknight SA, Fenton SE (2017) Sectioning Mammary Gland Whole Mounts for Lesion Identification. J Vis Exp (125):1–8. doi: 10.3791/55796 [DOI] [PMC free article] [PubMed] [Google Scholar]
- 31.Patterson E, Wall R, Fitzgerald GF, Ross RP, Stanton C (2012) Health Implications of High Dietary Omega-6 Polyunsaturated Fatty Acids. J Nutr Metab 2012:1–16. doi: 10.1155/2012/539426 [DOI] [PMC free article] [PubMed] [Google Scholar]
- 32.Ghazali R, Mehta KJ, Bligh SWA, Tewfik I, Clemens D, Patel VB (2020) High omega arachidonic acid/docosahexaenoic acid ratio induces mitochondrial dysfunction and altered lipid metabolism in human hepatoma cells. World J Hepatol 12(3):84–98. doi: 10.4254/wjh.v12.i3.84 [DOI] [PMC free article] [PubMed] [Google Scholar]
- 33.Hoge A, Tabar V, Donneau AF, Dardenne N, Degée S, Timmermans M, Nisolle M, Guillaume M, Castronovo V (2019) Imbalance between omega-6 and omega-3 polyunsaturated fatty acids in early pregnancy is predictive of postpartum depression in a Belgian cohort. Nutrients 11(4):876. doi: 10.3390/nu11040876 [DOI] [PMC free article] [PubMed] [Google Scholar]
- 34.AL-Jawadi A, Moussa H, Ramalingam L, Dharmawardhane S, Gollahon L, Gunaratne P, Rahman RL, Moustaid-Moussa N (2018) Protective properties of n-3 fatty acids and implications in obesity-associated breast cancer. J Nutr Biochem 53:1–8. doi: 10.1016/j.jnutbio.2017.09.018 [DOI] [PubMed] [Google Scholar]
- 35.Green JE, Shibata MA, Yoshidome K, Liu ML, Jorcyk C, Anver MR, Wigginton J, Wiltrout R, Shibata E, Kaczmarczyk S, Wang W, Liu ZY, Calvo A, Couldrey C (2000) The C3(1)/SV40 T-antigen transgenic mouse model of mammary cancer: Ductal epithelial cell targeting with multistage progression to carcinoma. Oncogene 19(8):1020–1027. doi: 10.1038/sj.onc.1203280 [DOI] [PubMed] [Google Scholar]
- 36.Turbitt WJ, Black AJ, Collins SD, Meng H, Xu H, Washington S, Aliaga C, El-Bayoumy K, Manni A, Rogers CJ (2015) Fish Oil Enhances T Cell Function and Tumor Infiltration and Is Correlated With a Cancer Prevention Effect in HER-2/neu But Not PyMT Transgenic Mice. Nutr Cancer 67(6):965–975. doi: 10.1080/01635581.2015.1060351 [DOI] [PubMed] [Google Scholar]
- 37.Keleher MR, Zaidi R, Shah S, Oakley MS, Pavlatos C, El Idrissi S, Xing X, Li D, Wang T, Cheverud JM (2018) Maternal high-fat diet associated with altered gene expression, DNA methylation, and obesity risk in mouse offspring. PLoS One 13(2):1–28. doi: 10.1371/journal.pone.0192606 [DOI] [PMC free article] [PubMed] [Google Scholar]
- 38.Li J, Li K, Gao J, Guo X, Lu M, Li Z, Li D (2018) Maternal exposure to an n-3 polyunsaturated fatty acid diet decreases mammary cancer risk of female offspring in adulthood. Food Funct 9(11):5768–5777. doi: 10.1039/C8FO01006D [DOI] [PubMed] [Google Scholar]
- 39.Montales MTE, Melnyk SB, Simmen FA, Simmen RCM (2014) Maternal metabolic perturbations elicited by high-fat diet promote Wnt-1-induced mammary tumor risk in adult female offspring via long-term effects on mammary and systemic phenotypes. Carcinogenesis 35(9):2102–2112. doi: 10.1093/carcin/bgu106 [DOI] [PMC free article] [PubMed] [Google Scholar]
- 40.Ion G, Fazio K, Akinsete JA, Hardman WE (2011) Effects of canola and corn oil mimetic on Jurkat cells. Lipids Health Dis 10:1–9. doi: 10.1186/1476-511X-10-90 [DOI] [PMC free article] [PubMed] [Google Scholar]
- 41.Calder PC (2015) Marine omega-3 fatty acids and inflammatory processes: Effects, mechanisms and clinical relevance. Biochim Biophys Acta - Mol Cell Biol Lipids 1851(4):469–484. doi: 10.1016/j.bbalip.2014.08.010 [DOI] [PubMed] [Google Scholar]
- 42.Allam-Ndoul B, Guénard F, Barbier O, Vohl MC (2016) Effect of n-3 fatty acids on the expression of inflammatory genes in THP-1 macrophages. Lipids Health Dis 15(69):1–8. doi: 10.1186/s12944-016-0241-4 [DOI] [PMC free article] [PubMed] [Google Scholar]
- 43.Lee HS, Barraza-Villarreal A, Hernandez-Vargas H, Sly PD, Biessy C, Ramakrishnan U, Romieu I, Herceg Z (2013) Modulation of DNA methylation states and infant immune system by dietary supplementation with v-3 PUFA during pregnancy in an intervention study. Am J Clin Nutr 98(2):480–487. doi: 10.3945/ajcn.112.052241 [DOI] [PMC free article] [PubMed] [Google Scholar]
Associated Data
This section collects any data citations, data availability statements, or supplementary materials included in this article.
Supplementary Materials
Supplementary Figure 1 Whole mount mammary glands of C3(1)TAG/129 female mice. In pups at weaning (3 weeks old), the mammary gland was developing. In adult mice, the mammary gland was fully developed, with hyperplastic areas and tumors.