

Abstract
The effects of bone metastatic cancer on the skeleton are well described, whereas less is known regarding the effects of non-metastatic bone cancer on bone. Here we investigated the effects of three non-bone metastatic cancer cachexia models, namely Colon-26 adenocarcinoma (C26), ES-2 ovarian cancer (ES-2), and Lewis lung carcinoma (LLC). Even though C26, ES-2 and LLC tumor growth resulted in comparable weight and muscle loss, the ES-2 and LLC hosts exhibited severe bone loss, whereas only modest bone loss was observed in the C26 bearers, correlating with increased TRAP+ osteoclasts in the femurs of ES-2 and LLC but not C26 hosts. Surprisingly, all three showed increased osteocyte lacunar area indicating osteocytic osteolysis and displayed dramatically increased osteocyte death, as well as empty lacunae. To test whether tumor-secreted factors were responsible for the observed effect, IDG-SW3 osteocyte cells were co-cultured with cancer cells in permeable trans-wells. Apoptosis was observed in the osteocyte cells exposed to all three cancer cell lines suggesting that all tumors were cytotoxic for osteocytes. In addition, the expression of the osteoclastic markers, Acp5, CtsK, Atp6v0d2 and Mmp13, was elevated in IDG-SW3 osteocytes exposed to tumor factors, supporting the in vivo observations of increased lacunar size due to osteocytic osteolysis. For the first time, we describe osteocytic bone destruction and extensive osteocyte cell death in non-bone metastatic cancer. These bone alterations, in conjunction with muscle wasting, may create a musculoskeletal system that is incapable of full recovery upon eradication of tumor. Co-treatment with bone preserving therapies should be considered.
Keywords: osteocytes, osteocytic osteolysis, bone resorption, cancer cachexia
Introduction
It is estimated that 2 million new cancer cases will be diagnosed and over 600,000 people will die from cancer in the US in 2021 1. More than half of these cancer patients will die with metastatic bone disease 2 and 25% to 80% will experience muscle and adipose tissue wasting (i.e., cancer cachexia) 3. It is estimated that up to 80% of patients presenting with advanced cancers will develop highly debilitating musculoskeletal symptoms during the course of their disease 4, 5. Unfortunately, musculoskeletal complications associated with cancer can persist for months or even years after cancer remission 6,7. These complications, in association with cancer-related fatigue and the increased risk of bone fracture, lead to dramatically decreased quality of life and poorer outcomes among cancer survivors 8–10.
Because of these persistent musculoskeletal complications after cancer remission, interest in understanding the muscle-bone crosstalk during cancer progression has grown. Waning and collaborators showed that TGF-β released from osteolytic bone metastasis due to breast, prostatic and lung cancers was responsible for inducing skeletal muscle weakness 11. Some breast cancer-derived bone metastases can release the Wnt pathway inhibitor and osteocyte factor, Sclerostin, preventing bone formation 12. Treatment with an anti-Sclerostin neutralizing antibody not only reduced bone loss but also improved muscle atrophy and weakness in breast cancer hosts 12. Chemotherapy treatments can also severely compromise both muscle and bone, therefore directly contributing to the musculoskeletal complications along with the effects of the cancer. We and others have shown that the use of bisphosphonates, specific bone-targeting drugs, protects against chemotherapy-induced bone loss and improves skeletal muscle wasting and strength 13, 14. These observations emphasize the importance of understanding the tripartite interactions among cancer and muscle and bone. The pathogenesis of skeletal muscle cachexia during cancer is being extensively studied; however, less is known about adverse effects in the skeleton, especially with regards to non-bone metastatic cancer. Breast, prostate and lung cancers, which predominately metastasize to bone, generate osteolytic lesions that result in fulminate bone loss 15. Osteoclastic bone destruction is driven by metastatic tumor cells that invade bone tissue to begin a complex interaction with the bone microenvironment 16, 17. Bone lesions result in bone pain, fractures, hypercalcemia and muscle weakness that often receive palliative interventions 18, 19. It has also been shown that bone loss can occur in patients with non-bone metastatic tumors. Dumanskiy and collaborators showed that non-small lung cancer patients who had not received chemo- or radiotherapy have osteoporosis and altered bone metabolism 20. Higher prevalence of vertebral fracture was found in women with breast cancer at the time of first diagnosis without evidence of bone metastasis 9. Premenopausal patients with invasive cervical cancer showed a decreased bone mineral density (BMD) compared with an age matched group, implying an increased risk of developing osteoporosis in these patients 21.
We and others have shown bone loss in several models of cancer cachexia not associated with bone metastasis, including colorectal, ovarian and lung cancers 22–27. Further, Choi and collaborators reported a 5% reduction of total body BMD after 25 days of LLC tumor growth 26. Another study showed that bone loss in the LLC model was due to reduced bone formation rather than increased bone resorption 24. On the other hand, the C26 model showed increased bone resorption in association with hypercalcemia and elevated levels of parathyroid hormone-related protein (PTHrP), an important regulator of bone homeostasis 28, 29. Despite these observations, bone loss in the absence of bone metastasis remains an understudied area of research.
Our goal was to determine the effects of non-bone metastatic cancer not only on bone microarchitecture, but also on bone cells including osteoclasts, osteoblasts and for the first time, osteocytes. For this purpose, three well-characterized murine models of cancer cachexia using C26, LLC, and ES-2 tumor cells were used. Even though the growth of these tumors resulted in comparable body and muscle wasting, the ES-2, LLC and C26 hosts exhibited different degrees of bone loss. Our data provide evidence that the tumors can induce osteolytic bone destruction due to increased osteoclasts and/or osteocyte cell death and osteocytic osteolysis. These results provide a detailed description of the bone abnormalities beyond altered microarchitecture, which are associated with the cancer cachexia syndrome in a setting of non-bone metastatic tumor.
Methods
Cell cucultes
Murine C26 colon adenocarcinoma cells (C26) were provided by Donna McCarthy (Ohio State University, Columbus, OH, USA) and cultured in high-glucose (4.5 g/L) DMEM supplied with 10% fetal bovine serum, 1% glutamine, 1% sodium pyruvate, and 1% penicillin and streptomycin. Cells were maintained in a 5% CO2, 37°C humidified incubator. Human ES-2 ovarian cancer cells were purchased from American Type Culture Collection (ATCC) (CRL-1978; Manassas, VA, USA) and were cultured in McCoy’s medium supplied with 10% fetal bovine serum, 1% glutamine, 1% sodium pyruvate, and 1% penicillin and streptomycin in a 5% CO2, 37°C humidified incubator. Murine Lewis Lung Carcinoma cells (LLC) were provided by Dr. Paola Costelli (University of Torino, Italy) and were cultured in DMEM medium supplied with 10% fetal bovine serum, 1% glutamine, 1% sodium pyruvate, and 1% penicillin and streptomycin in a 5% CO2, 37°C humidified incubator. IDG-SW3 cells were cultured as described previously 30. These cells are immortalized with a temperature sensitive T-antigen that is induced by interferon gamma (IFN-γ), therefore they proliferate under permissive conditions (33°C and 5% CO2 in α-MEM with 10% FBS, 100 U/ml penicillin, 50μg/ml streptomycin) (all Hyclone, South Logan, UT) and 50 U/ml IFN-γ (Life Technologies, Carlsbad, CA) on type I collagen coated plates. For experiments, cells were plated at a density of 4×10⁴ cells/cm2 in collagen coated 6 or 12-well plates (Corning, Tewksbury, MA). Once the cultures reached confluence, the media was replaced with osteogenic media (α-MEM with 10% FBS, 100 U/ml penicillin, 50 μg/ml streptomycin, 50μg/ml ascorbic acid and 4mM β-glycerophosphate) (both Sigma-Aldrich, St. Louis, MO) in the absence of IFN-γ and cells were cultured at 37°C in 8% CO2. Media was changed every three days. The cells were differentiated until 5 or 21 days of culture, to acquire an osteoblastic or mature osteocyte-like phenotype respectively. In order to determine the effects of the tumor-secreted factors on osteoblasts or mature osteocytes, IDG-SW3 cells at 5 and 21 days of differentiation were co-cultured with C26, ES-2 and LLC cells using trans-well permeable inserts (Thermo Fisher Scientific, #12565009) for 24, 48, 72 h or 6 days. MLO-Y4 cells were maintained on collagen type I-coated plates in α-MEM supplemented with 2.5% fetal bovine serum (FBS), 2.5% calf serum (CS), and 100 U/mL penicillin/streptomycin (P/S) in a 5% CO2 incubator at 37°C. For all assays, phenol red-free a-MEM was used. In order to determine the effects of the tumor factors on early osteocytes, MLO-Y4 cells were exposed for up to 24 h, to 30% or 40% conditioned medium (CM) collected from confluent C26, ES-2 or LLC culture plates.
Animals
All animal studies were approved by the Institutional Animal Care and Use Committee at Indiana University School of Medicine and complied with the National Institutes of Health Guidelines for Use and care of Laboratory Animals and with the 1964 Declaration of Helsinki and its later amendments. All animals were maintained on a regular dark-light cycle (light from 8 a.m. to 8 p.m.), with free access to food and water during the whole experimental period. For the colon 26 (C26) xenograft model, 8-wk-old CD2F1 male mice (Envigo, Huntingdon, United Kingdom) were used. Mice were randomized into 2 groups: control mice inoculated with sterile saline and tumor-bearing animals injected subcutaneously and intrascapularly with 1 × 10⁶ C26 adenocarcinoma cells. For the ES-2 experiments, 8-week old female NOD-scid/IL2Rgnull (NSG) immunodeficient mice (In Vivo Therapeutics Core Facility, IU Simon Cancer Center, Indianapolis, IN) were used and housed in a pathogen-free facility at IU LARC (up to 5 per cage). Mice were randomized into 2 groups: control mice inoculated with sterile saline and tumor-bearing animals were inoculated intraperitoneally (i.p.) with 1×10⁷ ES-2 cells in sterile saline. For the LLC experiments, 8-week old male C57BL/6 (Jackson Laboratories, Bar Harbor, ME, USA) were used. Mice were randomized into 2 groups: control mice inoculated with sterile saline and tumor-bearing animals were inoculated subcutaneously and intrascapularly with 1 × 10⁶ LLC cells in sterile saline. The experiments were stopped when the animals reach a stage of severe cancer cachexia. In particular, after 2 weeks from the injection for the C26 and ES-2 models and 4 weeks from the LLC injection as previously published23, 24, 31.
Micro computed tomography (μCT) analysis of femurs and vertebrae bone morphometry
MicroCT (μCT) scanning was performed to measure morphological indices of metaphyseal regions of femurs, as described in Bouxsein et al 32. After euthanasia, the mouse carcasses were fixed for 2 days in 10% neutral buffered formalin, transferred into 70% ethanol, the right femurs dissected, and prepared for μCT scanning on a high-throughput μCT specimen scanner Bruker Skyscan 1176 (Bruker, Kontich, Belgium). Bone samples were rotated around their long axes and images were acquired with the following parameters: pixel size = 9 μm3; peak tube potential = 50 kV; X-ray intensity = 500 μA; 0.3° rotation step. Raw images were reconstructed using SkyScan reconstruction software (NRecon; Bruker, Kontich, Belgium) to 3-dimensional cross-sectional image data sets using a 3-dimensional cone beam algorithm. Structural indices were calculated on reconstructed images using the Skyscan CT Analyzer software (CTAn; Bruker, Kontich, Belgium). Trabecular bone was separated using a custom processing algorithm in CTAn, based on the different thicknesses of the structures. Trabecular bone was analyzed between 0.5 mm to 1.5 mm for the ES-2 model and between 1 mm to 2 mm for the C26 and LLC models under the femoral distal growth plate using a threshold of 80 – 255. Trabecular parameters included bone volume fraction (BV/TV), number (Tb.N), thickness (Tb.Th), separation (Tb.Sp), connectivity (Conn.Dn) and pattern factor (Tb.Pf). The Tb.Pf is a measure of trabecular connectedness that describe the three-dimensional configuration of trabeculae. In particular, considering the relation between convex and concave trabecular surfaces indicates if the structures are well-connected or not 33. Cortical bone was analyzed by threshold of 160–255 in femoral mid-shaft. Cortical parameters included bone volume fraction (BV/TV) and cross-sectional thickness (Cs.Th).
Bone Histomorphometry
Femura from 2 months old mice were fixed in 10% neutral buffered formalin and embedded in paraffin and methyl methacrylate (MMA) using previously established, standard histology methods at the ICMH Histology and Histomorphometry Core [link to reference]. Osteoclasts in the cancellous bone of the femur and osteocytic osteocytes of the femoral mid-diaphysis were quantified in TRAP/Toluidine blue stained transverse and crossectional femoral sections respectively. Osteoblasts were quantified on transverse femoral sections using von Kossa/McNeal stained-sections. Osteocyte apoptosis was detected in paraffin/calcified transverse mid-diaphysis femur sections by TdT-mediated dUTP nick-end labeling (TUNEL) using a modified version of a commercial kit (EMD Millipore, Billerica, MA, USA) in sections counterstained with 2% methyl green, as published. Histomorphometric analysis was performed using OsteoMeasure high resolution digital video system (OsteoMetrics Inc., Decatur, GA, USA). The terminology and units used are those recommended by the ASBMR Histomorphometry Nomenclature Committee 34.
Osteoclast differentiation assay
BMCs were isolated from at least two 4-month-old wild-type male C57BL/6 mice by flushing the bone marrow out from both tibiae and femora with 10% FBS and 1% P/S-α-MEM and cultured these cells for 48h 35, 36. Next, non-adherent cells were collected and 14×104 cells/cm2 were seeded on 96-well plates and cultured with RANKL 80ng/ml (PeproTech) and M-CSF 20ng/ml (PeproTech) added to induce osteoclast differentiation, the media was changed every 2 days. After 3 days of differentiation, 5% media conditioned by 3T3, ES-2, C26 and LLC tumors grown in α-MEM10% FBS and 1% P/S was added to the osteoclast differentiation media for 48 hours, after which cells were fixed for staining. Cells were stained using a TRAP kit (Sigma-Aldrich) and mature osteoclasts exhibiting 3 or more nuclei were quantified. Images were acquired using Axio Observer.Z1 motorized microscope (Zeiss, Oberkochen, Germany) 35.
Mineralization assay
IDH-SW3 cell were fixed with 1% formalin for 10 minutes at room temperature and stained with 1% alizarin red S solution for 10 min at room temperature. Next, the solution was removed, and the cells were washed several times with ddH2O. Images were acquired using an Axio Observer.Z1 motorized microscope (Zeiss, Oberkochen, Germany). Stained areas of the images, mineralized nodules and total area, were quantified using ImageJ software (NIH, Bethesda, MD, USA). To quantify total alizarin red S-retained mineral, 10% (v/w) cetylpyridinium chloride (Sigma-Aldrich, St. Louis, MO, USA) in sodium phosphate was used and solute measured at 570 nm.
Backscatter scanning electron microscopy (BSEM)
For BSEM, the MMA embedded blocks remaining after sectioning for histology were polished with 600 and then 1200 grit abrasive disk (premium grade, silicon carbide; LECO #810-229-PRM and #810-036-500). The samples were also polished, using a nylon polishing cloth (LECO #810-462), with grade aluminum oxide polishing powders α C Alumina, 1.0 μm, α A Alumina, 0.3 μm and γ B Alumina, 0.05 microns (LECO #810-786, #810-82, LECO #810-778). After each step the specimens were sonicated in dH2O / RO water. The MNA embedded blocks were adhered to an aluminum stub with a carbon adhesive tab, then carbon coated (Denton Sputter Coater Desk V Turbo, Moorestown, NJ). The blocks were then viewed on a JEOL 6390 LV scanning electron microscope (Peabody, MA) using Backscatter mode (BSE) at 15KV with a spot size of 60nm and working distance of 15–18nm. Serial images (4 per bone) were taken at 400x magnification beginning at a distance of approximately 1mm below the growth plate. Binarized images were analyzed using ImageJ software with a threshold of 50–255 to automatically detect osteocyte lacunae. Objects identified as lacunae but smaller than 10 μm2 or larger than 100 μm2 were excluded from the analysis. Individual lacunar area was quantified and expressed as the mean of all counted lacunae or the largest 20% of lacunae as described in Qing et al. 37
Osteocyte enriched bone chips
Tibiae and femora were dissected from control and C26 or ES-2 tumor-bearing mice, the soft tissue removed and the periosteum scraped with a scalpel. The epiphyses were removed and the marrow flushed with a 27-gauge needle and sterile PBS. The bone was cut into 1–2 mm pieces and washed three times in sterile HBSS (Hyclone). The bone pieces were then digested in 2 mg/mL collagenase (Sigma) for 25 min at 37 °C on a rotating platform. The bone pieces were then washed three times in HBSS and digested a second time in 2 mg/mL collagenase for 25 min. After a further three washes in HBSS the bone pieces were incubated in a solution of 5 mM EDTA/0.1% BSA (Sigma) for 25 mins. The bone pieces were then washed in HBSS, snap frozen in liquid nitrogen and stored at −80°C for further analyses.
Cell death assay
In order to determine the effects of the tumor factors on osteocytes, MLO-Y4 cells were plated at 1−1.25 × 10⁴/cm2 on a collagen-coated 96-well plate and exposed for up to 24 h, to 30% or 40% conditioned medium (CM) collected from confluent C26, ES-2 or LLC culture plates. Positive control MLO-Y4 cells were treated with 0.3 mM hydrogen peroxide (EMD Millipore, HX0635-3) for 3–4 hr in 0.5% FBS/0.5% CS/α-MEM to induce 20%–40% cell death. Cells were stained with 2 μM ethidium homodimer 1 (EthD-1, Invitrogen, E1169) for 30 min and analyzed on a Nikon Eclipse TE300 inverted fluorescence microscope to detect dead cells. Images were acquired under 10× magnification using epifluorescence illumination with a Photometrics Coolsnap EZ cooled charge-coupled device (CCD) camera interfaced with ImageJ, and we quantified thresholded images using a function of particle analyzer in ImageJ (NIH). Percentage of cell death was calculated as EthD-1-positive cells divided by the total number of cells stained with 5 μg/mL Hoechst 33342 (Invitrogen, H1399) as a nuclear counterstain. Data are presented as fold change over the level of cell death in the sample treated with hydrogen peroxide alone.
LDH cytotoxicity assay
Lactate dehydrogenase (LDH) was measured in the CM of the IDG-SW3 cells at 21 days of differentiation co-cultured using trans-well permeable inserts with NIH 3T3, C26, ES-2 and LLC cells for 24 and 72 hours following the manufacturing guidelines (Invitrogen, C20300).
Lactate assay
Lactate was measured in the CM of the IDG-SW3 cells at 21 days of differentiation co-cultured using trans-well permeable inserts with NIH 3T3, C26, ES-2 and LLC cells for 24 and 72 hours following the manufacturing guidelines (Abcam, ab65331).
Western Blotting
Total protein extracts were obtained by lysing cell layers in RIPA buffer (150 mM NaCl, 1.0% NP-40, 0.5% sodium deoxycholate, 0.1% SDS, and 50 mM Tris, pH 8.0) completed with protease (Roche, Indianapolis, IN) and phosphatase (Thermo Scientific, Rockford, IL) inhibitor cocktails. After 10 minutes incubation on ice, cell debris were removed by centrifugation (15 min, 14000 g) and the supernatant collected and stored at −80°C. Protein concentration was determined using the BCA protein assay method (Thermo Scientific, Rockford, IL). Protein extracts (30 μg) were then electrophoresed in 4–15% gradient SDS Criterion TGX precast gels (Bio-Rad, Hercules, CA). Gels were transferred to nitrocellulose membranes (Bio-Rad, Hercules, CA). Membranes were blocked with SEA BLOCK blocking reagent (Thermo Scientific, Rockford, IL) at room temperature for 1 h, followed by an overnight incubation with diluted antibody in SEA BLOCK buffer containing 0.2% Tween-20 at 4°C with gentle shaking. After washing with PBS containing 0.2% Tween-20 (PBST), the membrane was incubated at room temperature for 1 h with either Anti-rabbit IgG (H+L) DyLight 800 or Anti-mouse IgG (H+L) DyLight 600 (Cell Signaling Technologies, Danvers, MA). Blots were then visualized with Odyssey Infrared Imaging System (LI-COR Biosciences, Lincoln, NE). Antibodies used were Caspase-3 (#9665), Cleaved caspase-3 (#9664) and from Cell Signaling and α-tubulin (12G10; Developmental Studies Hybridoma Bank).
Real-time quantitative polymerase chain reaction (qRT-PCR)
Total RNA from cell cultures or the osteocyte enriched samples was isolated using the miRNeasy Mini kit (Qiagen, Valencia, CA, USA) and following the protocol provided by the manufacturer. RNA was quantified by using a Synergy H1 spectrophotometer (Biotek, Winooski, VT, USA). Total RNA was reverse transcribed to cDNA by using the Verso cDNA kit (Thermo Fisher Scientific, Waltham, MA, USA). Transcript levels were measured by Real-Time PCR (Light Cycler 96, Roche, Indianapolis, IN, USA) taking advantage of the TaqMan gene expression assay system (Life Technologies, Carlsbad, CA). Expression levels for Tnfsf11 (Mm00441906m1), Tnfrsf11b (Mm00435454_m1), Tnfa (Mm00443258_m1), Bax (F: 5’-TGAAGACAGGGGCCTTTTTG-3’, R: 5’-AATTCGCCGGAGACACTCG-3’), Bcl-2 F: (5’-GTCGCTACCGTCGTGACTTC-3’, R: 5’-CAGACATGCACCTACCCAGC-3’), Dmp1 (Mm.PT.58.8804152), Sost (Mm00470479_m1), Apc5 (Mm00475698_m1), Ctsk (Mm00484036_m1), Atp6v0d2 (Mm01222963_m1), Mmp13 (Mm00439491_m1), Kera (Mm005152230_m1), Alpl (Mm00475834_m1) and Osteocalcin (Mm.PT.589119501.g) were detected. Gene expression was normalized to βactin (Mm.PT.39a.22214843.g) or TATA-binding protein (Tbp1) (Mm01277042_m1) for primary osteocyte and IDG-SW3 cells respectively, using the standard 2-ΔΔCT methods.
Statistics
Nominal data were displayed as proportions of whole (percentage) and analyzed with Pearson’s χ2 test. Ordinal data were written as mean ± SD and analyzed using 2-sided Student’s t-test or MannWhitney test followed by post hoc test as appropriate, or one-way analysis of variance (ANOVA) followed by Tukey’s post-test. Differences were considered significant when p<0.05.
Results
Effects of non-bone metastatic tumors on bone microarchitecture.
Mice bearing the C26, ES-2 and LLC tumor cells show a comparable degree of cachexia, including severe muscle atrophy and white adipose tissue wasting 22, 23, 38. Bone microarchitecture showed different degrees of bone loss in the absence of any bone metastases (Figure 1, S1 and S2). Similar to our previous observations 22 the C26 model is associated with a mild trabecular bone loss, with significant reduction only in trabecular thickness (Tb.Th; Figure 1A and B). As previously describe 23, 24, the ES-2 and LLC hosts, instead displayed dramatic loss of trabecular bone, as evidenced by markedly reduced bone volume fraction (BV/TV), Tb.Th, trabecular number (Tb.N) and connectivity density (Conn.Dn), as well as by increased trabecular separation (Tb.Sp) and pattern factor (Tb.Pf; Figure 1A, B and S1). The analysis of the cortical bone volume fraction (BV/TV) and cross sectional thickness (Cs.Th) did not show any changes in the C26 and ES-2 tumor-bearing mice (Figure 1C and D). On the other hand, mice bearing LLC showed a severe reduction of cortical BV/TV and Cs.Th (Figure 1C and D), as well as periosteal porosity (Figure 1C).
Fig. 1: Effects of non-bone metastatic tumors on bone microarchitecture.
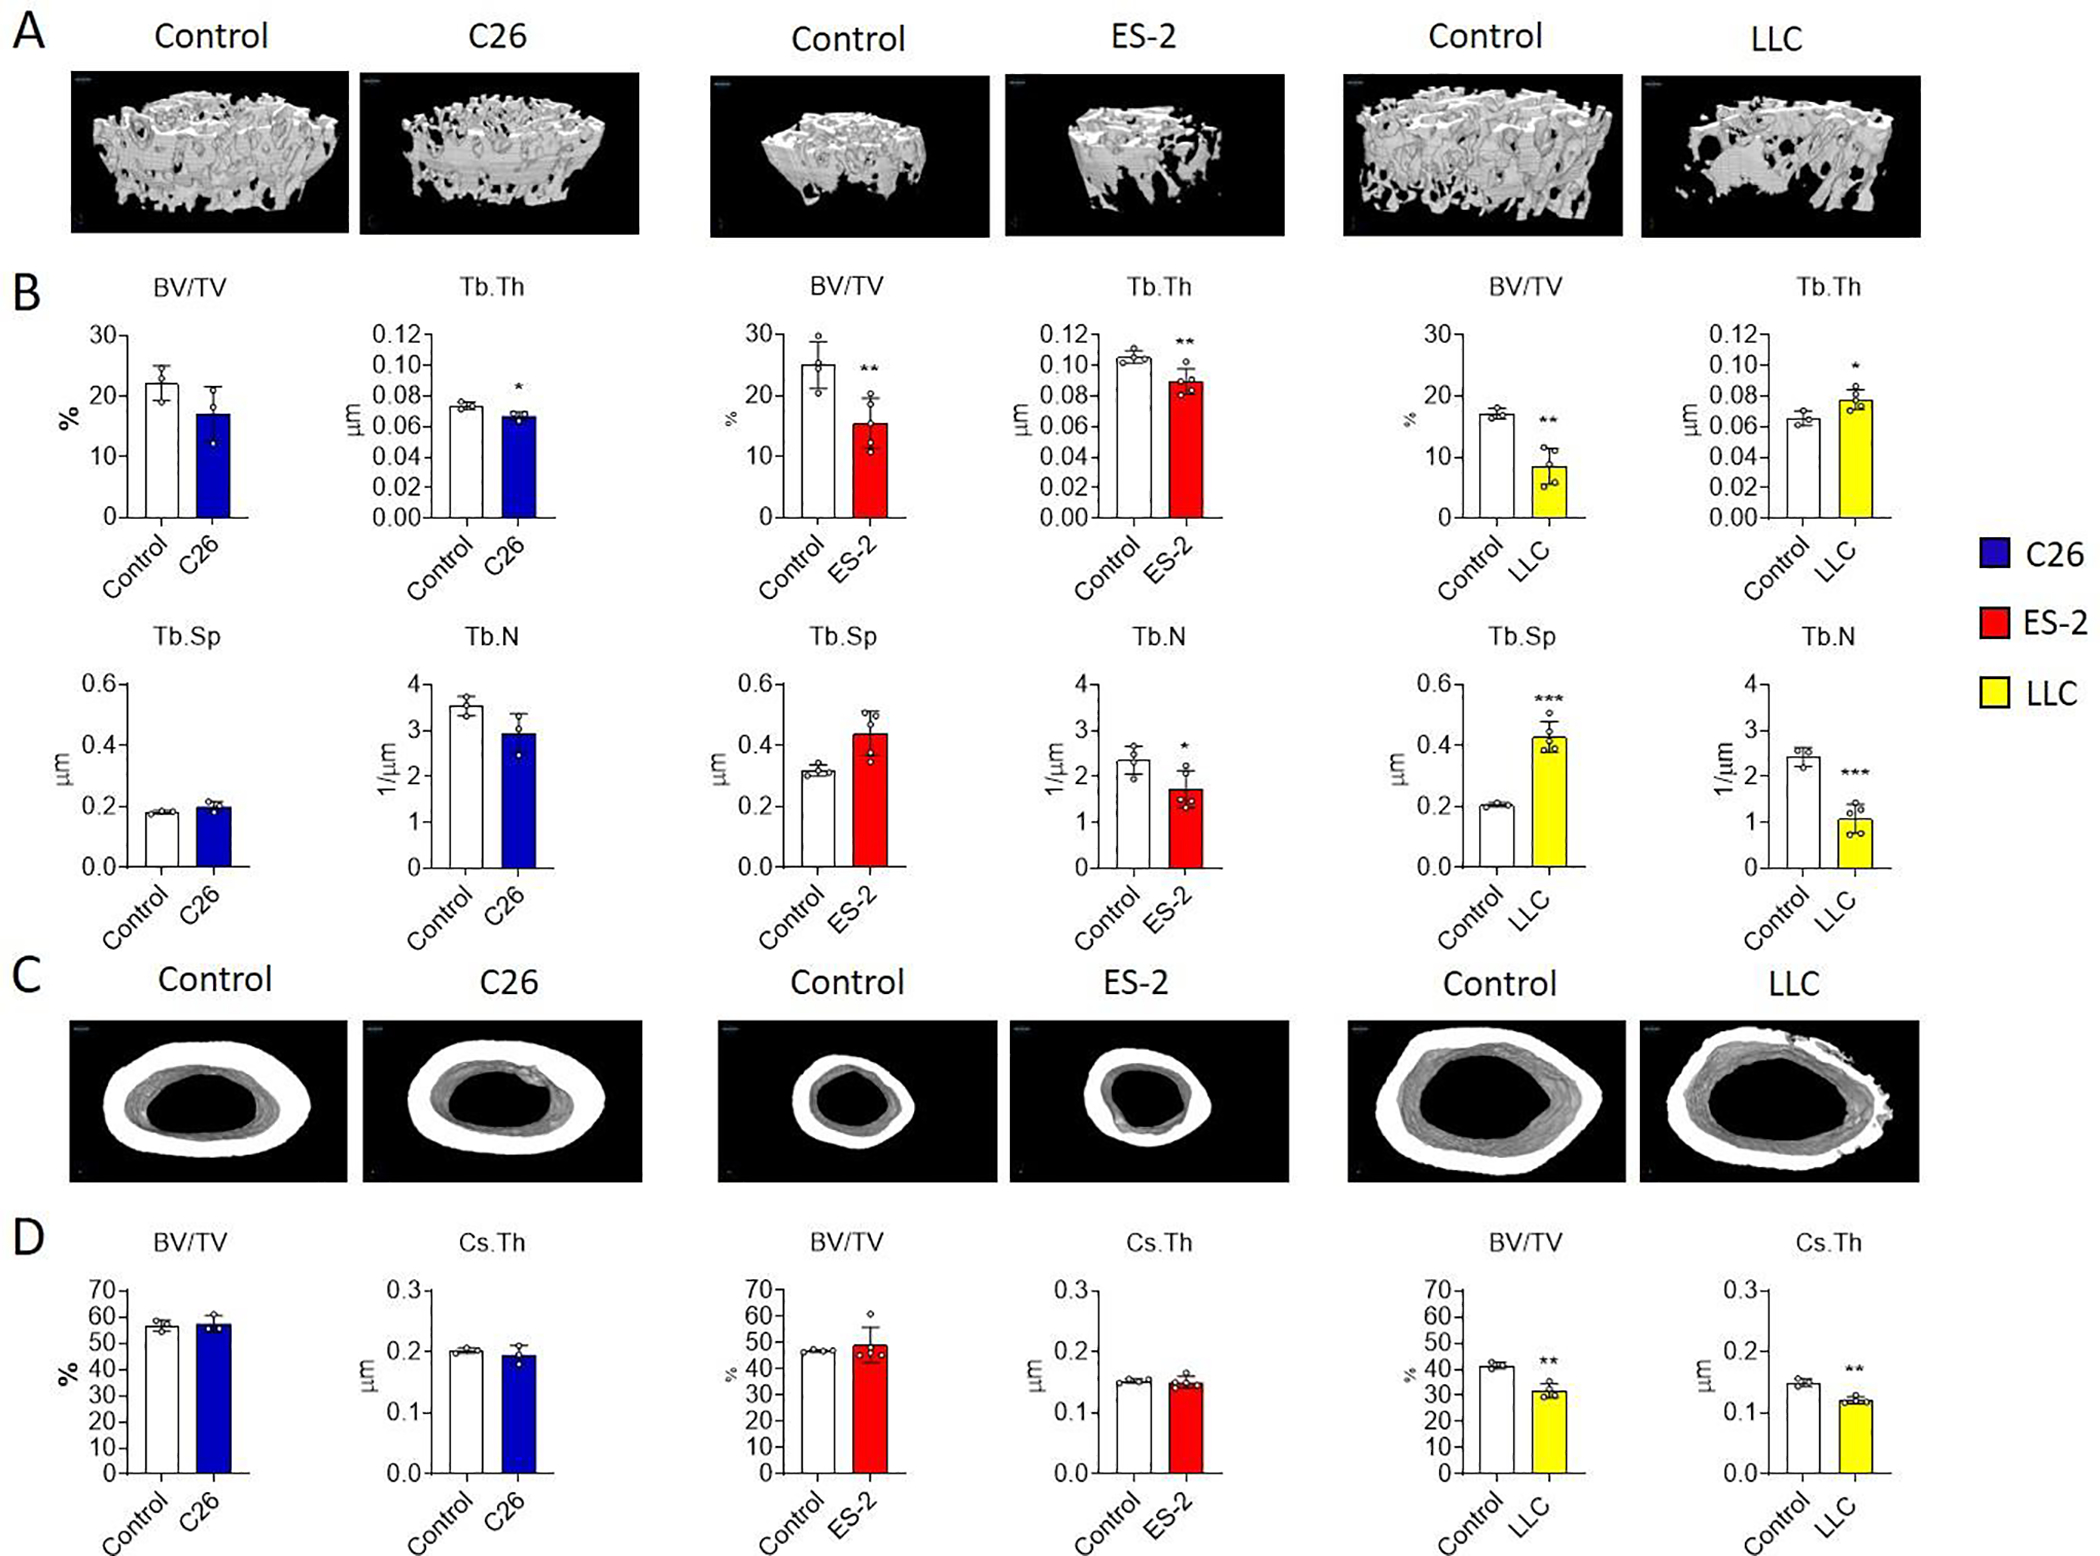
A-B: 3D rendering and assessment of trabecular bone volume fraction (BV/TV; expressed as %), trabecular thickness (Tb.Th; expressed as μm), trabecular separation (Tb.Sp; expressed as μm) and trabecular number (Tb.N; expressed as 1/μm) in the femurs from control (N = 3, 4 and 3) and C26 (N = 3), ES-2 (N = 5) and LLC (N = 5) tumor-bearing mice. C-D: 3D rendering and assessment of cortical bone volume fraction (BV/TV; expressed as %) and cross-sectional thickness (Cs.Th; expressed in μm) in the femurs from control mice (N = 3, 4 and 3) and from C26 (N = 3), ES-2 (N = 5) and LLC (N = 4) tumor-bearing mice. Data were expressed as means ± SD. Significant differences: *p<0.05, **p<0.01, ***p<0.001 vs. Control (unpaired t-test).
Effects of non-bone metastatic tumors on osteoclast number in vivo and osteoclast differentiation in vitro.
In order to clarify if the altered bone microarchitecture in our models was associated with increased presence of mature osteoclasts, TRAP stained multinucleated cells in longitudinal sections from femurs were quantified. The images and the histomorphometric analysis showed no difference in the number of osteoclasts per bone perimeter (N.Oc/B.Pm) and osteoclasts surface per bone surface (Oc.S/BS) in the trabecular bone of C26 tumor-bearing mice (Figure 2A and B). However, both the ES-2 and the LLC models displayed a significant increase in osteoclasts in the trabecular bone, as shown by the increase of N.Oc/B.Pm and Oc.S/BS (Red arrows in the pictures; Figure 2A and B). Further, we found that addition of conditioned media (CM) from C26, ES-2 or LLC cells increase the differentiation of bone marrow (a source of osteoclast progenitors) into osteoclasts, compared to CM from NIH 3T3 cells (used here as controls as these are nontumor cells) consistent with cancer cell-derived factors inducing osteoclastogenesis (Figure 2C and D).
Fig. 2: Effects of non-bone metastatic tumors on osteoclast number in vivo and osteoclast differentiation in vitro.
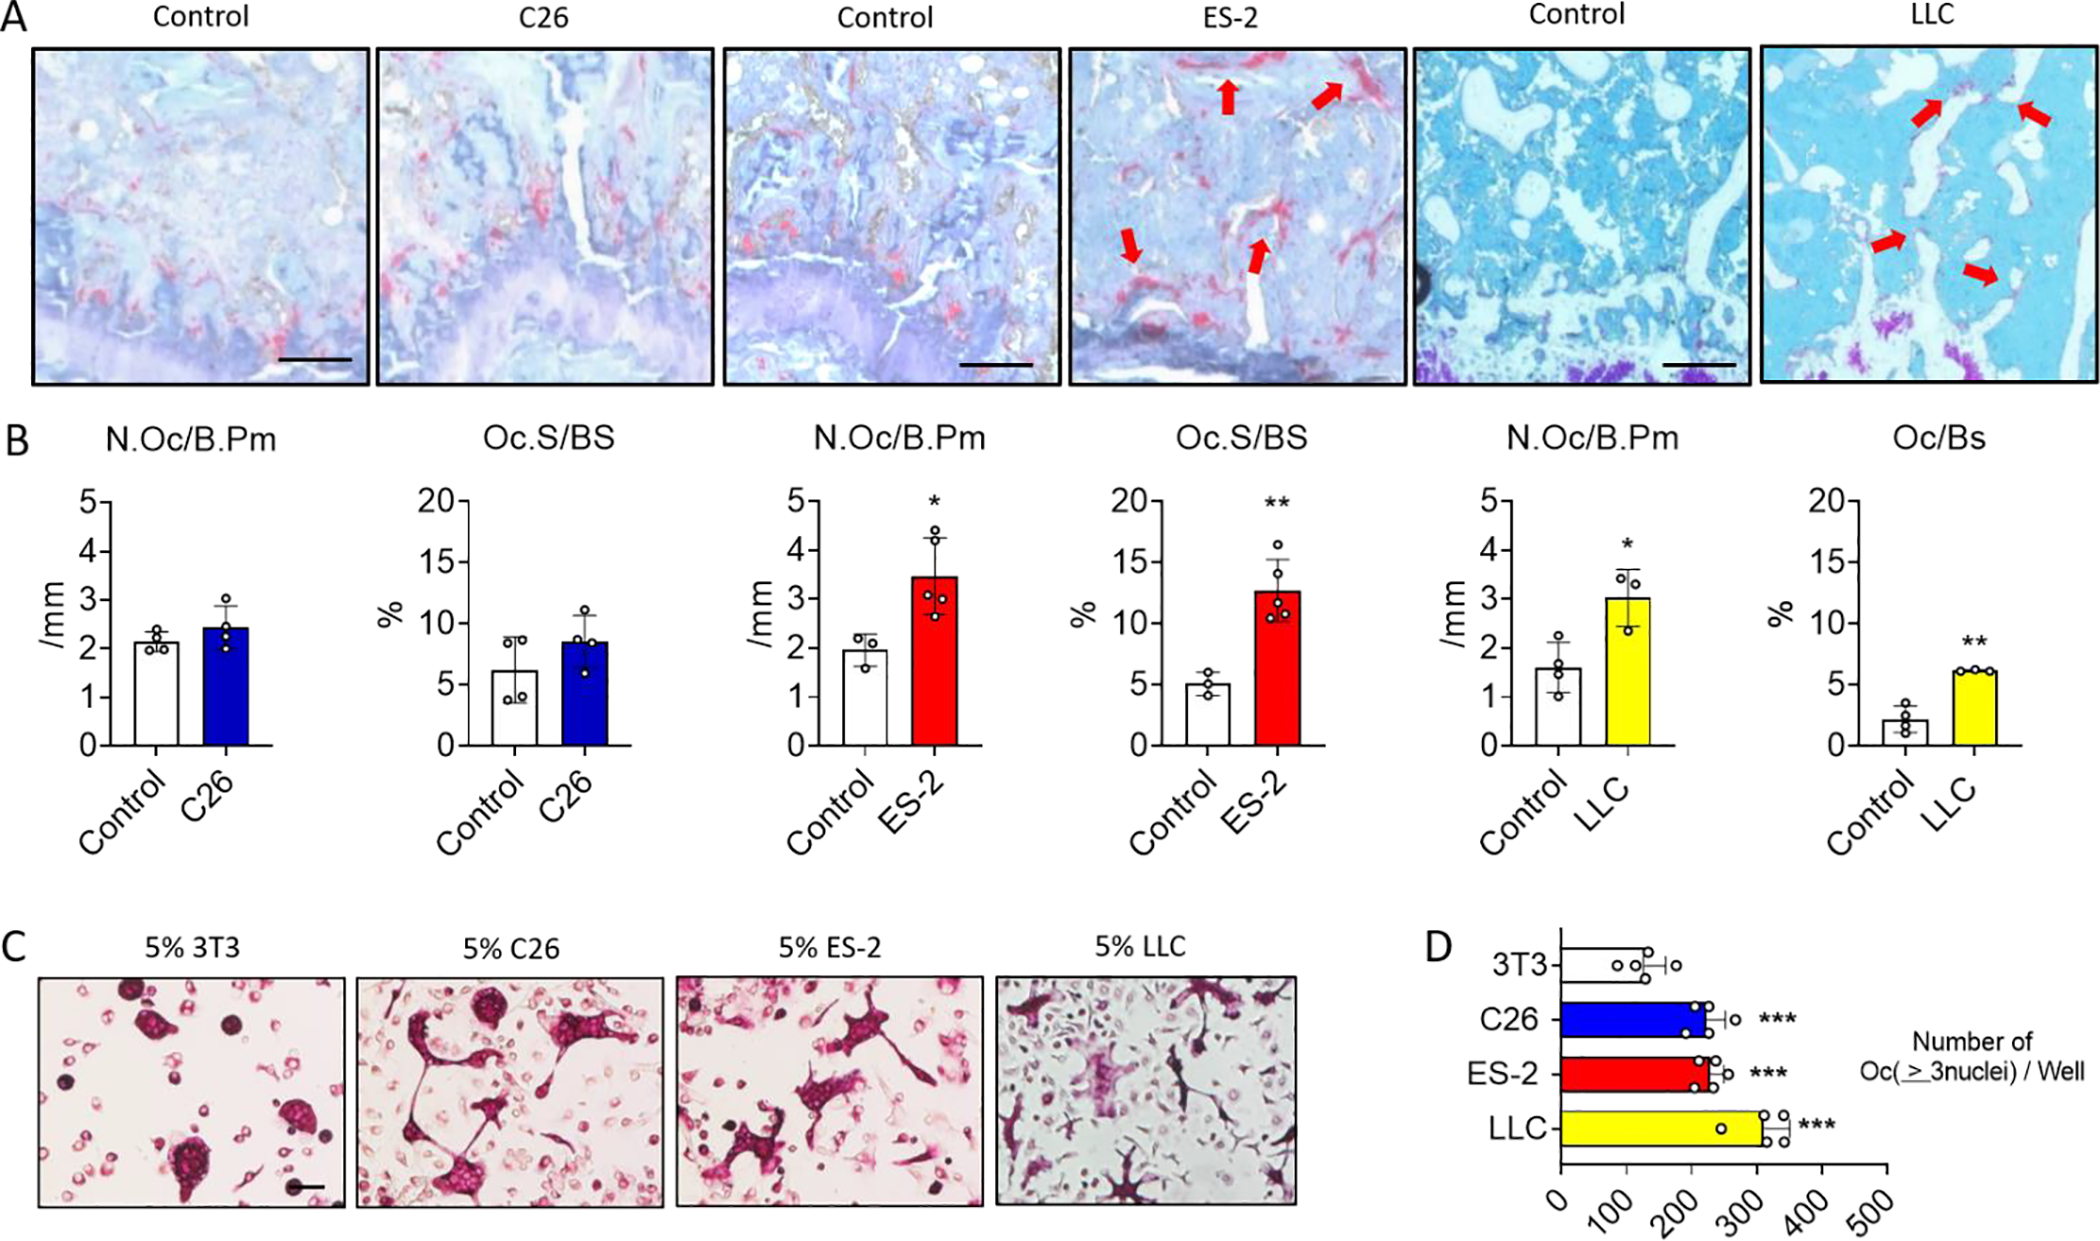
A: TRAP-stained longitudinal sections from the distal femur of control and C26, ES-2 or LLC tumor-bearing mice. The scale bar represents 50μm. B: Histomorphometric quantification of osteoclast number per bone perimeters (N.Oc/Pm; expressed in/mm) and osteoclast surface per bone surface (Oc.S/BS; expressed as a %) in femoral trabecular bone of control mice (N = 4, 3 and 4) and C26 (N = 4), ES-2 (N = 5) or LLC (N = 3) tumor-bearing mice. C-D: Representative photomicrographs and quantification of TRAP+ multi-nucleated osteoclasts derived from bone marrow macrophage cultures exposed to 5% of NIH 3T3, C26, ES-2 and LLC-derived CM (N = 5). The scale bar represents 50μm. Data were expressed as means ± SD. Significant differences: *p<0.05, **p<0.01 vs. Control or NIH 3T3 (unpaired t-test or one-way ANOVA with Tukey’s test).
Effects of non-bone metastatic tumors on osteoblast mineralization in vivo and in vitro.
As both a decrease in osteoblast number and/or function can contribute to bone loss, bones were stained with von Kossa/McNeal staining to visualize the osteoblasts, osteoid and mineralized bone matrix. The images and the histomorphometric analysis of femur longitudinal sections showed a significant reduction in the number of osteoblasts per bone perimeter (N.Ob/B.Pm) and osteoblast surface per bone surface (Ob.S/BS) in the trabecular bone of all three models of cancer cachexia (Red arrows in the pictures; Figure 3A and B). This reduction was also associated with a complete loss of osteoid (stained light blue on the bone surface) as indicated by the red arrows in the image and by the quantification of osteoid per bone surface (OS.BS; Figure 3A and B). Moreover, we observed the presence of dystrophic mineralization in bone marrow adjacent to the trabecular bone of the C26 hosts (Yellow arrows in the picture; Figure 3A). In order to investigate the effects of cancer-derived factors on osteoblast cell, IDG-SW3 cells which express the Dmp1-GFP reporter, at 5 days of differentiation, were co-cultured with C26, ES-2 and LLC cells plated on trans-wells for 24 or 72 hours. Dmp1-GFP expression was reduced in osteoblasts co-cultured with tumor cells in comparison with control NIH 3T3 cells as can be seen by fluorescence microscopy at 72 hours. Moreover, specific markers of osteoblast such as Kera, Alpl and Osteocalcin were reduced by the tumor cell lines (Figure 3 C and D). We then tested the ability of soluble factors released by cancer cells to modify mineralization in vitro. For this, IDG-SW3 cells differentiated for 21 days (mature osteocytes) were co-cultured with tumor cells for additional 6 days. After removing the trans-well containing the tumor cells, the plates containing the osteocyte cells were stained with Alizarin red to visualize calcium deposition. Quantification of the Alizarin red and the total mineralized area showed less mineral when the osteocytes were co-cultured with the C26, ES-2 and LLC cells compared to the control NIH 3T3 cells (Figure S3).
Fig. 3: Effects of non-metastatic tumors on osteoblasts in vivo and mineralization in vitro.
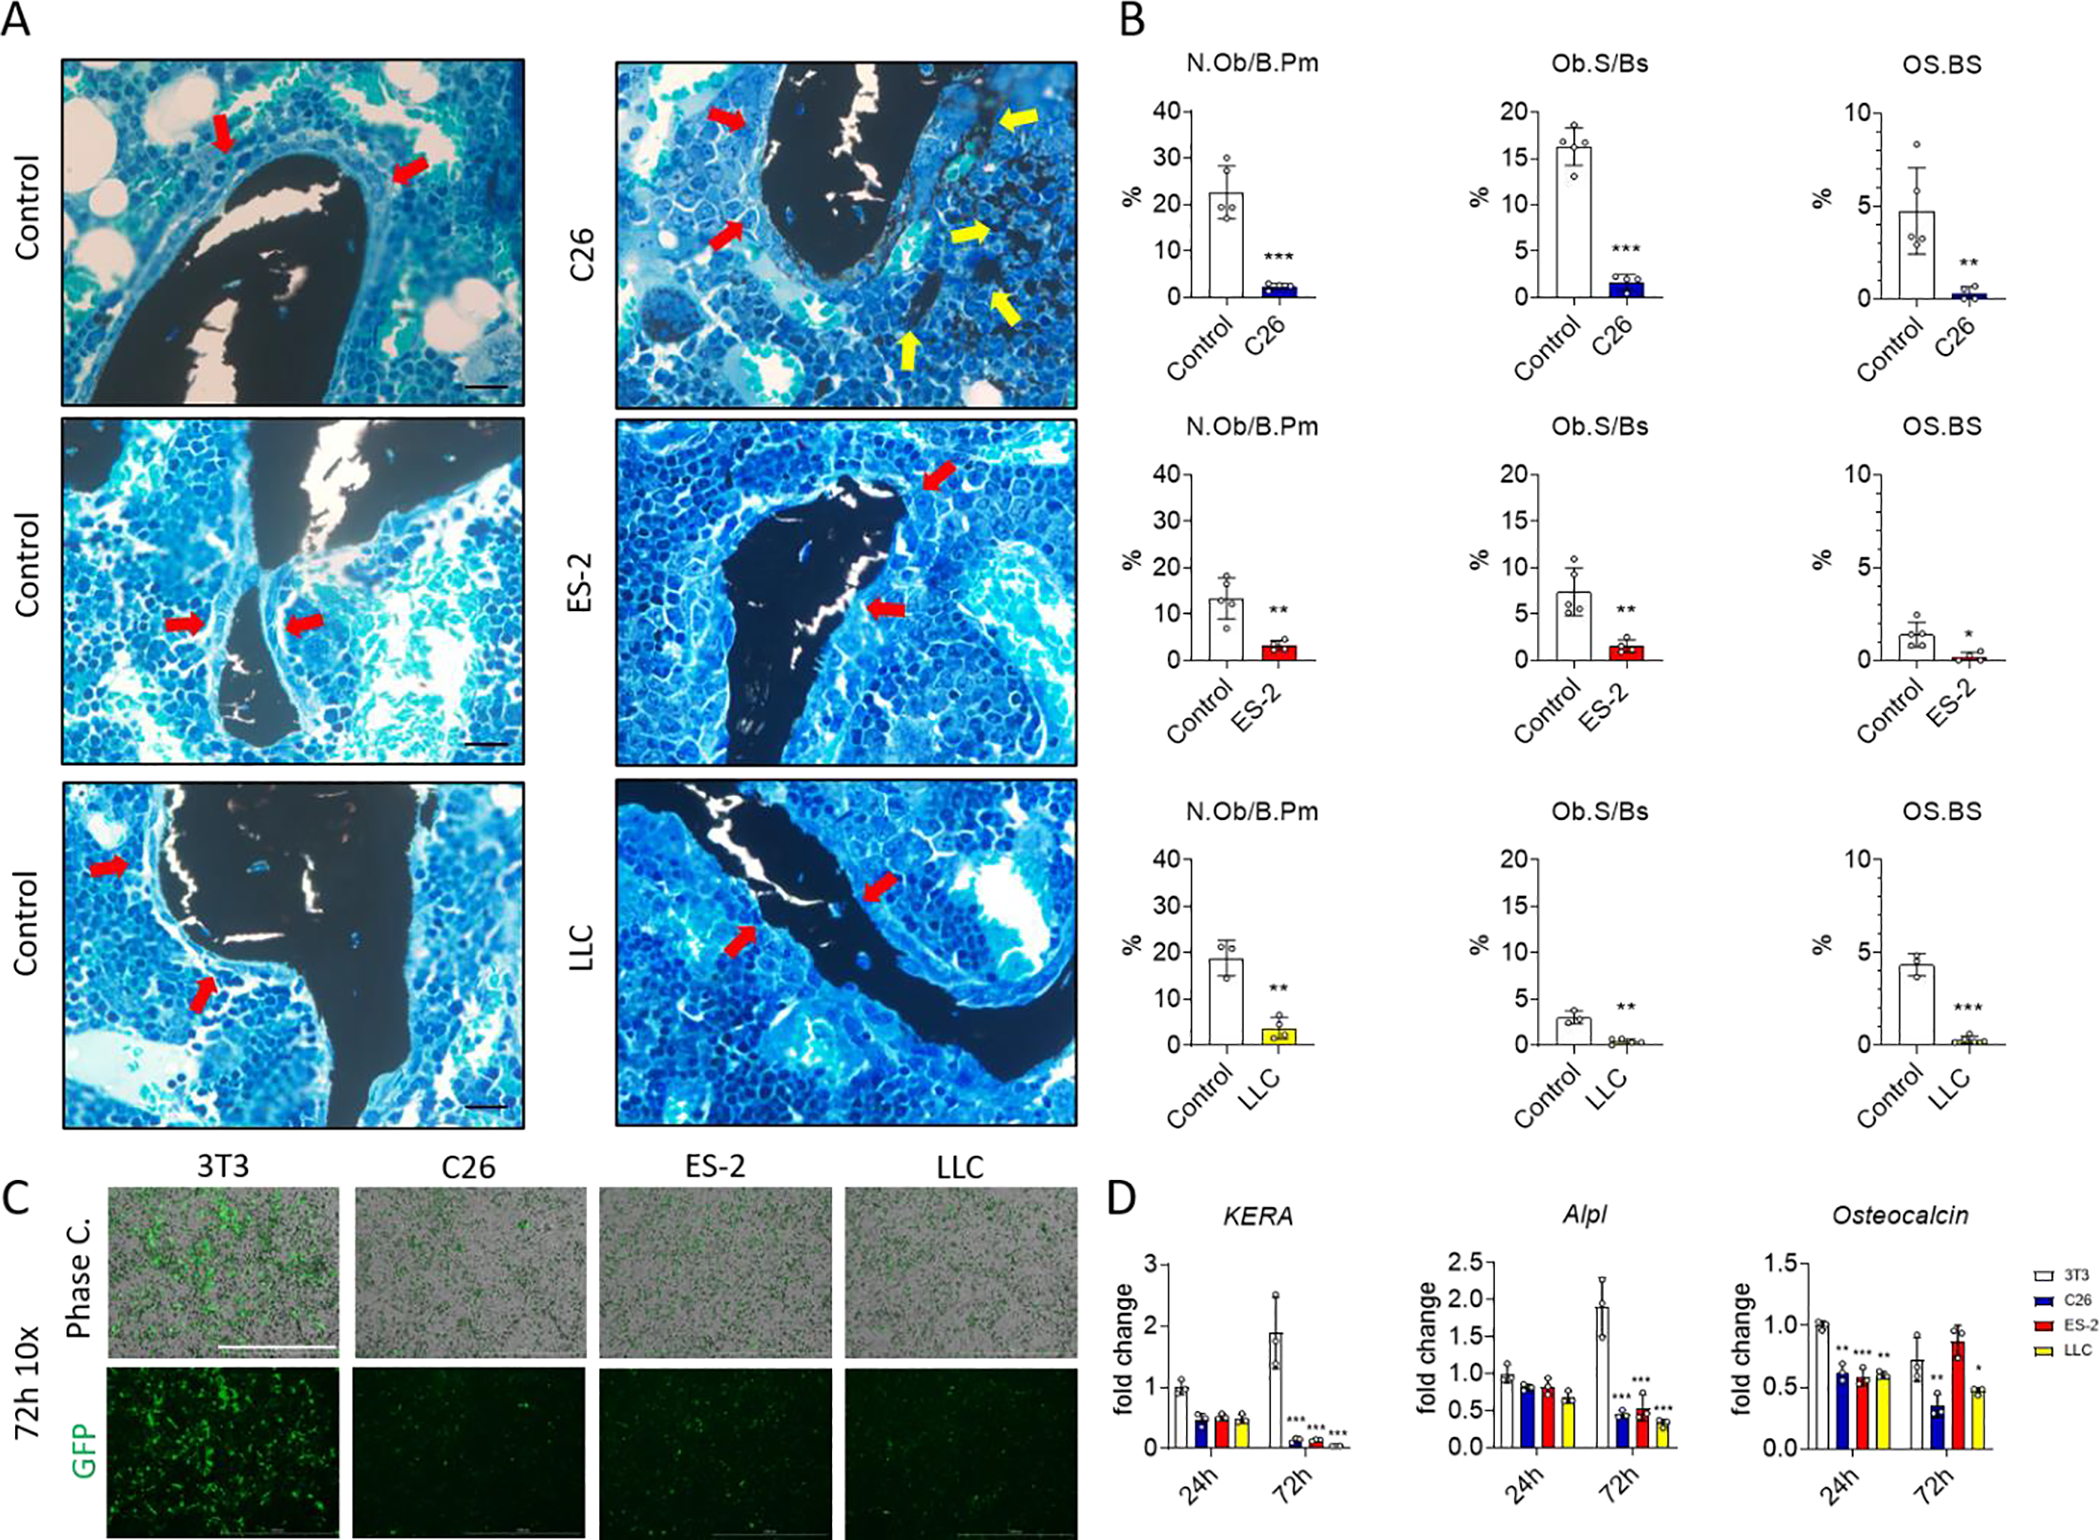
A: von Kossa/McNeal-stained longitudinal sections from the distal femur in control and C26, ES-2 or LLC tumor-bearing mice. The scale bar represents 20μm. B: Histomorphometric quantification of osteoblast number per bone perimeter (N.Ob/Pm; expressed as a %), osteoblast surface per bone surface (Ob.S/BS) and osteoid surface per bone surface (OS/BS; expressed as a %) in femoral trabecular bone of control mice (N = 5, 5 and 3) and C26 (N = 4), ES-2 (N = 4) or LLC (N =5) tumor-bearing mice. C: Phase contrast (top) and Dmp1-GFP (bottom) images of IDG-SW3 cells at 5 days of differentiation (osteoblast) co-cultured with NIH 3T3, C26, ES-2 and LLC cells for 72 hours (N =3). The scale bar represents 1000μm. D: Expression of the indicated genes normalized to TATA-binding protein (Tbp1), in IDG-SW3 cells at 5 days of differentiation co-cultured with 3T3, C26, ES-2 and LLC cells for 24 and 72 hours (N =3). Gene expression is expressed as fold change vs. 3T3 at 24 hours. Data were expressed as means ± SD. Significant differences: *p<0.05, **p<0.01. ***p<0.001 vs. Control or NIH 3T3 (unpaired t-test or one-way ANOVA with Tukey’s test).
In vivo effects of non-bone metastatic tumors on osteocyte viability.
Since osteocytes are important regulators of bone homeostasis and osteocyte apoptosis can induce bone resorption 39, TUNEL staining was performed on femurs from control and tumor-bearing mice. Osteocytes were stratified as alive (TUNEL−), dying (TUNEL+ osteocyte with a round shape) or dead (TUNEL+ osteocytes with a crenated shape) in addition to the number of empty lacunae (Figure 4A). As shown in Figure 4B, the number of live osteocytes in the femoral midshaft from C26, ES-2 and LLC tumor-bearing mice was dramatically reduced (~70%) (Figure 4B), while the number of dying and dead osteocytes was significantly increased about +40% and +30% for dying and dead cells, respectively (Figure 4B). In all models, an increase of empty lacunae of about +250% was observed (Figure 4B). To identify the molecular mechanisms of the osteocyte cell death, markers of apoptosis were analyzed. The mRNA expression of the pro-apoptotic molecule Bax was increased, while the anti-apoptotic molecule Bcl-2 was decreased in primary osteocytes isolated from these tumor bearing mice. An increase in expression of pro-resorptive and pro-inflammatory factors was also observed. The mRNA for tnfsf11 coding for the pro-osteoclastogenic cytokine Receptor activator of nuclear factor kappa B ligand, Rankl, was increased whereas tnfrsf11b mRNA coding for anti-osteoclastogenic cytokine Osteoprotegrin, Opg, was decreased resulting in an increased Rankl/Opg ratio, which favors osteoclast differentiation (Figure S4). The expression of mRNA for Tnfa, a potent osteoclastogenic factor 40 was increased in the osteocytes derived from C26, ES-2 and LLC hosts (Figure S4).
Fig. 4: Effects of non-bone metastatic tumors on in vivo osteocyte viability.
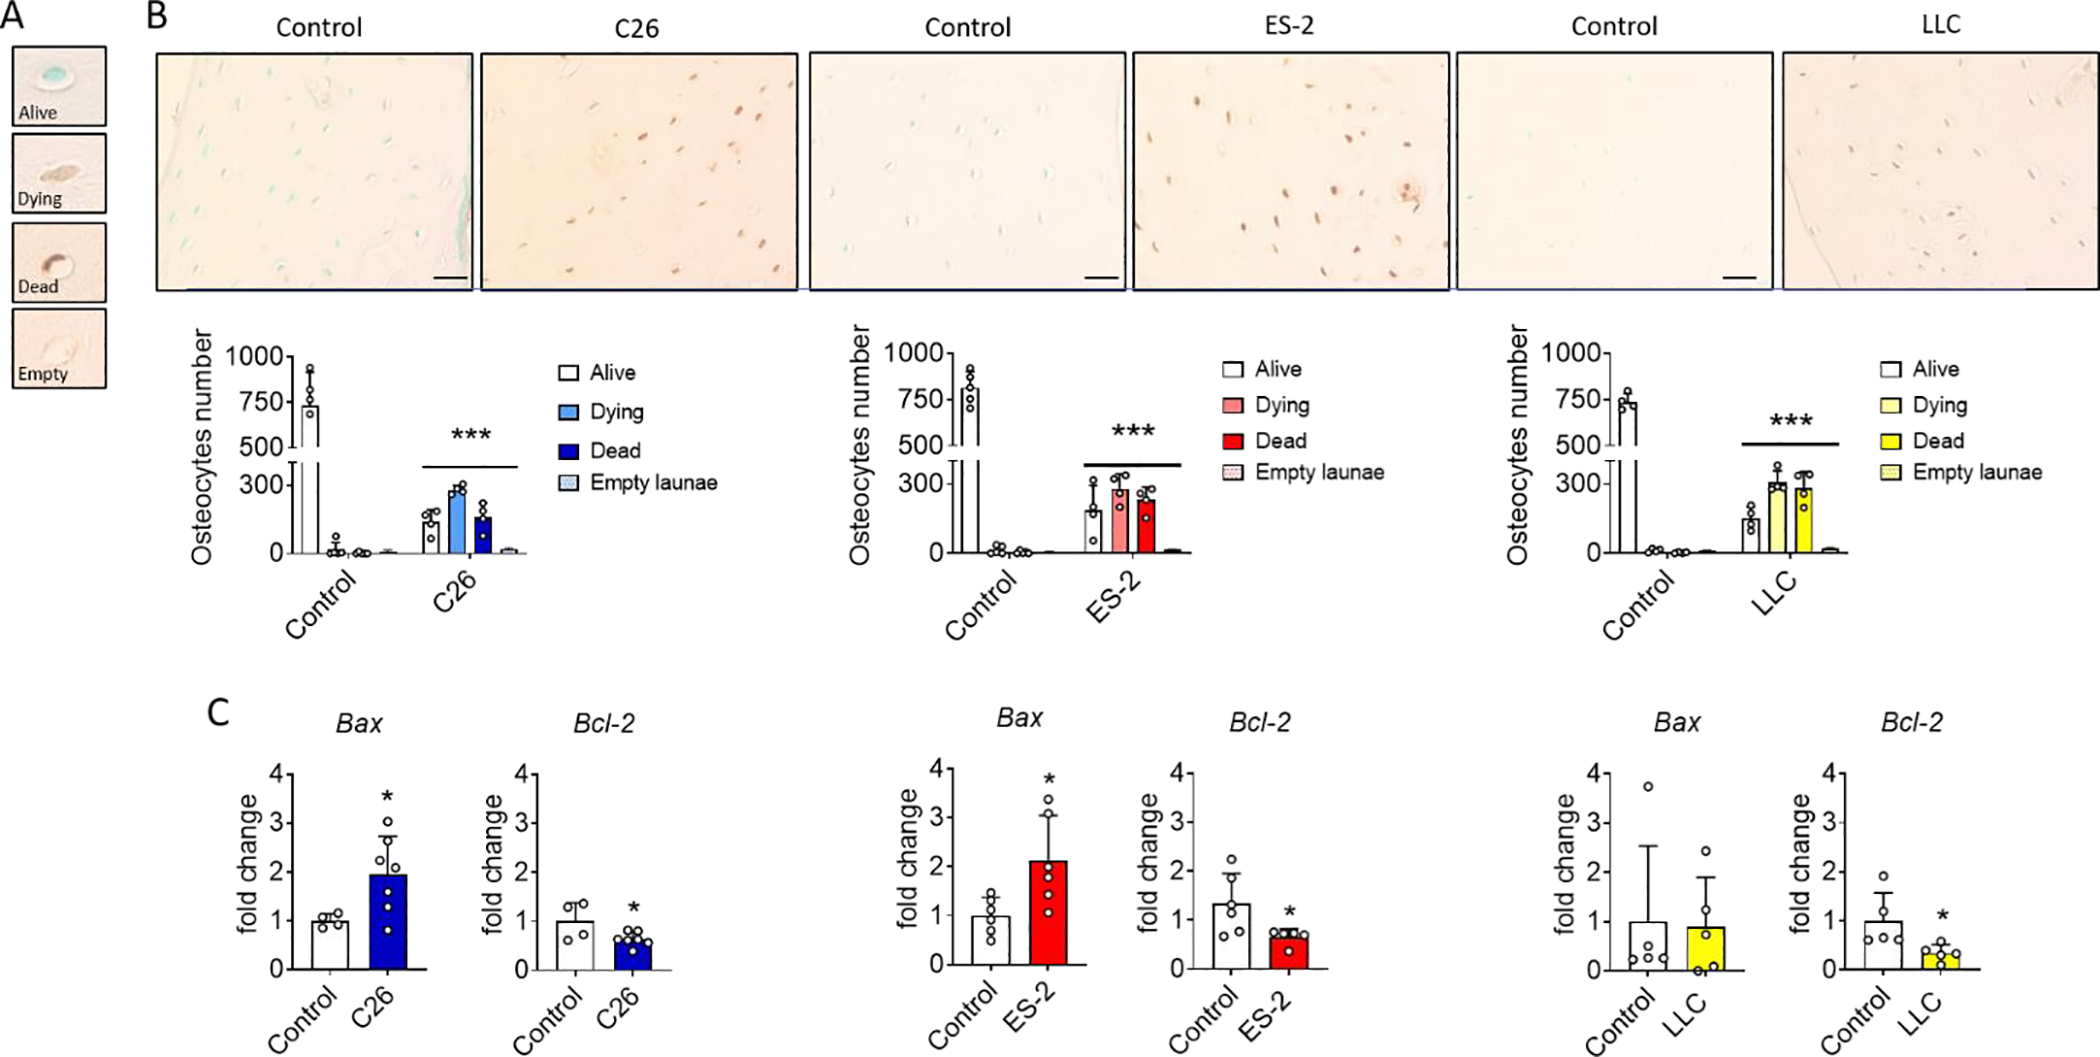
A: Osteocyte viability classification based on TUNEL staining: live (TUNEL−), dying (TUNEL+ osteocyte with a round shape) or dead (TUNEL+ osteocytes with a crenated shape) and empty lacunae. B: TUNEL-stained transverse sections and quantification in the femur midshaft of control and C26, ES-2 or LLC tumor-bearing mice (N =4). The scale bar represents 50μm. C: Gene expression levels for the indicated genes normalized to βActin in primary osteocyte enriched bone chips derived from flushed femora and tibiae of controls (N = 4, 6 and 5) and C26 (N =7), ES-2 (N = 6) and LLC (N = 5) tumor-bearing mice. Gene expression is expressed as fold change vs. Control. Data were expressed as means ± SD. Significant differences: ***p<0.001 vs. Control (one-way ANOVA with Tukey’s test).
In vitro effects of non-bone metastatic tumor-secreted factors on osteocyte viability and osteocyte markers.
In order to investigate the effects of cancer-derived factors on osteocytic cell death and potential function, IDG-SW3 cells at 21 days of differentiation, were co-cultured with C26, ES-2 and LLC cells plated on trans-wells for 24 or 72 hours. Dmp1-GFP expression was reduced in osteocytes co-cultured with tumor cells in comparison with control NIH 3T3 cells, as can be seen by fluorescence microscopy at both 24 and 72 hours (Figure 5A and B). To ensure that the reduction in fluorescence was not caused by increased acidification of the media, lactate was measured and found unchanged (Figure S5A). The reduction of the green fluorescence was also accompanied by a reduction in dendritic processes that characterize healthy osteocytes (Figure 5C). To confirm tumor cell induced cytotoxicity, lactate dehydrogenase (LDH) was measured in the CM of the osteocyte cells. As shown in Figure 3D, the release of LDH was increased as early as after 24 hours of co-culture. In addition, to validate our observation with another in vitro model, the CMs derived from C26, ES-2 and LLC cells were also added to the MLO-Y4 osteocyte-like cells and again, cell death was observed (Figure S5B). To identify the molecular mechanisms by which the tumor cells were causing osteocyte cell death, markers of apoptosis were analyzed. The mRNA expression of Bax was increased, while Bcl-2 was decreased in the IDG-SW3 cells co-cultured with tumor cells when compared to the NIH 3T3 cell line (Figure 5E–F). Moreover, cleaved caspase-3 was present in the osteocytes exposed to C26, ES-2 and LLC cells, and absent in the NIH 3T3 cell co-culture, clearly indicating induction of the apoptosis process (Figure 5G). Cell death induced by the tumor cells was also associated with changes in the expression of osteocytic markers. Dmp1 mRNA expression was reduced by the tumor cell lines, in concordance with the reduction of the Dmp1-GFP fluorescence for the C26 and LLC co-culture (Figure 5H and 5A–C). Sost mRNA was dramatically down-regulated when the IDG-SW3 cells were co-cultured with the tumor cells (Figure 5I). As observed in vivo, the tumor cell lines increased tnfsf11 mRNA and reduced tnfrsf11b mRNA expression leading to an increased tnfsf11/tnfrsf11b ratio (Figure 5J and S5C). Also, in accordance with the in vivo results, the mRNA expression of Tnfa was increased in the IDG-SW3 mature osteocytes when co-cultured with the tumor cells (Figure 5K).
Fig. 5: In vitro effects of non-bone metastatic tumor secreted factors on osteocyte viability and osteocyte markers.
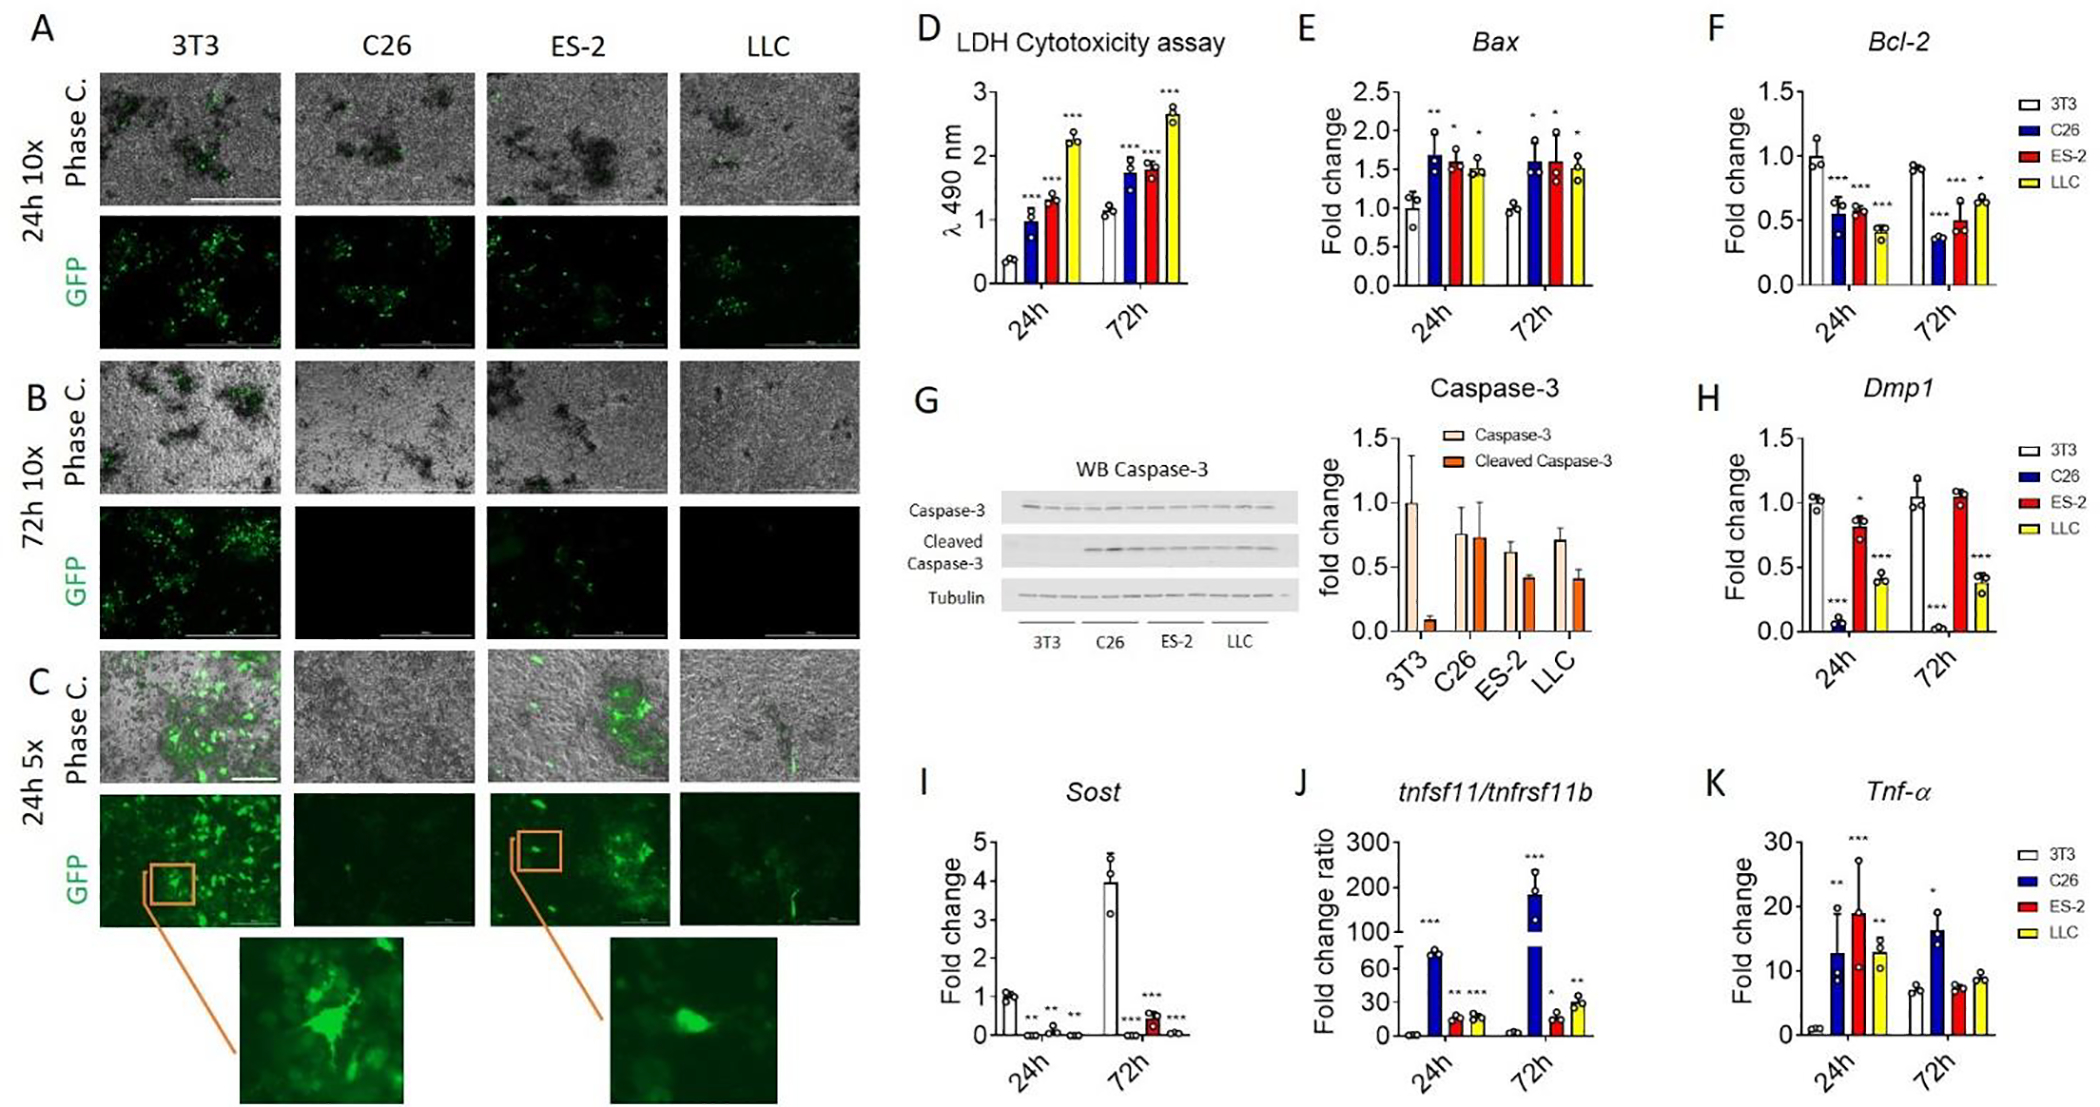
A and B: Phase contrast (top) and Dmp1-GFP (bottom) images of IDG-SW3 cells at 21 days of differentiation (mature osteocytes) co-cultured with NIH 3T3, C26, ES-2 and LLC cells for 24 and 72 hours. The scale bar represents 1000μm. C: Phase contrast (top) and Dmp1-GFP (bottom) images of IDG-SW3 cells at 21 days of differentiation co-cultured with 3T3, C26, ES-2 and LLC cells for 24 hours. The scale bar represents 1000μm. D: The lactate dehydrogenase (LDH) cytotoxicity assay performed using the CM from IDG-SW3 cells at 21 days of differentiation co-cultured with NIH 3T3, C26, ES-2 and LLC cells for 24 and 72 hours (N = 3). E and F: Expression of the indicated genes normalized to TATA-binding protein (Tbp1), in IDG-SW3 cells at 21 days of differentiation co-cultured with 3T3, C26, ES-2 and LLC cells for 24 and 72 hours (N = 3). Gene expression is expressed as fold change vs. 3T3 at 24 hours. G: Representative western blotting and quantification (expressed as fold change versus 3T3) for Caspase-3 and cleaved caspase-3 and tubulin in whole-protein extracts from IDG-SW3 cells at 21 days of differentiation co-cultured with NIH 3T3, C26, ES-2 and LLC cells for 48 hours (N = 3). H-K: Expression of the indicated genes normalized by TBP in IDG-SW3 cells at 21 days of differentiation co-cultured with NIH 3T3, C26, ES-2 and LLC cells for 24 and 72 hours (N = 3). Gene expression is expressed as fold change vs. 3T3 at 24 hours. Data were expressed as means ± SD. Significant differences: *p<0.05, **p<0.01, ***p<0.001 vs. 3T3 (one-way ANOVA with Tukey’s test).
Non-bone metastatic tumors induce osteocytic osteolysis markers in vitro and enlarged osteocyte lacunae in vivo.
Under some physiological and pathological conditions, osteocytes can acquire an osteoclast-like phenotype to remove their perilacunar matrix 41. To determine if tumor cells can induce osteocytic osteolysis, markers of osteoclast function were measured in IDG-SW3 cells differentiated 21 days and then co-cultured for 24 and 72 hours with C26, ES-2 and LLC cells plated on trans-wells. mRNA analysis showed an increase of Apc5, CtsK, Atp6v0d2 and Mmp13 expression coding for tartrate resistant acid phosphatase, cathepsin K, vacuolar Atpase subunit of the protein pump, and matrix metalloproteinase 13, in IDG-SW3 cells co-cultured with tumor cells (Figure S6). To determine if osteocytic osteolysis was occurring in vivo, TRAP expression was assessed in transverse sections of femoral mid-diaphysis. As indicated by the red arrows, TRAP+ osteocytes were observed in femurs derived from C26, ES-2 and LLC models compared to control, however, was only significant in C26 hosts (Figure 6A). TRAP+ osteoclasts were found in a greater extent on the endosteal surface (blue arrows) in femurs from the ES-2 and LLC tumor bearing mice. This data is consistent with the increased number of TRAP+ osteoclasts in trabecular bone in the ES-2 and LLC models (Figure 2A). To validate the histologic observations, primary osteocyte-enriched bones from C26, ES-2 and LLC tumor-bearing mice were used to quantitate expression of genes important for osteocytic osteolysis. The mRNA analysis showed an increased expression of the Acp5, CtsK, Atp6v0d2 and Mmp13 genes only in the C26 and ES-2 models (Figure 6B), strongly indicating osteocytic osteolysis. These increases were more pronounced in the C26 than in the ES-2 model, consistent with the increased number of TRAP+ osteocytes in the C26 model (Figure 6A). Backscatter SEM was performed to quantitate lacunar area. Significant increases in lacunar size were observed in femurs from C26, ES-2 and LLC tumor-bearing mice clearly showing osteocytic osteolysis (red arrows, Figure 6C). An increase in lacunar area was observed not only in the top 20% of the largest lacunae but also when 100% of the lacunae were quantified in both C26 and ES-2 bones (Figure 6D).
Fig. 6: Non-bone metastatic tumors are associated with osteocytic osteolysis in vitro and in vivo.
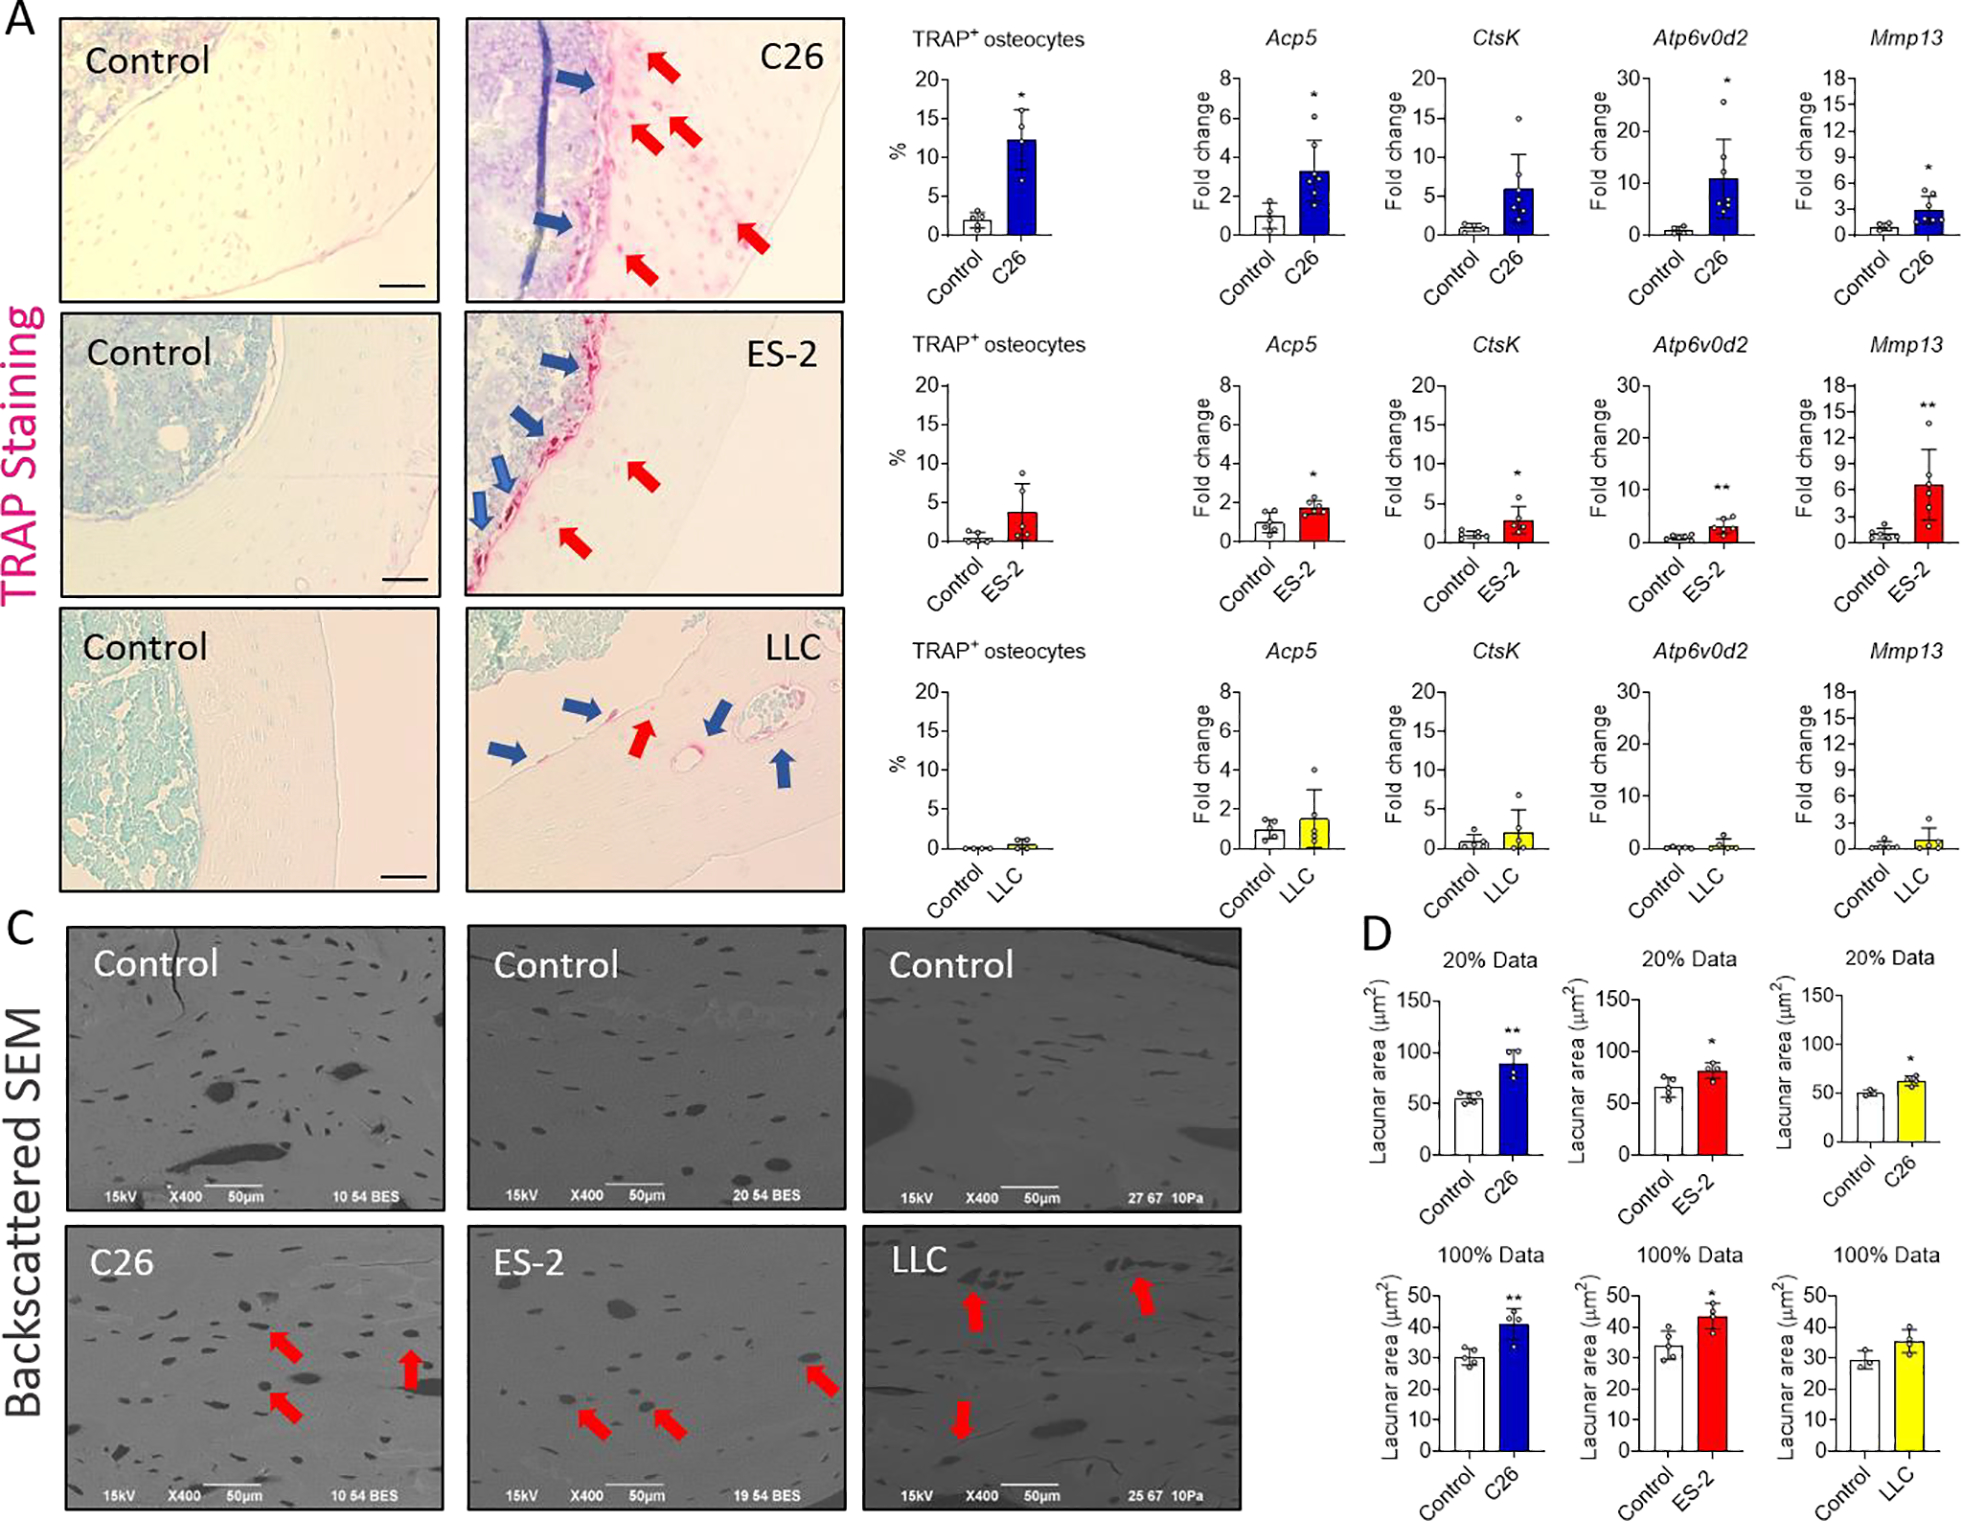
A: TRAP stained transverse sections and quantification of TRAP+ osteocytes (expressed as a % of the total number of osteocytes per section) from the femoral mid-diaphysis of control (N = 5, 5 and 4) and C26 (N = 4), ES-2 (N = 5) and LLC (N = 4) tumor-bearing mice. The red arrows indicate the TRAP+ osteocytes and the blue arrows the osteoclasts. The scale bar represents 50μm. B: Expression of the indicated genes normalized to βActin in osteocyte enriched bone chips derived from flushed femora and tibiae of control (N = 4, 6 and 5) and C26 (N = 7), ES-2 (N = 6) and LLC (N = 5) tumor-bearing mice. C: Backscatter SEM (BSEM) images of longitudinal sections from the mid-diaphysis of control (N = 5, 5 and 3) and C26 (N = 4), ES-2 (N = 4) and LLC (N = 4) tumor-bearing mice. D: Quantification of the lacunar area in longitudinal sections from the mid-diaphysis of control and C26, ES-2 and LLC tumor-bearing mice. Graphs show the largest 20% lacunae and all lacunae (100%) measured, expressed in μm2. Data were expressed as means ± SD. Significant differences: *p<0.05, **p<0.01, ***p<0.001 vs. Control (unpaired t-test).
Discussion
In the present study, we sought to determine the effects of three experimental cancer cachexia xenograft models, C26, ES-2 and LLC tumors on bone in mice, especially on osteocyte viability and function. These preclinical models are extensively used to study important features such as cancer cachexia with progressive body wasting, loss of muscle mass and weakness. However, the effects of these non-bone metastatic cancers on bone cells were previously unknown.
In line with data from previous work 23, 24, 28, here we show that ES-2 and LLC tumor growth leads to severe trabecular bone loss in contrast to the C26 tumor-bearing mice showing little change in bone mass and microarchitecture. The C26 model also displayed the presence of dystrophic mineralization surrounding the trabeculae. Interestingly, we only observed decreased cortical bone mass in the LLC model, which could be due to the kinetics of tumor growth as the LLC model is slower growing and requires 4 weeks for optimal tumor growth and cachexia compared to the 2 weeks required by C26 and ES-2 models 23, 31, 42. The distinct differences of their effects on bone may be due to specific factors produced by the cancer cells and/or the host response to the tumor.
Bone homeostasis is maintained by a balance between osteoclastic bone resorption and osteoblastic bone formation 43. This balance is maintained physiologically in response to loading and unloading of the skeleton 44. However, under certain pathological conditions, increased osteoclast activity and number 45 and/or impaired osteoblastic function 46 can occur. In this regard, in the ES-2 and LLC models, bone loss was due in part to increased bone resorption as suggested by the greater number of osteoclasts found in trabecular bone. However, a decrease in the number of osteoblasts suggests the involvement of both bone cell types in the observed phenotype. In contrast, the mild bone loss observed in the C26 hosts was associated with a decrease in osteoblast number and osteoid while the osteoclast number was not increased, suggesting reduced bone formation. Regarding the LLC model, our data are partially in contrast with a previous study showing that the bone loss in this model was due to a reduction in bone formation without an increase in osteoclast activation 24. This difference might be due to the different sites of tumor injection and/or the longer time between the tumor injection and sacrifice as for the LLC model 24. Some of the effects on osteoclasts and osteoblasts may be due to direct effects of the tumor secreted factors, as we found increased in vitro osteoclastogenesis when bone marrow cells were exposed to C26, ES-2 and LLC conditioned media. Also, co-culture of the tumor cells with IDG-SW3 cells at 5 days of differentiation or mineralizing IDG-SW3 cells resulted in downregulation of osteoblast markers and reduced mineral deposition, suggesting direct effects of tumor factors on osteoblasts/osteocytes.
While the interactions between tumors with osteoclasts and osteoblasts are well studied, less is known about the interactions of non-bone metastatic tumors with osteocytes. Osteocytes are the most abundant cells in adult bone, where they are interconnected through dendrites generating an extensive network to extend to the bone surface and the vasculature in order to maintain bone homeostasis 47. Osteocytes regulate bone remodeling through directly or indirectly modifying osteoclast and osteoblast functions 48. Osteocytes can regulate bone homeostasis through programmed cell death to target osteoclasts through Rankl 49. Osteocytes can also undergo autophagy and necrosis also leading to osteoclastic bone loss 50. Pathological osteocyte cell death can occur with glucocorticoid excess, during aging, after menopause and also with other conditions such as osteoarthritis and multiple myeloma 51–53. We found a dramatic increase in osteocyte apoptosis and numbers of empty lacunae in the C26, ES-2 and LLC tumor-bearing mice. Once an osteocyte dies within its lacunae it cannot be refilled with another osteocyte. Bone must be remodeled where the old bone is removed and replaced with new bone containing osteocytes. However, frequently, especially with aging, the empty lacunae become mineralized, a process called micropetrosis 54. Extensive osteocyte cell death without remodeling is called osteonecrosis, which can cause bone pain, limiting movement. If the osteonecrosis progresses, the bone can actually collapse causing increasing pain and fracture risk 54, 55. Here we show that these tumors induce osteocyte cell death in vivo and experiments performed in vitro suggested a direct effect of tumor factors on osteocyte cell death and function. In particular, the increase in Bax mRNA expression and cleaved Caspase-3 as well as the reduced Bcl-2 expression clearly indicate the activation of apoptotic osteocyte cell death.
The tumors not only induced osteocyte cell death but also drove specific changes in osteocyte markers such as the early osteocyte marker Dmp1 and the late osteocyte marker Sost suggesting a cytotoxic effect of the tumor secreted factors. In addition to cytotoxicity, the increased tnfsf11/tnfrsf11b ratio as well as highly elevated Tnfa expression found in the osteocytes in vivo as well as in vitro suggest that tumor derived factors have direct effects on osteocytes. An increased Rankl/Opg ratio and elevated Tnfα are well known to stimulate osteoclastogenesis and induce bone loss 56. Furthermore, increased Rankl and Tnfα can also inhibit osteoblast differentiation and induce osteoblast apoptosis 40, 57. In these cachexia models, osteocytes are directly stimulated by tumor-derived factors to increase the production of Rankl and Tnfα. These factors could be important contributors to the altered osteoclast and osteoblast number supporting increased osteoclastic bone resorption and reduced osteoblastic bone formation. In a recent publication, it was shown that production of Mincle from dying osteocytes directly stimulates a RANKL independent increase of osteoclast differentiation39. Future studies sacrificing the animals at different time points would provide more information on this process, on the dynamics and timing of dying osteocytes, the factors involved, the expression of osteoclast and osteoblast regulatory molecules, and removal of their perilacunar matrix.
Here we show for the first time the occurrence of osteocytic osteolysis in bone from non-bone metastatic cancer models. Osteocytic osteolysis is the process whereby osteocytes remove their perilacunar matrix. It is an important mechanism for the release of calcium into the circulation during lactation and is the first stage of perilacunar remodeling when the removed matrix is replaced post lactation 37. Lactation is a non-pathological condition which is different from pathological conditions such as immobilization, glucocorticoid-induced osteoporosis, osteolytic metastases and calcium deficiency where the perilacunar matrix is rarely replaced 58. The expression of ‘osteoclast specific genes’ by osteocytes has been shown to be responsible for lacunar acidification and for the removal of the perilacunar matrix 48. In the in vivo tumor models studied here, TRAP, cathepsin K, the v-Atpase subunit Atp6v0d2 and the metalloprotease Mmp13 were increased in osteocytes from C26 and ES-2 models. These markers of osteocytic osteolysis along with an increase in lacunar area were more pronounced in the C26 model compared to the ES-2 tumor-bearing mice. In addition, the highest number of TRAP positive osteocytes were found in the bone of the C26 mice compared to the ES-2 mice. Conversely, the LLC model did not show increased TRAP+ osteocytes and increased expression of osteoclast specific genes. However, increased lacunar area was found also in this model. This discrepancy may be explained by timing where the animals are sacrificed at a time point past active osteocytic osteolysis. This increase in osteocyte lacunar size could change the properties of the bone, increasing fragility and brittleness therefore making it more susceptible to fracture and leading to severe skeletal damage.
As shown in vitro, tumor derived factors directly increased the expression of genes coding for factors used by osteocytes to regulate osteoclasts and osteoblasts such as Tnfsf11 for Rankl and Tnfrsf11b for Opg. The osteocytic osteolysis observed in the C26 and LLC models could be driven by PTH/PTHrP 29, 59, as these tumors have been shown to make this hormone and PTHrP is responsible for the removal of the osteocyte perilacunar matrix with lactation 37. More studies are required to identify the factors made by these tumors that target osteocytes.
Overall, our study clearly demonstrates that non-bone metastatic tumors can have detrimental effects on not just osteoclasts and osteoblasts, but also osteocytes in bone, even in the absence of any obvious radiographic bone metastasis (See Supplemental data Figure 2). Furthermore, we show for the first time that non-bone metastatic tumors can affect bone tissue by inducing osteocytic osteolysis and osteocyte cell death, with the potential to negatively affect mechanical properties, bone strength and capacity to remodel. Of concern, osteocytic bone destruction and extensive osteocyte cell death (osteonecrosis) along with muscle wasting caused by non-bone metastatic tumors may generate a musculoskeletal system that is incapable of full recovery upon eradication of tumor. Like treatments for metastatic bone cancer being tested to maintain bone mass (such as the bisphosphonates, anti-RANKL, anti-TGFβ, anti-sclerostin, and others), the same treatment considerations should be made for non-bone metastatic cancer in order to maintain musculoskeletal health. Further studies are needed to determine the capacity of the bone to recover once the cancer is removed or in remission.
Supplementary Material
Acknowledgements
The authors would like to thank the ICMH Electron Microscopy Core especially, the Assistant Director, Caroline Miller and the ICMH Histology and Histomorphometry Core especially, the manager Drew Brown. The #12G10 anti-Tubulin monoclonal antibody (developed by J. Frankel and E. M. Nelsen at the University of Iowa) was obtained from the Developmental Studies Hybridoma Bank, created by the Eunice Kennedy Shriver National Institute of Child Health and Human Development of the National Institutes of Health and maintained at The University of Iowa, Department of Biology.
Funding
This work was supported by the Indiana Center for Musculoskeletal Health, by the Department of Surgery and the Department of Otolaryngology—Head & Neck Surgery at Indiana University School of Medicine, and by grants from National Institute of Health (NIH NIA PO1 AGO39355 to L.F.B.), V Foundation for Cancer Research (V2017-021 to A.B.), and American Cancer Society (Research Scholar Grant 132013-RSG-18-010-01-CCG to A.B.).
Footnotes
Declaration of interests
The authors declare that they have no known competing financial interests or personal relationships that could have appeared to influence the work reported in this paper.
Publisher's Disclaimer: This is a PDF file of an unedited manuscript that has been accepted for publication. As a service to our customers we are providing this early version of the manuscript. The manuscript will undergo copyediting, typesetting, and review of the resulting proof before it is published in its final form. Please note that during the production process errors may be discovered which could affect the content, and all legal disclaimers that apply to the journal pertain.
References
- 1.Siegel RL, Miller KD, Fuchs HE, Jemal A. Cancer Statistics, 2021. CA Cancer J Clin 2021;71:7–33 [DOI] [PubMed] [Google Scholar]
- 2.Mundy GR. Metastasis to bone: causes, consequences and therapeutic opportunities. Nat Rev Cancer 2002;2:584–93 [DOI] [PubMed] [Google Scholar]
- 3.Peterson SJ, Mozer M. Differentiating Sarcopenia and Cachexia Among Patients With Cancer. Nutr Clin Pract 2017;32:30–39 [DOI] [PubMed] [Google Scholar]
- 4.Sun L, Quan XQ, Yu S. An Epidemiological Survey of Cachexia in Advanced Cancer Patients and Analysis on Its Diagnostic and Treatment Status. Nutr Cancer 2015;67:1056–62 [DOI] [PubMed] [Google Scholar]
- 5.von Haehling S, Anker SD. Prevalence, incidence and clinical impact of cachexia: facts and numbers-update 2014. J Cachexia Sarcopenia Muscle 2014;5:261–3 [DOI] [PMC free article] [PubMed] [Google Scholar]
- 6.Luctkar-Flude M, Groll D, Woodend K, Tranmer J. Fatigue and physical activity in older patients with cancer: a six-month follow-up study. Oncol Nurs Forum 2009;36:194–202 [DOI] [PubMed] [Google Scholar]
- 7.Meeske K, Smith AW, Alfano CM, McGregor BA, McTiernan A, Baumgartner KB, Malone KE, Reeve BB, Ballard-Barbash R, Bernstein L. Fatigue in breast cancer survivors two to five years post diagnosis: a HEAL Study report. Qual Life Res 2007;16:947–60 [DOI] [PubMed] [Google Scholar]
- 8.Mustian KM, Peppone LJ, Palesh OG, Janelsins MC, Mohile SG, Purnell JQ, Darling TV. Exercise and Cancer-related Fatigue. US Oncol 2009;5:20–23 [PMC free article] [PubMed] [Google Scholar]
- 9.Kanis JA, McCloskey EV, Powles T, Paterson AH, Ashley S, Spector T. A high incidence of vertebral fracture in women with breast cancer. Br J Cancer 1999;79:1179–81 [DOI] [PMC free article] [PubMed] [Google Scholar]
- 10.Wong E, Chow E, Zhang L, Bedard G, Lam K, Fairchild A, Vassiliou V, Alm El-Din MA, Jesus-Garcia R, Kumar A, Forges F, Tseng LM, Hou MF, Chie WC, Bottomley A. Factors influencing health related quality of life in cancer patients with bone metastases. J Palliat Med 2013;16:915–21 [DOI] [PubMed] [Google Scholar]
- 11.Waning DL, Mohammad KS, Reiken S, Xie W, Andersson DC, John S, Chiechi A, Wright LE, Umanskaya A, Niewolna M, Trivedi T, Charkhzarrin S, Khatiwada P, Wronska A, Haynes A, Benassi MS, Witzmann FA, Zhen G, Wang X, Cao X, Roodman GD, Marks AR, Guise TA. Excess TGF-beta mediates muscle weakness associated with bone metastases in mice. Nat Med 2015;21:1262–71 [DOI] [PMC free article] [PubMed] [Google Scholar]
- 12.Hesse E, Schroder S, Brandt D, Pamperin J, Saito H, Taipaleenmaki H. Sclerostin inhibition alleviates breast cancer-induced bone metastases and muscle weakness. JCI Insight 2019;5 [DOI] [PMC free article] [PubMed] [Google Scholar]
- 13.Essex AL, Pin F, Huot JR, Bonewald LF, Plotkin LI, Bonetto A. Bisphosphonate Treatment Ameliorates Chemotherapy-Induced Bone and Muscle Abnormalities in Young Mice. Front Endocrinol (Lausanne) 2019;10:809. [DOI] [PMC free article] [PubMed] [Google Scholar]
- 14.Hain BA, Jude B, Xu H, Smuin DM, Fox EJ, Elfar JC, Waning DL. Zoledronic Acid Improves Muscle Function in Healthy Mice Treated with Chemotherapy. J Bone Miner Res 2020;35:368–81 [DOI] [PubMed] [Google Scholar]
- 15.Drake MT. Osteoporosis and cancer. Curr Osteoporos Rep 2013;11:163–70 [DOI] [PMC free article] [PubMed] [Google Scholar]
- 16.Wang M, Xia F, Wei Y, Wei X. Molecular mechanisms and clinical management of cancer bone metastasis. Bone Res 2020;8:30. [DOI] [PMC free article] [PubMed] [Google Scholar]
- 17.Guise TA. The vicious cycle of bone metastases. J Musculoskelet Neuronal Interact 2002;2:570–2 [PubMed] [Google Scholar]
- 18.Weilbaecher KN, Guise TA, McCauley LK. Cancer to bone: a fatal attraction. Nat Rev Cancer 20n;11:411–25 [DOI] [PMC free article] [PubMed] [Google Scholar]
- 19.Coleman RE, Lipton A, Roodman GD, Guise TA, Boyce BF, Brufsky AM, Clezardin P, Croucher PI, Gralow JR, Hadji P, Holen I, Mundy GR, Smith MR, Suva LJ. Metastasis and bone loss: advancing treatment and prevention. Cancer Treat Rev 2010;36:615–20 [DOI] [PMC free article] [PubMed] [Google Scholar]
- 20.Dumanskiy YV, Syniachenko OV, Stepko PA, Taktashov GS, Chernyshova OY, Stoliarova OY. The state of bone metabolism in lung cancer patients. Exp Oncol 2018;40:136–39 [PubMed] [Google Scholar]
- 21.Hung YC, Yeh LS, Chang WC, Lin CC, Kao CH. Prospective study of decreased bone mineral density in patients with cervical cancer without bone metastases: a preliminary report. Jpn JClin Oncol 2002;32:422–4 [DOI] [PubMed] [Google Scholar]
- 22.Bonetto A, Kays JK, Parker VA, Matthews RR, Barreto R, Puppa MJ, Kang KS, Carson JA, Guise TA, Mohammad KS, Robling AG, Couch ME, Koniaris LG, Zimmers TA. Differential Bone Loss in Mouse Models of Colon Cancer Cachexia. Front Physiol 2016;7:679. [DOI] [PMC free article] [PubMed] [Google Scholar]
- 23.Pin F, Barreto R, Kitase Y, Mitra S, Erne CE, Novinger LJ, Zimmers TA, Couch ME, Bonewald LF, Bonetto A. Growth of ovarian cancer xenografts causes loss of muscle and bone mass: a new model for the study of cancer cachexia. J Cachexia Sarcopenia Muscle 2018;9:685–700 [DOI] [PMC free article] [PubMed] [Google Scholar]
- 24.Berent TE, Dorschner JM, Craig TA, Drake MT, Westendorf JJ, Kumar R. Lung tumor cells inhibit bone mineralization and osteoblast activity. Biochem Biophys Res Commun 2019;519:566–71 [DOI] [PMC free article] [PubMed] [Google Scholar]
- 25.Huot JR, Pin F, Narasimhan A, Novinger LJ, Keith AS, Zimmers TA, Willis MS, Bonetto A. ACVR2B antagonism as a countermeasure to multi-organ perturbations in metastatic colorectal cancer cachexia. J Cachexia Sarcopenia Muscle 2020;11:1779–98 [DOI] [PMC free article] [PubMed] [Google Scholar]
- 26.Choi E, Carruthers K, Zhang L, Thomas N, Battaglino RA, Morse LR, Widrick JJ. Concurrent muscle and bone deterioration in a murine model of cancer cachexia. Physiol Rep 2013;1:e00144. [DOI] [PMC free article] [PubMed] [Google Scholar]
- 27.Huot JR, Pin F, Essex AL, Bonetto A. MC38 Tumors Induce Musculoskeletal Defects in Colorectal Cancer. Int J Mol Sci 2021;22 [DOI] [PMC free article] [PubMed] [Google Scholar]
- 28.Capparelli C, Kostenuik PJ, Morony S, Starnes C, Weimann B, Van G, Scully S, Qi M, Lacey DL, Dunstan CR. Osteoprotegerin prevents and reverses hypercalcemia in a murine model of humoral hypercalcemia of malignancy. Cancer Res 2000;60:783–7 [PubMed] [Google Scholar]
- 29.Plas RLC, Poland M, Faber J, Argiles J, van Dijk M, Laviano A, Meijerink J, Witkamp RF, van Helvoort A, van Norren K. A Diet Rich in Fish Oil and Leucine Ameliorates Hypercalcemia in Tumour-Induced Cachectic Mice. Int J Mol Sci 2019;20 [DOI] [PMC free article] [PubMed] [Google Scholar]
- 30.Woo SM, Rosser J, Dusevich V, Kalajzic I, Bonewald LF. Cell line IDG-SW3 replicates osteoblast-to-late-osteocyte differentiation in vitro and accelerates bone formation in vivo. J Bone Miner Res 2011;26:2634–46 [DOI] [PMC free article] [PubMed] [Google Scholar]
- 31.Bonetto A, Rupert JE, Barreto R, Zimmers TA. The Colon-26 Carcinoma Tumor-bearing Mouse as a Model for the Study of Cancer Cachexia. J Vis Exp 2016; [DOI] [PMC free article] [PubMed] [Google Scholar]
- 32.Bouxsein ML, Boyd SK, Christiansen BA, Guldberg RE, Jepsen KJ, Muller R. Guidelines for assessment of bone microstructure in rodents using micro-computed tomography. J Bone Miner Res 2010;25:1468–86 [DOI] [PubMed] [Google Scholar]
- 33.Hahn M, Vogel M, Pompesius-Kempa M, Delling G. Trabecular bone pattern factor--a new parameter for simple quantification of bone microarchitecture. Bone 1992;13:327–30 [DOI] [PubMed] [Google Scholar]
- 34.Dempster DW, Compston JE, Drezner MK, Glorieux FH, Kanis JA, Malluche H, Meunier PJ, Ott SM, Recker RR, Parfitt AM. Standardized nomenclature, symbols, and units for bone histomorphometry: a 2012 update of the report of the ASBMR Histomorphometry Nomenclature Committee. JBone Miner Res 2013;28:2–17 [DOI] [PMC free article] [PubMed] [Google Scholar]
- 35.Davis HM, Pacheco-Costa R, Atkinson EG, Brun LR, Gortazar AR, Harris J, Hiasa M, Bolarinwa SA, Yoneda T, Ivan M, Bruzzaniti A, Bellido T, Plotkin LI. Disruption of the Cx43/miR21 pathway leads to osteocyte apoptosis and increased osteoclastogenesis with aging. Aging Cell 2017;16:551–63 [DOI] [PMC free article] [PubMed] [Google Scholar]
- 36.Pacheco-Costa R, Hassan I, Reginato RD, Davis HM, Bruzzaniti A, Allen MR, Plotkin LI. High Bone Mass in Mice Lacking Cx37 Due to Defective Osteoclast Differentiation. J Biol Chem 2014;289:8508–20 [DOI] [PMC free article] [PubMed] [Google Scholar]
- 37.Qing H, Ardeshirpour L, Pajevic PD, Dusevich V, Jahn K, Kato S, Wysolmerski J, Bonewald LF. Demonstration of osteocytic perilacunar/canalicular remodeling in mice during lactation. J Bone Miner Res 2012;27:1018–29 [DOI] [PMC free article] [PubMed] [Google Scholar]
- 38.Penna F, Busquets S, Pin F, Toledo M, Baccino FM, Lopez-Soriano FJ, Costelli P, Argiles JM. Combined approach to counteract experimental cancer cachexia: eicosapentaenoic acid and training exercise. J Cachexia Sarcopenia Muscle 2011;2:95–104 [DOI] [PMC free article] [PubMed] [Google Scholar]
- 39.Andreev D, Liu M, Weidner D, Kachler K, Faas M, Gruneboom A, Schlotzer-Schrehardt U, Munoz LE, Steffen U, Grotsch B, Killy B, Kronke G, Luebke AM, Niemeier A, Wehrhan F, Lang R, Schett G, Bozec A. Osteocyte necrosis triggers osteoclast-mediated bone loss through macrophage-inducible C-type lectin. J Clin Invest 2020;130:4811–30 [DOI] [PMC free article] [PubMed] [Google Scholar]
- 40.Metzger CE, Narayanan SA. The Role of Osteocytes in Inflammatory Bone Loss. Front Endocrinol (Lausanne) 2019;10:285. [DOI] [PMC free article] [PubMed] [Google Scholar]
- 41.Jahn K, Kelkar S, Zhao H, Xie Y, Tiede-Lewis LM, Dusevich V, Dallas SL, Bonewald LF. Osteocytes Acidify Their Microenvironment in Response to PTHrP In Vitro and in Lactating Mice In Vivo. J Bone Miner Res 2017;32:1761–72 [DOI] [PMC free article] [PubMed] [Google Scholar]
- 42.Pin F, Busquets S, Toledo M, Camperi A, Lopez-Soriano FJ, Costelli P, Argiles JM, Penna F. Combination of exercise training and erythropoietin prevents cancer-induced muscle alterations. Oncotarget 2015;6:43202–15 [DOI] [PMC free article] [PubMed] [Google Scholar]
- 43.Rodan GA. Bone homeostasis. Proc Natl Acad Sci U S A 1998;95:13361–2 [DOI] [PMC free article] [PubMed] [Google Scholar]
- 44.Shupp AB, Kolb AD, Mukhopadhyay D, Bussard KM. Cancer Metastases to Bone: Concepts, Mechanisms, and Interactions with Bone Osteoblasts. Cancers 2018; 10 [DOI] [PMC free article] [PubMed] [Google Scholar]
- 45.Henriksen K, Bollerslev J, Everts V, Karsdal MA. Osteoclast activity and subtypes as a function of physiology and pathology-implications for future treatments of osteoporosis. Endocr Rev 2011;32:31–63 [DOI] [PubMed] [Google Scholar]
- 46.Marie PJ, Kassem M. Osteoblasts in osteoporosis: past, emerging, and future anabolic targets. Eur J Endocrinol 2011;165:1–10 [DOI] [PubMed] [Google Scholar]
- 47.Guo D, Bonewald LF. Advancing our understanding of osteocyte cell biology. Ther Adv Musculoskelet Dis 2009; 1:87–96 [DOI] [PMC free article] [PubMed] [Google Scholar]
- 48.Robling AG, Bonewald LF. The Osteocyte: New Insights. Annu Rev Physiol 2020;82:485–506 [DOI] [PMC free article] [PubMed] [Google Scholar]
- 49.Cabahug-Zuckerman P, Frikha-Benayed D, Majeska RJ, Tuthill A, Yakar S, Judex S, Schaffler MB. Osteocyte Apoptosis Caused by Hindlimb Unloading is Required to Trigger Osteocyte RANKL Production and Subsequent Resorption of Cortical and Trabecular Bone in Mice Femurs. J Bone Miner Res 2016;31:1356–65 [DOI] [PMC free article] [PubMed] [Google Scholar]
- 50.Ru JY, Wang YF. Osteocyte apoptosis: the roles and key molecular mechanisms in resorption-related bone diseases. Cell Death Dis 2020;11:846. [DOI] [PMC free article] [PubMed] [Google Scholar]
- 51.Komori T Cell Death in Chondrocytes, Osteoblasts, and Osteocytes. Int J Mol Sci 2016; 17 [DOI] [PMC free article] [PubMed] [Google Scholar]
- 52.Bonewald LF. The amazing osteocyte. JBone Miner Res 2011;26:229–38 [DOI] [PMC free article] [PubMed] [Google Scholar]
- 53.Giuliani N, Ferretti M, Bolzoni M, Storti P, Lazzaretti M, Dalla Palma B, Bonomini S, Martella E, Agnelli L, Neri A, Ceccarelli F, Palumbo C. Increased osteocyte death in multiple myeloma patients: role in myeloma-induced osteoclast formation. Leukemia 2012;26:1391–401 [DOI] [PubMed] [Google Scholar]
- 54.Jilka RL, Noble B, Weinstein RS. Osteocyte apoptosis. Bone 2013;54:264–71 [DOI] [PMC free article] [PubMed] [Google Scholar]
- 55.Moya-Angeler J, Gianakos AL, Villa JC, Ni A, Lane JM. Current concepts on osteonecrosis of the femoral head. World J Orthop 2015;6:590–601 [DOI] [PMC free article] [PubMed] [Google Scholar]
- 56.Luo G, Li F, Li X, Wang ZG, Zhang B. TNFalpha and RANKL promote osteoclastogenesis by upregulating RANK via the NFkappaB pathway. Mol Med Rep 2018;17:6605–11 [DOI] [PMC free article] [PubMed] [Google Scholar]
- 57.Pavalko FM, Gerard RL, Ponik SM, Gallagher PJ, Jin Y, Norvell SM. Fluid shear stress inhibits TNF-alpha-induced apoptosis in osteoblasts: a role for fluid shear stress-induced activation of PI3-kinase and inhibition of caspase-3. J Cell Physiol 2003;194:194–205 [DOI] [PubMed] [Google Scholar]
- 58.Tsourdi E, Jahn K, Rauner M, Busse B, Bonewald LF. Physiological and pathological osteocytic osteolysis. JMusculoskelet Neuronal Interact 2018;18:292–303 [PMC free article] [PubMed] [Google Scholar]
- 59.Kir S, Komaba H, Garcia AP, Economopoulos KP, Liu W, Lanske B, Hodin RA, Spiegelman BM. PTH/PTHrP Receptor Mediates Cachexia in Models of Kidney Failure and Cancer. CellMetab 2016;23:315–23 [DOI] [PMC free article] [PubMed] [Google Scholar]
Associated Data
This section collects any data citations, data availability statements, or supplementary materials included in this article.