Abstract
Alzheimer’s disease (AD) is a progressive neurodegenerative disorder that accounts for approximately 60 to 80% of dementia cases worldwide and is characterized by an accumulation of extracellular senile plaques composed of β-amyloid (Aβ) peptide and intracellular neurofibrillary tangles (NFTs) containing hyperphosphorylated tau protein. Sporadic or late-onset AD (LOAD) represents 95% of the AD cases and its etiology does not appear to follow Mendelian laws of inheritance, thus, implicating the role of epigenetic programming and environmental factors. Apolipoprotein allele 4 (ApoE4), the only established genetic risk factor for LOAD, is suggested to accelerate the pathogenesis of AD by increasing tau hyperphosphorylation, inhibiting the clearance of amyloid-β (Aβ), and promoting Aβ aggregation. Perfluorooctanesulfonic acid (PFOS) is a persistent organic pollutant with potential neurotoxic effects that poses a major threat to the ecosystem and human health. By employing in vivo and in vitro models, the present study investigated PFOS as a potential risk factor for LOAD by assessing its impact on amyloidogenesis, tau pathology, and rodent behavior. Our behavioral analysis revealed that developmentally exposed male and female mice exhibited a strong trend of increased rearing and significantly increased distance traveled in the open field test. Biochemically, GSK3β and total ApoE were increased following developmental exposure, in vivo. Furthermore, in vitro, low concentrations of PFOS elevated protein levels of APP, tau, and its site-specific phosphorylation. Differentiated SH-SY5Y cells exposed to a series of PFOS concentrations, also, had elevated protein expression of GSK3β. These data suggest that total ApoE is inducible by environmental exposure to PFOS.
Keywords: PFOS, ApoE, Alzheimer’s disease, Amyloidogenic pathway, Tau pathology, Glycogen synthase kinase-3 beta (GSK3β)
1. Introduction
Alzheimer’s disease (AD) is a progressive neurodegenerative disorder that accounts for approximately 60 to 80% of dementia cases worldwide (Deture and Dickson, 2019). Several biochemical pathways have been associated with AD including neuroinflammation, microglial activation, and oxidative stress (Manoharan et al., 2016). The major AD hallmarks are the presence of extracellular senile plaques consisting of β-amyloid (Aβ) peptides that are cleaved from a larger protein called the amyloid precursor protein (APP) and intracellular neurofibrillary tangles (NFTs) containing hyperphosphorylated tau protein oligomers (Murphy and Levine, 2010). Tau is an intracellular microtubule-binding protein that is essential for the stabilization of microtubules and axonal transport in neurons (Garcia and Cleveland, 2001). Hyperphosphorylation of tau, which occurs in pathological conditions, reduces tau affinity to microtubules resulting in impaired axonal transport. Several protein kinases are involved in the phosphorylation of tau protein such as the proline-directed protein kinases: cyclin-dependent kinase-5 (CDK5) and glycogen synthase kinase-3 beta (GSK3β) (Martin et al., 2013). These kinases are responsible for the unusual hyperphosphorylation at several sites including Thr181 and Ser404.
The etiology of Late-onset Alzheimer’s Disease (LOAD), which represents 95% of cases, is sporadic and the only established gene associated with LOAD is Apolipoprotein E4 (ApoE4) (Verghese et al., 2011). There are three isoforms of ApoE in humans (ApoE2, ApoE3, and ApoE4), and ApoE4 is strongly associated with an increased risk of developing AD (Verghese et al., 2011; Zannis et al., 1982). The presence of one copy of the ApoE4 allele increases the risk of developing LOAD by three-fold while the risk is increased by fifteen-fold if 2 copies of the ApoE4 allele are present (Koffie et al., 2012; Verghese et al., 2011). In the central nervous system (CNS), ApoE is involved with the repair process after injury (Liu et al., 2013); it functions as a lipid transporter and/or signaling molecule (Huang et al., 2017; Pfrieger, 2003). Previous studies have reported that accumulation of ApoE4 fragments are associated with NFTs in the brains of AD patients (Huang et al., 2001), and are also detected in the neurons of ApoE4 transgenic mice (Brecht et al., 2004). ApoE4-induced behavioral deficits and neurodegeneration are caused by disruption of the cytoskeleton, stimulation of tau phosphorylation, generation of NFTs (Brecht et al., 2004; Huang, 2010), interference in Aβ clearance, aggregation of Aβ, and formation of senile plaques (Hashimoto et al., 2012; Höglund et al., 2017; Koffie et al., 2012; Tai et al., 2013; Verghese et al., 2011).
Poly- and perfluoroalkyl substances (PFASs) are a class of emerging persistent organic pollutants (POPs) with potential neurotoxic effects. They are man-made fluorinated chemicals that have been widely used in numerous industrial and consumer products such as textile products, firefighting foams, and oil-resistant coatings for paper products. PFASs are ubiquitous and persist in the environment and bioaccumulate in the food chain (Wang et al., 2019). One of the most widely used PFASs is the 8-carbon chain (C8) Perfluorooctanesulfonic acid (PFOS) which has been detected in adult human serum (Lau et al., 2007) and in children with a serum concentration equal or greater than adults (Mondal et al., 2012). Furthermore, PFOS can cross the placenta and the blood-brain barrier (BBB) (Lau et al., 2007, 2006, 2004), and has been detected in breast milk, indicating humans are vulnerable to PFOS exposure before birth and throughout their lifetime (Winkens et al., 2017). PFOS strongly binds to plasma albumin (Forsthuber et al., 2020) and has an average serum half-life of 5.4 years in humans (Olsen et al., 2007) and 36.9 days in mice (Chang et al., 2012).
Developmental studies conducted using rodents have demonstrated that PFOS exposure can induce neural damage manifested by chronic glial activation, the release of inflammatory factors (Zeng et al., 2011), and cholinergic alterations that result in behavioral deficits, including reduced spatial learning and cognitive impairment which can persist into adulthood (Fuentes et al., 2007a; Johansson et al., 2009, 2008; Wang et al., 2015). Neonatal exposure to a single PFOS dose of 21 μmol/kg body weight (11.3 mg/kg body weight) on PND10 elevated cerebral tau protein expression and induced behavioral abnormalities in adult mice (Fuentes et al., 2007b; Johansson et al., 2008). Additionally, PFOS exposure has been associated with increased β-amyloid aggregation, tau protein levels, and tau hyperphosphorylation in adult rats, in at least one study, suggesting a link between developmental PFOS exposure and LOAD (Zhang et al., 2016).
The studies mentioned above are few and limited in scope. To our knowledge, there has been no investigation on the effects of developmental PFOS exposure on ApoE in middle-aged adult mice. In addition, limited studies have investigated perinatal exposure alone and its implications on rodent behavior and biochemical markers later in life. Therefore, the main aim of this study was to investigate perinatal PFOS exposure as a risk factor for LOAD by assessing its impact on rodent behavior and biomarkers associated with three major AD-related pathways in an in vivo model using developmentally exposed CD-1 mice. Furthermore, the same pathways were examined in human SH-SY5Y neuroblastoma cells.
2. Materials and methods
2.1. Animal model and PFOS exposure
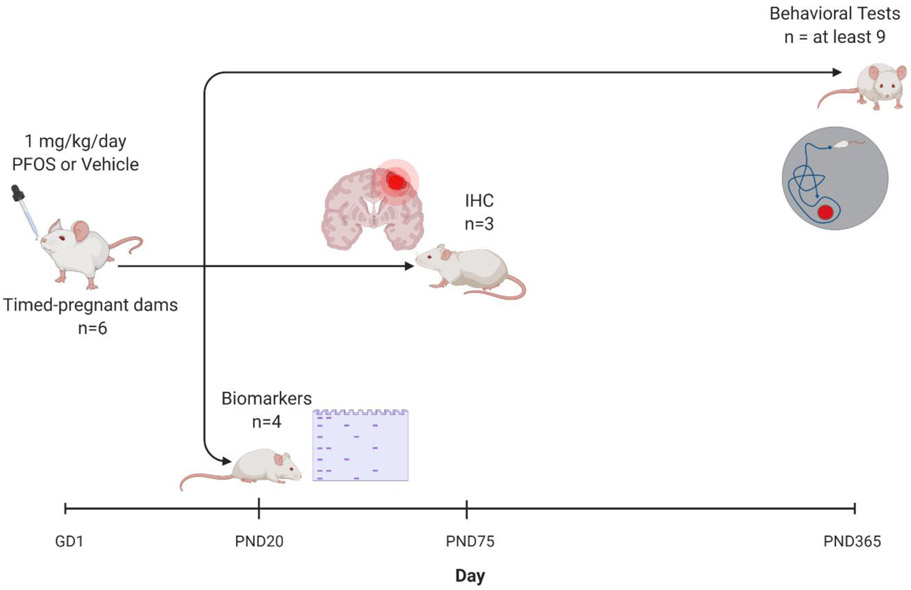
Twelve timed-pregnant CD-1 mice were purchased from Charles River Laboratories (Wilmington, MA). The pregnant dams were received on gestation day 1 (GD1) at the University of Rhode Island (URI) Comparative Biology Resource Center (CBRC). Upon arrival, the dams were weighed and housed individually in a designated room with controlled temperature (20-26°C), relative humidity (30-70%), and 12:12 hour light-dark cycle (light on at 6:00 AM; light off at 6:00 pm) where standard chow diet (SD; Teklad Extruded global diet, 2020X) and water were provided ad-libitum. Dams were randomly assigned into two treatment groups (n= 6 per treatment group) and were dosed with either vehicle (0.5% Tween-20 in deionized water) or 1 mg/kg/day PFOS (Sigma Aldrich, MO) dissolved in deionized water with 0.5% Tween-20 via oral gavage throughout gestation (GD1-GD18 or 19) and lactation (postnatal day [PND] 20) as shown in figure 1. The developmental dose was determined as between the no-observed-adverse-effect-level (NOAEL) and lowest-observed-adverse-effect (LOAEL) doses for perinatal PFOS exposure studies in mice (Wan et al., 2014). On PND20, pups were weaned and housed socially (4 males/cage and 5 females/cage). Pups were euthanized on PND 20, PND 75, or PND 385 for subsequent analysis.
Figure 1. Scheme of PFOS exposure in timed-pregnant CD-1 mice.
Pregnant mice were administered either 1 mg/kg/day PFOS in water with 0.5% Tween-20 or vehicle (0.5% Tween-20 in water) via oral gavage throughout gestation (GD1-GD18 or 19 [birth]) and lactation (birth to postnatal day [PND] 20). Brain tissues were collected from some pups at PND 20 and 75. Behavior, learning, and memory retention were assessed on PND 365-385. Created using BioRender.com.
For dose calculation, the dams were weighed every 3-4 days, with the last dose of PFOS given on PND 19. On PND 1, neonates were randomly assigned to dams within the same treatment group with 10 pups assigned to each dam to ensure equal lactational PFOS exposure, and to reduce litter effects, excess pups were culled. On PND 20, dams and pups fasted for 4-6 hours followed by anesthesia using isoflurane, blood was collected via cardiac puncture, and mice were euthanized by subsequent decapitation. One female pup and one male pup were sacrificed per dam to examine perinatal exposure before weaning. The brain tissues were dissected out, snapped frozen, and stored at −80°C for biomarker assessment. On PND 20, tissues were collected to assess biomarkers at the end of the perinatal PFOS exposure. During this study, the animals were under the supervision of the URI CBRC staff. The animal protocols and the study procedures were reviewed and approved by the University of Rhode Island Institutional (URI) Animal Care and Use Committee (IACUC).
2.2. Immunohistochemical Analysis
On PND 75, all body weights were recorded. Male mice were randomly selected from each treatment group (n=3) and were anesthetized using isoflurane and perfused transcardially with 100 ml of 1X PBS, pH 7.2. Mice were subsequently perfused with 100 ml of perfusion fix solution (4% paraformaldehyde and 4% sucrose (pH 7.2) and the brains were extracted. The brains were post-fixed in the perfusion fix solution overnight at 4 °C. Fixed brains were sent overnight and “blinded” to Neuroscience Associates (Knoxville, TN, USA), where they were sectioned in the coronal plane and stained for AT8, Campbell-Switzer Alzheimer’s Disease Stain (CSAD), and hematoxylin and eosin (H&E). This endpoint was significant to collect data as the pups had aged to be mature adult mice.
2.3. Behavioral Assessments
2.3.1. Barnes Maze
The Barnes maze was utilized to assess if learning or memory retention were changed as a result of perinatal PFOS exposure in the adult offspring. It consisted of a circular platform elevated 88.9 cm above ground, with holes along the perimeter (Item no. 60170, Stoelting Co, Wood Dale, IL). Only one designated hole led to an escape box, the position of which was fixed for all mice. Visible distal cues were present in the room and remained constant throughout the daily testing. Male and female mice were given one trial per day for a maximum of 5 minutes with a 2-minute inter-trial interval. Acquisition trials spanned for 5 consecutive days and when the mouse entered the escape box, the trial was stopped. The mouse was allowed to stay in the box for 1 min before being transferred back to the home cage. If the mouse failed to locate the escape box within the 5-minute limit, it was gently guided to the escape box and allowed to stay for 1 minute. Latency to escape was recorded during each trial. For the probe trial, the escape box was replaced by a false hole. The memory retention probe test was conducted 2 days after the last acquisition trial by recording the total percentage of the time spent by the rodent in the target quadrant during a 5-minute test.
2.3.2. Open Field
Male and female mice were placed in a square 40 cm x 40 cm gray open-field arena for 10 minutes (Item no. 60101, Stoelting Co, Wood Dale, IL). Distance traveled was recorded to assess general motor activity, center activity, and the number of times reared were recorded to assess anxiety-like behavior. These data are useful to interpret any differences observed in the Barnes maze. Both behavioral assessments were conducted at PND365 which was a significant endpoint to measure the effect of perinatal exposure on middle-aged adult mice. The Open Field Test was utilized to interpret the Barnes Maze data.
2.4. Cell culture
Human neuroblastoma SH-SY5Y cells were purchased from American Type Culture Collection (ATCC, Manassas, VA). Cells were cultured in Dulbecco’s Modified Eagle Medium (DMEM)/F12 (Invitrogen, MD, USA) supplemented with 10% fetal bovine serum (FBS) (Thermo Scientific, MA, USA), 100 U/ml penicillin, 100 μg/ml streptomycin, and 2 mM L-glutamine (Sigma Aldrich, MO, USA) in T-75 tissue culture flasks with vented lids (Cyto-one, USA Scientific) in a CO2 incubator maintained at 5% CO2 and 37°C. Cells were then sub-cultured at a density of 105 cells/mL into a six-well plate and upon 80% confluency, cells were differentiated for 6 days using 10 μM all-trans retinoic acid (Sigma Aldrich, MO, USA) dissolved in DMEM/F12 medium containing 1% FBS, 100 U/ml penicillin, 100 μg/ml streptomycin in the dark. Cells were observed for neurite out-growth with media being changed every 48 hours as described previously (Bihaqi et al., 2018). Furthermore, differentiated cells were exposed to a series of PFOS concentrations (0, 0.001, 0.1, 5, 25, 50, 100 μM) dissolved in DMSO and incubated for 24, 48, and 72 hours at 37°C, with 0 μM PFOS (vehicle only) serving as an experimental negative control. The concentration of DMSO in the cell culture media was maintained at 0.1% across all treatment groups.
2.5. Cell Viability Assay
The viability of differentiated SH-SY5Y human neuroblastoma cells was assessed after exposure to PFOS using the MTS assay kit (Promega, Madison, WI, USA). The cells were seeded in a 96-well plate (2 x 10 4cells/well) and treated with different concentrations of PFOS ranging from 0-100 μM for 24, 48, and 72 hours. After the completion of the incubation period, the media containing PFOS was aspirated out and fresh media with no PFOS was added in each well followed by treatment with 20 μl of MTS solution. The plates were incubated at 37°C for 2 hours and after incubation, the absorbance was measured at 490nm by using the Spectramax M2 Multi-mode microplate reader (Molecular Devices, CA, USA).
2.6. Protein extraction and Western blotting
The brain cortex samples and cells were lysed using radio-immunoprecipitation assay (RIPA) lysis buffer (Sigma Aldrich, MO, USA) supplemented with a phosphatase and protease inhibitor tablet (Thermo Scientific, MA, USA) as described earlier (Bihaqi et al., 2018). The samples were incubated on ice for 30 min, followed by centrifugation at 10,000 g for 20 min and the supernatants were collected and stored at −80°C for protein quantification and western blot analysis. The protein concentration was determined using a Micro BCA protein assay kit (Thermo Scientific, MA, USA). For Western blotting, 20 μg of total protein was resolved using sodium dodecyl sulfate-polyacrylamide gels (SDS-PAGE) on 4-15% Mini-protean® TGXTM precast gels (Bio-Rad, CA, USA) at 90V constant under reducing conditions and transferred onto polyvinylidene fluoride (PVDF) membranes (GE-Healthcare, NJ, USA) using dry blotting (iBlot2, Invitrogen, CA, USA). The membranes were blocked for 1 hr in 4% BSA in Tris-buffered saline containing 0.05% Tween-20, incubated overnight with primary antibodies with gentle agitation on a shaker at 4°C enlisted in Table 1, detected using InfraRed detectable secondary antibodies (LI-COR Biotechnology, Lincoln, NE), and imaged using Licor Odyssey CLX infrared scanner. Band intensities were measured using NIH ImageJ software and normalized against GAPDH.
Table 1.
Primary antibodies used in Western blot analysis.
| Antibody | Company | Isotype/ Source | Dilution |
|---|---|---|---|
| Anti-ApoE | Thermo Scientific, MA USA | Rabbit IgG | 1:1000 |
| Tau (Tau46) | Cell Signaling Technology, MA USA | Mouse IgG | 1:1000 |
| Phospho-Tau (Ser404) (D2Z4G) | Cell Signaling Technology, MA USA | Rabbit IgG | 1:1000 |
| Phospho-Tau (Thr181) (D9F4G) | Cell Signaling Technology, MA USA | Rabbit IgG | 1:1000 |
| GSK-3β (D5C5Z) XP® | Cell Signaling Technology, MA USA | Rabbit IgG | 1:1000 |
| CDK5 (D1F7M) | Cell Signaling Technology, MA USA | Rabbit IgG | 1:1000 |
| APP (E8B3O) XP® | Cell Signaling Technology, MA USA | Rabbit IgG | 1:1000 |
| GAPDH (D16H11) XP® | Cell Signaling Technology, MA USA | Rabbit IgG | 1:1000 |
2.7. Total RNA isolation, synthesis of cDNA, and RT-q PCR
Total RNA was isolated from cerebral cortex tissues and the SH-SY5Y cells using the TRIzol reagent method (Invitrogen, CA, USA). The integrity and concentration of the isolated RNA were verified by NanoDrop (Thermo Scientific, DE, USA) analysis. First-strand complementary DNA (cDNA) was synthesized from 1.5 μg of total RNA using the iScript cDNA synthesis kit (Bio-Rad, Hercules, CA) as described earlier (Bihaqi et al., 2014). The PCR reactions were carried out using SYBR green PCR master mix (Applied Biosystem, CA) and were performed using the Viia7 Real-Time PCR system (Applied Biosystems, CA, USA). Table 2 shows the list of Sense and anti-Sense primers designed using Primer-3 plus and obtained from integrated DNA Technologies (IDT) (Coralville, IA, USA). GAPDH mRNA expression was used as the endogenous control and the data was reported using the 2−ΔΔCT method.
Table 2.
List of forward and reverse primers that were used for qPCR analysis.
| Gene | Sense Strand | Anti-Sense Strand |
|---|---|---|
| Mouse TAU | 5-CCTGAGCAAAGTGACCTCC AAG-3 | 5′-CAAGGAGCCAATCTTCGACTGG-3′ |
| Mouse APP | 5-TGCAGCAGAACGGATATGAG-3 | 5′-ACACCGATGGGTAGTGAAGC-3′ |
| Mouse GSK3β | 5-AGGAAGGAAAAGGTGATTCAAGA-3 | 5′-TGCTGCCATCTTTATCTCTGCT-3′ |
| Mouse CDK5 | 5-GGGACCTGTTGCAGAACCTAT-3 | 5′-AGTCAGAGAAGTAGGGGTGCT-3′ |
| Mouse GAPDH | 5-TGGTGA AGCAGGCATCTGAG-3 | 5′-TGCTGTTG AAGTCGCAGGAG-3′ |
| Human TAU | 5-TGAACCAGGATGGCTGAGC-3 | 5′-TTGTCATCGCTTCCAGTCC-3′ |
| Human APP | 5-CTGTGGCAGACTGAACATGC-3’ | 5′-TGTTCAGAGCACACCTCTCG-3′ |
| Human GSK3β | 5-GGATTCGTCAGGAACAGGACA-3 | 5′-AGTATTAGCATCTGACGCTGC-3′ |
| Human CDK5 | 5-GATGATGAGGGTGTGCCGAG-3 | 5′-TGCGGCTATGACAGAATCC C-3′ |
| GAPDH | 5-AGGTCGGAGTCAA CGGATTT-3 | 5′TTCCCGTTCTCAGCCTTGAC-3′ |
2.8. Enzyme-Linked Immunosorbent Assay (ELISA)
Cortex tissues were weighed and homogenized in eight volumes of an ice-cold solution containing 5 M guanidine HCl dissolved in 50 mM Tris-HCl, PH 8.0 (Sigma Aldrich, St. Louis, MO). The mixture was maintained at room temperature for 3-4 hours and then diluted with ice-cold Phosphate buffer saline (PBS) supplemented with 1X protease and phosphatase inhibitor (Thermo Scientific, Waltham, MA) until reaching a final concentration of 0.1 M guanidine. The samples were centrifuged for 20 minutes at 16,000 g at 4°C and the resulting supernatant was maintained either on ice for Aβ quantification or stored at −80°C for later use. ELISA kit catalog numbers KMB3441 and KMB3481 (Thermo Scientific, Waltham, MA) were used according to the manufacturer’s instruction for quantification of Aβ1-42 and Aβ1-40 respectively.
These ELISA kits contained a colorimetric detection with a double ELISA antibody approach. In each kit, the N-terminus of the mouse Aβ is determined by the monoclonal antibody-coated in the wells. The Standards (provided in the kit) and the samples containing the Aβ antigen were added to the wells with the appropriate dilution (100 μl in each well). The plates were maintained at room temperature for 2 hours to allow the binding of the immobilized (capture) antibody and the Aβ antigen. Then, the plates were washed four times by using the washing solution provided in the kit. Subsequently, a solution of rabbit antibody specific for the C-terminus of either Aβ1-42 or Aβ1-40 was added to the wells (100 μl in each well) except for the blanks. The plates were then covered and incubated again for 1 hour at room temperature. After incubation, the wells were washed 4X using the washing solution and 100 μl of horseradish-peroxidase-labeled anti-rabbit antibody was added to each well except for the blanks. Then, the plate was covered and incubated at room temperature for 30 minutes followed by four times washing. Then, 100 μl of the stabilized chromogen solution was added to each well and the plate was incubated at room temperature for 20-30 minutes in the dark. Once, the reaction mixtures turned blue, 100 μl per well of the stop solution was added to each well to stop the reaction and the mixture turned yellow. Finally, the absorbance was detected at 450 nm using the Spectramax M2 Multi-mode microplate reader (Molecular Devices, San Jose, CA).
2.9. Statistical analysis
The results of various exposed groups versus the control were expressed as the mean ± the standard error of the mean (SEM). The data were analyzed by using the statistical tests: unpaired two-tailed Student's t-test for comparison between two groups and the one-way analysis of variance (ANOVA) followed by the Dunnett or Tukey test for multigroup comparisons. The Barnes maze data was collected using Any-maze Behavior Tracking Software (Item no. 60000, Stoelting Co, Wood Dale, IL) and results were analyzed using two-way ANOVA. The GraphPad Prism 8.0 computer software (La Jolla, CA, USA) was used for the statistical analysis, and a p-value < 0.05 was considered to indicate a statistically significant difference.
3. Results
3.1. Effects of developmental PFOS exposure on body weight, biomarkers, and behavior
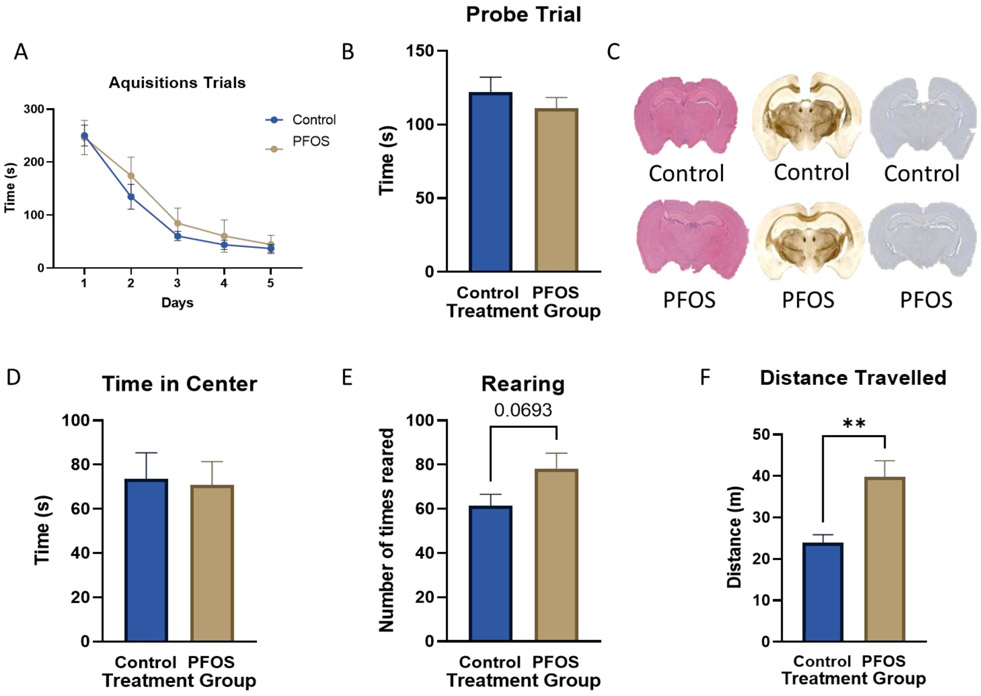
Female mice that were developmentally exposed to PFOS had significantly increased body weight throughout their lifetime (Figure 2A). Male mice exposed to PFOS had no overt body weight changes (Figure 2B). We did not observe significance in the Barnes maze cognitive assessment during the acquisition trials or probe trials for PND 385 mice (Figure 3A, B). Immunohistochemical and nissel staining analysis of PND 75 male mice did not show gross morphological and anatomical differences between control and exposed mice (Figure 3C). During the open field test analysis, PFOS exposed mice demonstrated a strong trend in increased rearing and significantly increased distanced travelled.
Figure 2. Bodyweight (PND20-PND360).
Female (A) and Male mice (B) were weighed on postnatal day (PND) 20, 75, 230 and 360. Results are expressed as mean ± SEM using a two-way ANOVA n was at least 4. *p < 0.05, **p<0.01, ***p < .001, ****p < .0001 was considered significant.
Figure 3. Barnes maze (PND 385), Open Field Test (PND 385), and Immunohistochemical data (PND 75).
(A-B) On PND 385, male and female mice were analyzed for cognitive impairment or locomotor differences using the Barnes maze acquisition trials (A) and the probe trial (B) with an ‘n’ of at least 9. In the SDVH group, there were 6 males and 12 females, and, in the SDPFOS group, there were 4 males and 5 females. (C) On PND 75, male mice (n=3 per treatment group) were anesthetized and transcardially perfused. Brains were stained using H&E, CSAD, and AT8 staining solutions, respectively. These images of control brains (top), and developmentally exposed mice (bottom) are representative. (D-F) Male and female mice were analyzed during the open field test for the time spent in the center (D), the number of times reared (E), and the distance traveled (F). Results are expressed as mean ± SEM using either a two-way ANOVA (A) or a parametric two-tailed unpaired t-test with Welch’s correction (B, D-F). *p < 0.05, **p<0.01, ***p < .001, ****p < .0001 was considered significant.
3.2. Effects of developmental exposure of PFOS on APP mRNA expression, APP protein levels, Aβ1-42 and Aβ1-40 accumulation (amyloidogenic pathway)
Our results indicate that on PND 20 mice with developmental exposure to PFOS did not display any changes in APP protein expression and mRNA levels compared to age-matched controls (Figure 4A-C). Furthermore, developmental PFOS exposure did not alter Aβ42 and Aβ40 protein levels, nor was the ratio of Aβ42/Aβ40 protein levels affected (Figure 4D-F).
Figure 4. APP mRNA and protein levels at PND 20 in the cortex of CD-1 mice developmentally exposed to PFOS (amyloidogenic pathway).
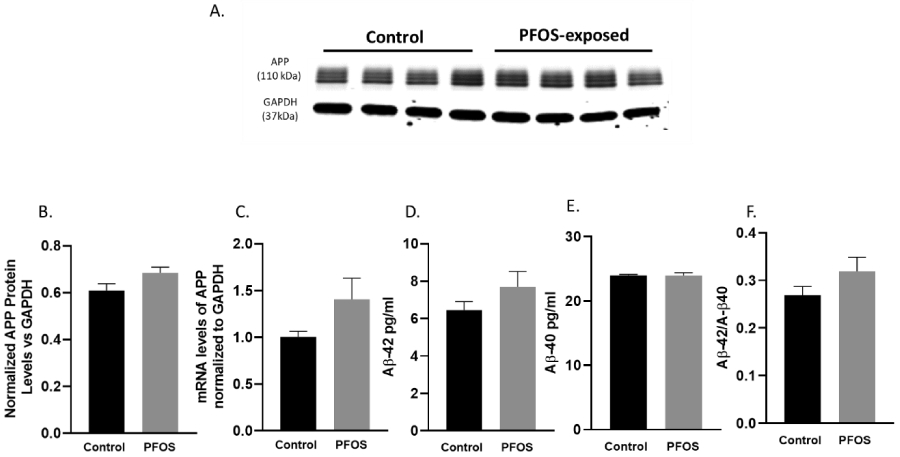
Timed-pregnant CD-1 mice were administered with vehicle (0.5% Tween-20 in water) or 1 mg/kg/day PFOS in water with 0.5% Tween-20 via oral gavage from gestation GD 1 through postnatal day PND 20. (A-B) quantification of APP protein levels normalized to GAPDH. (C) APP mRNA levels. (D-E) quantification of Aβ 1-42 and Aβ 1-40 protein levels normalized to GAPDH. (F) Aβ 1-42: Aβ 1-40 ratio. Results are expressed as mean ± S.E.M using the two-tailed unpaired t-test, n=4. Results were non-significant.
3.3. Effects of developmental PFOS exposure on Total Tau, P-tau protein expression and mRNA levels (tau Pathway)
At PND 20, normalized total tau and site-specific tau phosphorylation protein expressions were evaluated. Western blot analysis showed no significant difference between the PFOS exposed group and the control group in total tau and site-specific tau phosphorylation (Ser-404, Thr-181) (Figure 5A-D, F, G). Tau mRNA levels measured by qPCR revealed no significant change in the mRNA levels at PND20 in the cortex mice with developmental PFOS exposure compared to age-matched controls (Figure 5E).
Figure 5. Tau mRNA and protein levels at PND 20 in the cortex of CD-1 pup mice developmentally exposed to PFOS (tau pathway).
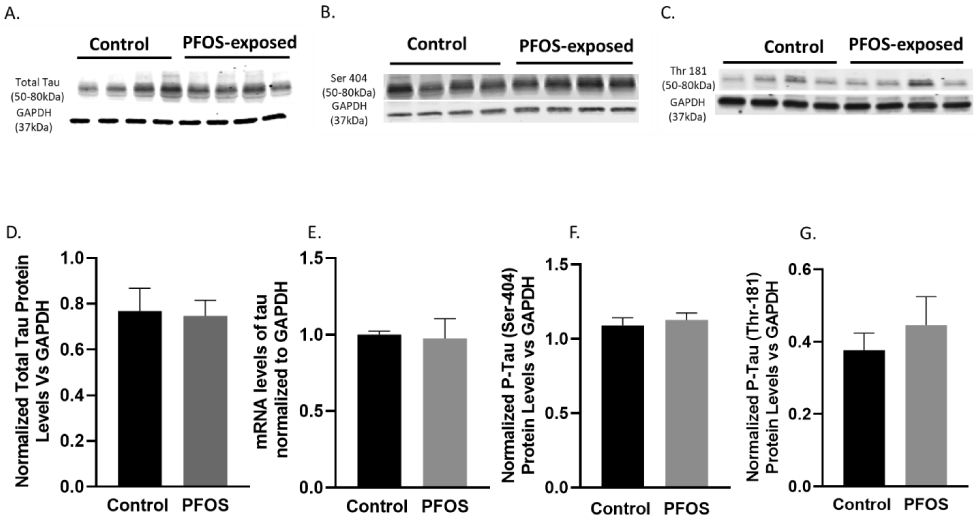
Timed-pregnant CD-1 mice were administered with vehicle (0.5% Tween-20 in water) or 1 mg/kg/day PFOS in water with 0.5% Tween-20 via oral gavage from gestation GD1 through postnatal day PND 20. (A D) Blots and quantification of Tau protein levels normalized to GAPDH. (E) Tau mRNA levels. (B, F) Blots and quantification of p-tau (ser404) protein levels normalized to GAPDH. (C, G) Blots and quantification of p-tau (Thr 181) protein levels normalized to GAPDH. Results are expressed as mean ± S.E.M using the two-tailed unpaired t-test, n=4. Results don’t indicate a significant difference between the two groups.
3.4. Effects of developmental PFOS exposure on protein and mRNA levels of Kinases
Antibodies directed against GSK3β showed a small but significant (p=0.05) increase in the protein expression levels at PND 20 (Figure 6A, C). A similar trend was also observed in the GSK3β mRNA levels in mice with developmental exposure to PFOS at PND 20 compared to age-matched controls (Figure 6D). No significant increase was observed in the protein expression or mRNA levels of CDK5 in the above-mentioned experimental groups (Figure 6B, E, F).
Figure 6. GSK3β, CDK5 mRNA levels, and protein levels at PND 20 in the cortex of CD-1 pup mice developmentally exposed to PFOS (kinase pathway).
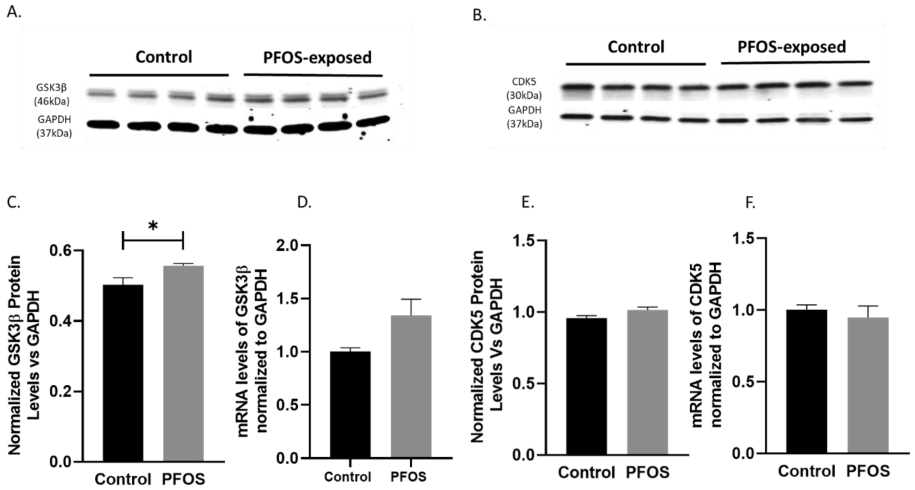
Timed-pregnant CD-1 mice were administered with vehicle (0.5% Tween-20 in water) or 1 mg/kg/day PFOS in water with 0.5% Tween-20 via oral gavage from gestation GD1 through PND 20. (A, C) Blots and quantification of GSK3β protein levels normalized to GAPDH. (D) GSK3β mRNA levels. (B, E) Blots and quantification of CDK5 protein levels normalized to GAPDH. (F) CDK5 mRNA levels. Results are expressed as mean ± S.E.M using the two-tailed unpaired t-test n=4 (*P< 0.05, **P< 0.01).
3.5. Effects of developmental PFOS exposure on total ApoE protein levels (Non-neural Pathway)
Western blot analysis demonstrated that PFOS exposure significantly increased total ApoE protein levels in the cortex of PND 20 mice as compared to the control group, p= 0.0025 analyzed by two-tailed unpaired t-test (Figure 7A, B).
Figure 7. Total ApoE protein levels at PND 20 in the cortex of CD-1 pup mice developmentally exposed to PFOS (non-neural pathway).
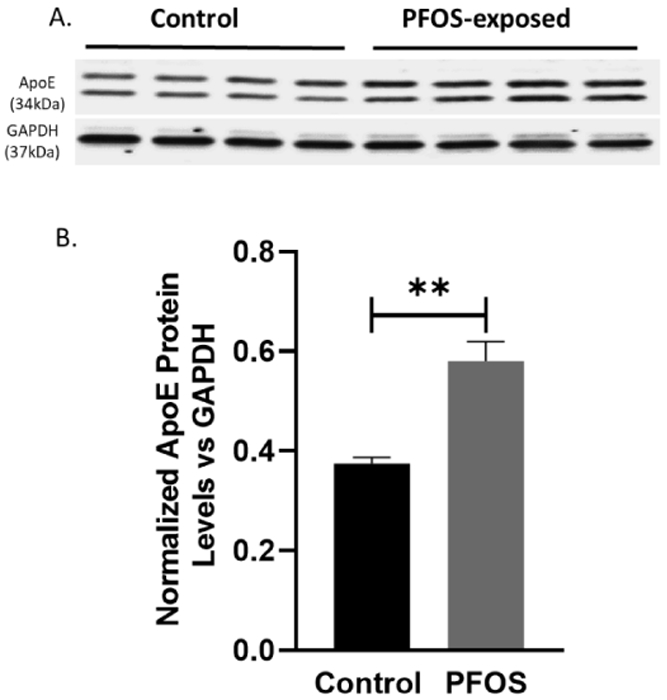
Timed-pregnant CD-1 mice were administered with vehicle (0.5% Tween-20 in water) or 1 mg/kg/day PFOS in water with 0.5% Tween-20 via oral gavage from gestation GD1 through postnatal day PND 20. (A-B) quantification of ApoE protein levels normalized to GAPDH. Results are expressed as mean ± S.E.M using the two-tailed unpaired t-test, n=4 (*P< 0.05, **P< 0.01).
3.6. Cytotoxicity of PFOS on differentiated SH-SY5Y cells
Differentiated SH-SY5Y cells were exposed to a series of PFOS concentrations (0, 0.001, 0.1, 1, 5, 25, 50, 100 μM) and cell viability was determined using the MTS assay following 24, 48, and 72 h of exposure. No significant PFOS cytotoxicity was observed in differentiated SH-SY5Y cells at 24 h exposure. However, at 48 h (100 μM) and at 72 h (25, 50, 100 μM) concentrations of PFOS revealed significant decreases in cell viability (p = 0.05, p< 0.001). Thus, PFOS exposure at concentrations 0.001, 0.1 μM for 24 was considered appropriate for further studies (Figure 8).
Figure 8. Effects of PFOS exposure on SH-SY5Y cells viability.
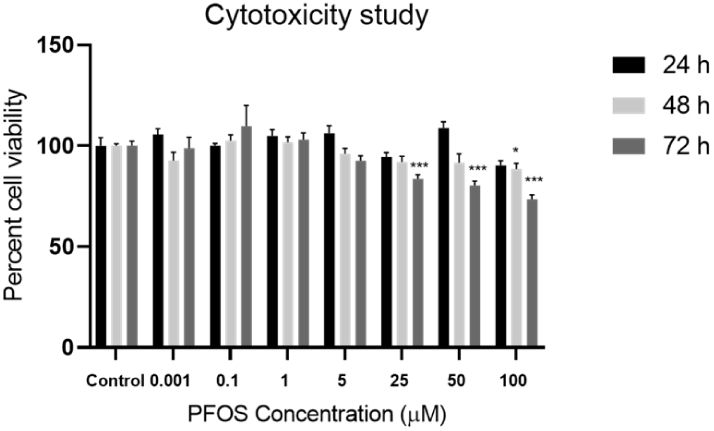
Cells were exposed to a series of PFOS concentrations (0, 0.001, 0.1, 1, 5, 25, 50, 100 μM) for 24, 48 and 72 h followed by MTS assay. Data are expressed as mean ± S.E.M using the one-way ANOVA followed by Dunnett’s for multiple comparisons, n=4 (*P< 0.05, **P< 0.01, ***P< 0.001).
3.7. PFOS altered APP protein and mRNA levels in differentiated SH-SY5Y cells. (amyloidogenic pathway)
Further, we investigated the effects of PFOS on AD biomarkers related to the amyloidogenic pathway in human neuroblastoma SH-SY5Y cells. APP protein levels were significantly elevated as compared to the controls after 24 h exposure to 0.001 μM concentration of PFOS, p= 0.0152 (Figure 9A, B). No significant changes were observed in APP mRNA levels (Figure 9C).
Figure 9. APP mRNA and protein levels in differentiated SH-SY5Y cells after PFOS exposure (amyloidogenic pathway).
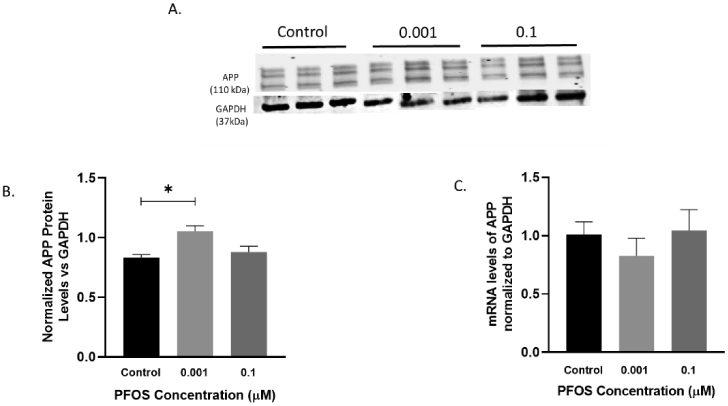
Differentiated SH-SY5Y cells exposed to PFOS at 0.001 and 0.1 μM concentrations for 24 h. (A-B) Blots and quantification of APP protein levels normalized to GAPDH. (C) APP mRNA levels. Results are expressed as mean ± S.E.M using the one-way ANOVA followed by Dunnett’s for multiple comparisons, n=3 per treatment group (*P<0.05, **P< 0.01).
3.8. Effect of PFOS on protein and mRNA levels of Total Tau, site-specific phosphorylated tau in differentiated SH-SY5Y cells (tau Pathway)
SH-SY5Y cells showed a significant increase in total tau, P-tau (Ser-404) and P-tau (Thr-181) protein levels as compared to controls after 24 h exposure to 0.001 μM of PFOS, P = 0.0307, P = 0.0062, P=0.036, respectively (Figure 10A,D,B,F,C,G). Based on a one-way ANOVA analysis, no significance was observed in total tau mRNA expression of PFOS exposed cells (Figure 10E).
Figure 10. Tau mRNA and protein levels in differentiated SH-SY5Y cells after PFOS exposure (tau pathway).
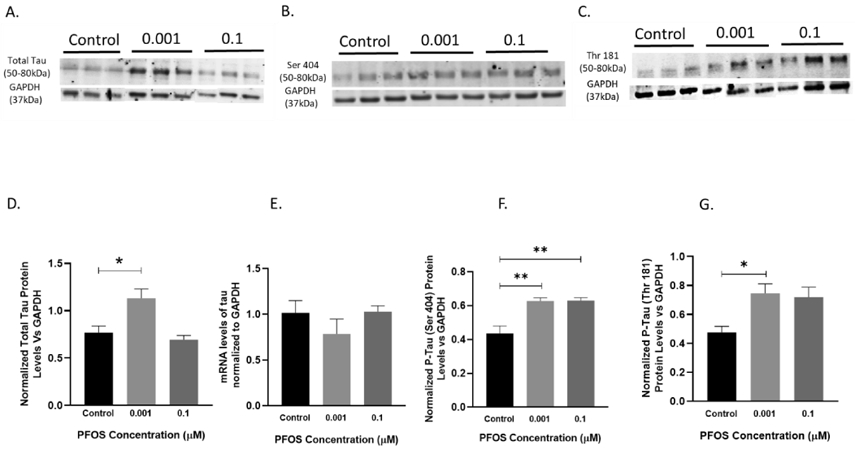
Differentiated SH-SY5Y cells exposed to PFOS at 0.001 and 0.1 μM concentrations for 24 h. (A, D) Blots and quantification of Tau protein levels normalized to GAPDH. (E) Tau mRNA levels. (B, F) Blots and quantification of p-tau (ser404) protein levels normalized to GAPDH. (C, G) Blots and quantification of p-tau (Thr 181) protein levels normalized to GAPDH. Results are expressed as mean ± S.E.M using the one-way ANOVA followed by Dunnett’s for multiple comparisons n=3 per treatment group (*P< 0.05, **P< 0.01).
3.9. Effects of PFOS exposure on protein and mRNA levels of tau-related Kinases
Next, we investigated the effect of PFOS on tau-related kinase pathways in differentiated SH-SY5Y cells. Antibodies directed against GSK3β and CDK5 were used in the western blot analysis. Protein expression of GSK3β was modestly but significantly elevated as compared to controls following 24 h exposure of SH-SY5Y cells to PFOS at 0.001 μM concentration, p=0.012 analyzed by the one-way ANOVA (Figure 11A, C). No significant change was observed in the protein expression of CDK5 in PFOS exposed cells as compared to control cells (Figure 11B, E). Furthermore, PFOS exposed cells did not display any alterations in the mRNA levels of GSK3β and CDK5. (Figure 11D, F), based on a one-way ANOVA followed by Dunnett’s for multiple comparisons.
Figure 11. GSK3β, CDK5 mRNA, and protein levels in differentiated SH-SY5Y cells after PFOS exposure (kinase pathway).
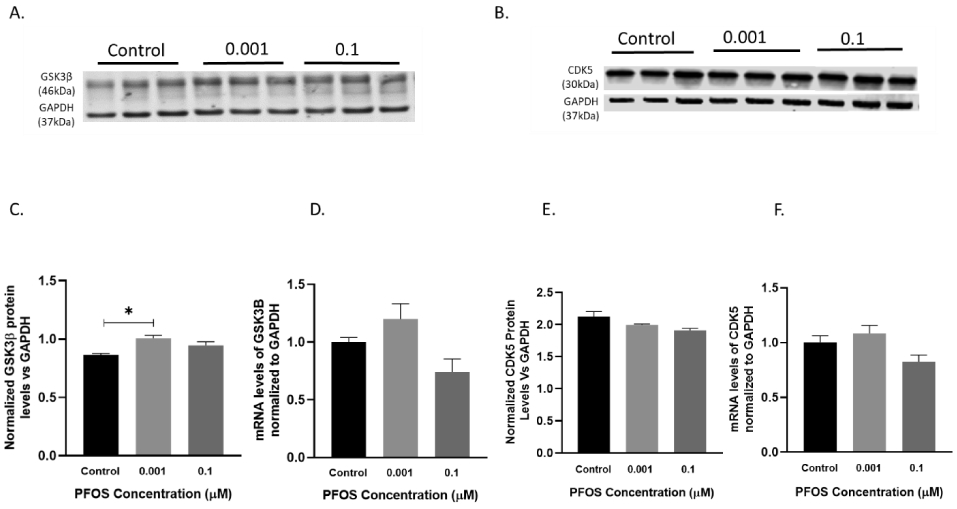
Differentiated SH-SY5Y cells exposed to PFOS at 0.001 and 0.1 μM concentrations for 24 h. (A, C) Blots and quantification of GSK3β protein levels normalized to GAPDH. (D) GSK3β mRNA levels. (B, E) Blots and quantification of CDK5 protein levels normalized to GAPDH. (F) CDK5 mRNA levels. Results are expressed as mean ± S.E.M using the one-way ANOVA followed by Dunnett’s for multiple comparisons, n=3 per treatment group (*P<0.05, **P< 0.01).
3.10. PFOS effects on Total ApoE protein levels in differentiated SH-SY5Y cells
We further analyzed the impact of PFOS exposure on non-neural features associated with AD. Interestingly, no change in the protein expression of total ApoE was observed in differentiated SH-SY5Y exposed to PFOS at 0.001 and 0.1 μM concentrations following 24 h of exposure (Figure 12A, C). Data was analyzed by a one-way ANOVA followed by Dunnett’s for multiple comparisons.
Figure 12. ApoE protein levels in differentiated SH-SY5Y cells after PFOS exposure (non-neural pathway).
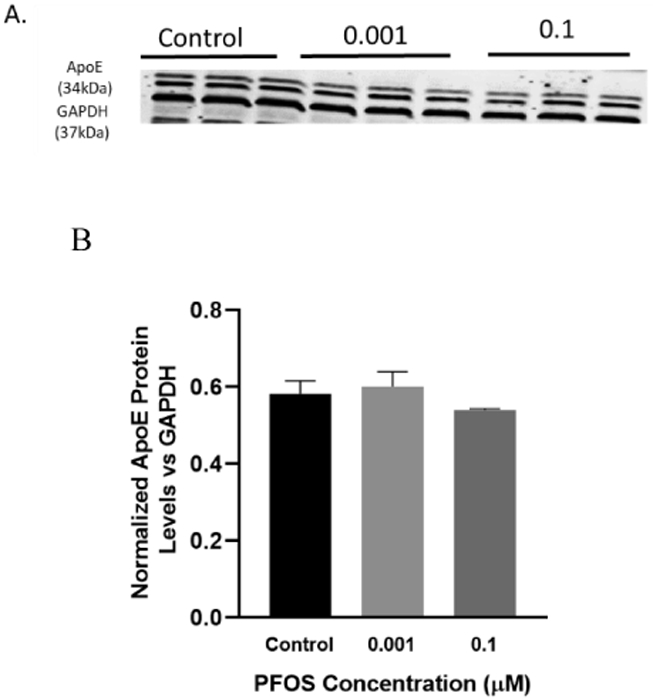
Differentiated SH-SY5Y cells exposed to PFOS at 0.001 and 0.1 μM concentrations for 24 h. (A, B) quantification of ApoE protein levels normalized to GAPDH. Results are expressed as mean± S.E.M using the one-way ANOVA followed by Dunnett’s for multiple comparisons, n=3 per treatment group (*P< 0.05, **P<0.01).
5. Discussion
As a persistent organic pollutant, PFOS has been identified as a developmental neurotoxicant (Lau et al., 2007, 2003; Luebker et al., 2005). Previous studies have reported the developmental effects of PFOS on neurological disorders, behavioral disorders, and cognitive function (Long et al., 2013; Sun et al., 2019; Wang et al., 2015). A few reports indicated that developmental exposure to PFOS induced tau protein levels (Johansson et al., 2009) and enhanced AD pathological hallmarks (Zhang et al., 2016); however, the simultaneous effects of PFOS on amyloidogenic, tau, kinases, and non-neural pathways linked to AD pathogenesis have not been elucidated in the literature. Previous work from our lab has demonstrated that developmental exposure to environmental toxins such as lead (Pb) induced cognitive deficits, latent overexpression of tau, and phosphorylated tau in the adult rodent cortex (Bihaqi et al., 2014). Also, SH-SY5Y exposed to a series of Pb concentrations (0-100 μM) for 48 h showed an alteration in tau and hyperphosphorylation of tau (Bihaqi et al., 2017). Therefore, we performed in vivo and in vitro studies to investigate the potential simultaneous impact of another pollutant (PFOS) on AD-related biomarkers and pathways.
We evaluated the generalized body weight and cognitive effects of developmental PFOS exposure on adult PND 75 and PND 385 mice. Female mice that were developmentally exposed to PFOS exhibited increased body weight on PND 230 and PND 360 (Figure 2A). This result confirmed recent data proving that PFOS could interfere with human body weight regulation and metabolism (Liu et al., 2018; Maisonet et al., 2012). However, in male mice, there were no overt changes to body weight (Figure 2B). We performed immunohistochemical analysis on PND 75 male mouse brains and we found no immunohistochemical differences in gross brain morphology (Figure 3C). We did not observe changes in mouse spatial learning and memory as measured by the Barnes maze acquisition and probe trials (Figure 3A, B). However, PFOS-exposed mice did exhibit a strong trend for increased rearing and significantly increased distance travelled during the open field test assessment (Figure 3E, F). These results are comparable to studies that have shown that PFOS affects the cholinergic system manifested by reduced habituation and hyperactivity (Johansson et al., 2008). Interestingly we, also, have unpublished data from out collaborators indicating that serum levels of PFOS were significantly decreased in Male and Female pups after PND90.
It is worth noting here that our in vivo findings did not demonstrate that PFOS exposure directly alters biomarkers associated with amyloidogenic and tau pathways in wild-type CD-1 mice on PND 20 (Figures 4 and 5). These observations were consistent with reports by Butenhoff and colleagues (2009) (Butenhoff et al., 2009). In our study, PFOS was administered to dams via oral gavage, and we focused on perinatal exposure of pups to PFOS during gestation and through lactation until PND 20. However, our in vivo data demonstrated that developmental exposure to PFOS caused a significant increase in GSK3β protein levels (Figure 6). PFOS exposure also resulted in a significant elevation of total ApoE protein levels in the cerebral cortex of wild-type CD-1 mice (Figure 7).
The present study established that the concentration range of PFOS (0-100 μM) had no significant cytotoxicity on differentiated SH-SY5Y cells following 24 h of exposure (Figure 8) and revealed that PFOS may impact the amyloidogenic pathway which was indicated by elevation of APP levels (Figure 9) at 0.001 μM of PFOS in SH-SY5Y cells. Furthermore, overexpression of tau and site-specific hyperphosphorylation of tau (Ser-404 and Thr181) proteins were both induced by PFOS in SH-SY5Y cells at very low concentrations (0.001and 0.1 μM) (Figure 10), providing evidence that PFOS can promote AD pathogenesis through modulating the APP and tau pathways. The upregulation of total tau and the abnormal hyperphosphorylation of tau (P -tau) proteins are responsible for the loss of microtubule stability and axonal transport in AD (Dubey et al., 2015; Salehi et al., 2003). This is consistent with the study by Zhang and coworkers which reported that developmental exposure to PFOS induced β-amyloid aggregation, total tau, and phosphorylated tau proteins levels in adult rats at PND 90 (Zhang et al., 2016). Also, Johansson and colleagues reported that neonate mice directly administered a single PFOS dose on PND 10 exhibited a significant elevation of cerebral tau protein levels (Johansson et al., 2009).
Moreover, we investigated the effect of PFOS on the kinase pathways that are associated with AD. GSK3β is an active serine/threonine proline-directed kinase, which is involved in many processes including inflammatory responses, memory impairment, cholinergic deficits, increased production of Aβ, and hyperphosphorylation of tau (Hoshi et al., 1996). Also, the sites of tau phosphorylation found in AD brains are proline-directed (Thr-Pro or Ser-Pro). Thus, GSK3β plays an important role in the pathogenesis of AD (Hooper et al., 2008). In this study, we observed the ability of PFOS to promote an increase in the GSK3β protein levels at very low concentrations (0.001 μM; Figure 11A, C).
Although our in vivo and in vitro findings indicated changes in the protein levels of key biomarkers related to major AD-associated pathways, PFOS caused no changes in the mRNA expression of these biomarkers. Therefore, one may conclude that the impact of PFOS is not occurring directly on the genome, but rather on posttranscriptional or signaling pathways. It is also worth noting that in vitro effects of PFOS exposure were mainly in the lower concentration range and for a short duration (24 hours), consistent with previous studies on other cell types that described the dose-response curve of PFOS as bell-shaped and non-monotonic (Chen et al., 2018; Wang et al., 2015).
It is important to state that this study has limitations. Wild-type mice and SH-SY5Y cells were used which do not express ApoE4. Nor do wild-type mice develop plaques or tangles. Additionally, PND20-385 may be too early to detect AD-related changes in wild-type mice. Although it is well-known that PFOS is found in the placenta, breast milk and neonate brains, quantification of PFOS in the developmentally exposed brain would’ve further supported this study. Nevertheless, these data reveal the responsiveness of AD-related biomarkers and rodent behavior to perinatal PFOS exposure.
6. Conclusion
The results presented herein suggest that PFOS impacts amyloidogenic, tau, and kinase pathways related to AD, particularly in human cells via a mechanism associated with GSK3β. Furthermore, PFOS also altered female body weight and locomotor behavior in mice. Future work should utilize transgenic mice with human APP, Tau, and ApoE4 which would further elucidate the mechanism by which PFOS exposure induces AD pathogenesis. Additionally, studying the effect of PFOS exposure on other CNS cells such as microglia and astrocytes can further delineate the impact of PFOS on ApoE and enhance our understanding of the mechanisms that mediate the impact of PFOS on neurodegeneration.
Highlights.
Perfluorooctanesulfonic acid (PFOS) exposure impacted rodent behavior
PFOS exposure upregulated Alzheimer’s disease-related biomarkers in CD-1 mice
Developmental PFOS exposure increased body weight in female mice
Acknowledgments
The authors would like to extend their thanks to the animal care staff at the URI Comparative Biology Resources Center (CBRC) for their assistance with monitoring the health of the mice. Also, we’d like to thank Sadegh Modaresi for his assistance with mouse dosing. The authors would like to extend their gratitude to the Fulbright Student Scholarship program and the Fulbright Scholar program for their continuous support and for generously funding Ms.Basaly and Dr. Zawia, respectively. Ms. Basaly would also like to thank Misr International University (MIU) in Egypt for their encouragement and support.
Funding
This research was supported by the National Institute of Health STEEP grant (number P42ES027706-03S1) awarded to Dr. Lohmann with an AD supplement that was given to Dr. Slitt and Dr. Zawia. The research was made possible by the use of equipment available through the Rhode Island Institutional Development Award (IDeA) Network of Biomedical Research Excellence from the National Institute of General Medical Sciences (P20GM103430).
Footnotes
Declaration of interests
The authors declare no conflict of interest.
Publisher's Disclaimer: This is a PDF file of an unedited manuscript that has been accepted for publication. As a service to our customers we are providing this early version of the manuscript. The manuscript will undergo copyediting, typesetting, and review of the resulting proof before it is published in its final form. Please note that during the production process errors may be discovered which could affect the content, and all legal disclaimers that apply to the journal pertain.
References
- Bihaqi SW, Alansi B, Masoud AM, Mushtaq F, Subaiea GM, Zawia NH, 2018. Influence of Early Life Lead (Pb) Exposure on α-Synuclein, GSK-3β and Caspase-3 Mediated Tauopathy: Implications on Alzheimer’s Disease. Curr. Alzheimer Res 10.2174/1567205015666180801095925 [DOI] [PubMed] [Google Scholar]
- Bihaqi SW, Bahmani A, Adem A, Zawia NH, 2014. Infantile postnatal exposure to lead (Pb) enhances tau expression in the cerebral cortex of aged mice: Relevance to AD. Neurotoxicology. 10.1016/j.neuro.2014.06.008 [DOI] [PMC free article] [PubMed] [Google Scholar]
- Bihaqi SW, Eid A, Zawia NH, 2017. Lead exposure and tau hyperphosphorylation: An in-Vitro study. Neurotoxicology 62, 218–223. 10.1016/j.neuro.2017.07.029 [DOI] [PubMed] [Google Scholar]
- Brecht WJ, Harris FM, Chang S, Tesseur I, Yu GQ, Xu Q, Fish JD, Wyss-Coray T, Buttini M, Mucke L, Mahley RW, Huang Y, 2004. Neuron-Specific Apolipoprotein E4 Proteolysis Is Associated with Increased Tau Phosphorylation in Brains of Transgenic Mice. J. Neurosci 10.1523/JNEUROSCI.4315-03.2004 [DOI] [PMC free article] [PubMed] [Google Scholar]
- Butenhoff JL, Chang SC, Ehresman DJ, York RG, 2009. Evaluation of potential reproductive and developmental toxicity of potassium perfluorohexanesulfonate in Sprague Dawley rats. Reprod. Toxicol 10.1016/j.reprotox.2009.01.004 [DOI] [PubMed] [Google Scholar]
- Caruso A, Motolese M, Iacovelli L, Caraci F, Copani A, Nicoletti F, Terstappen GC, Gaviraghi G, Caricasole A, 2006. Inhibition of the canonical Wnt signaling pathway by apolipoprotein E4 in PC12 cells. J. Neurochem 10.1111/j.1471-4159.2006.03867.x [DOI] [PubMed] [Google Scholar]
- Chang SC, Noker PE, Gorman GS, Gibson SJ, Hart JA, Ehresman DJ, Butenhoff JL, 2012. Comparative pharmacokinetics of perfluorooctanesulfonate (PFOS) in rats, mice, and monkeys. Reprod. Toxicol 10.1016/j.reprotox.2011.07.002 [DOI] [PubMed] [Google Scholar]
- Chen X, Nie X, Mao J, Zhang Y, Yin K, Jiang S, 2018. Per fl uorooctanesulfonate induces neuroinflammation through the secretion of TNF-alpha mediated by the JAK2/STAT3 pathway. Neurotoxicology 66, 32–42. 10.1016/j.neuro.2018.03.003 [DOI] [PubMed] [Google Scholar]
- Deture MA, Dickson DW, 2019. The neuropathologica l diagnosis of Alzheimer’s disease. Mol. Neurodegener 10.1186/s13024-019-0333-5 [DOI] [PMC free article] [PubMed] [Google Scholar]
- Dubey J, Ratnakaran N, Koushika SP, 2015. Neurodegeneration and microtubule dynamics: Death by a thousand cuts. Front. Cell. Neurosci 10.3389/fncel.2015.00343 [DOI] [PMC free article] [PubMed] [Google Scholar]
- Forsthuber M, Kaiser AM, Granitzer S, Hassl I, Hengstschläger M, Stangl H, Gundacker C, 2020. Albumin is the major carrier protein for PFOS, PFOA, PFHxS, PFNA and PFDA in human plasma. Environ. Int 10.1016/j.envint.2019.105324 [DOI] [PubMed] [Google Scholar]
- Fuentes S, Colomina MT, Vicens P, Franco-Pons N, Domingo JL, 2007a. Concurrent exposure to perfluorooctane sulfonate and restraint stress during pregnancy in mice: Effects on postnatal development and behavior of the offspring. Toxicol. Sci 10.1093/toxsci/kfm121 [DOI] [PubMed] [Google Scholar]
- Fuentes S, Vicens P, Colomina MT, Domingo JL, 2007b. Behavioral effects in adult mice exposed to perfluorooctane sulfonate (PFOS). Toxicology. 10.1016/j.tox.2007.09.012 [DOI] [PubMed] [Google Scholar]
- Garcia ML, Cleveland DW, 2001. Going new places using an old MAP: Tau, microtubules and human neurodegenerative disease. Curr. Opin. Cell Biol 10.1016/S0955-0674(00)00172-1 [DOI] [PubMed] [Google Scholar]
- Gawel K, Gibula E, Marszalek-Grabska M, Filarowska J, Kotlinska JH, 2019. Assessment of spatial learning and memory in the Barnes maze task in rodents—methodological consideration. Naunyn. Schmiedebergs. Arch. Pharmacol 10.1007/s00210-018-1589-y [DOI] [PMC free article] [PubMed] [Google Scholar]
- Hashimoto T, Serrano-Pozo A, Hori Y, Adams KW, Takeda S, Banerji AO, Mitani A, Joyner D, Thyssen DH, Bacskai BJ, Frosch MP, Spires-Jones TL, Finn MB, Holtzman DM, Hyman BT, 2012. Apolipoprotein e, especially apolipoprotein E4, increases the oligomerization of amyloid β peptide. J. Neurosci 10.1523/JNEUROSCI.1542-12.2012 [DOI] [PMC free article] [PubMed] [Google Scholar]
- Höglund K, Kern S, Zettergren A, Börjesson-Hansson A, Zetterberg H, Skoog I, Blennow K, 2017. Preclinical amyloid pathology biomarker positivity: Effects on tau pathology and neurodegeneration. Transl. Psychiatry 10.1038/tp.2016.252 [DOI] [PMC free article] [PubMed] [Google Scholar]
- Hooper C, Killick R, Lovestone S, 2008. The GSK3 hypothesis of Alzheimer’s disease. J. Neurochem 10.1111/j.1471-4159.2007.05194.x [DOI] [PMC free article] [PubMed] [Google Scholar]
- Hoshi M, Takashima A, Noguchi K, Murayama M, Sato M, Kondo S, Saitoh Y, Ishiguro K, Hoshino T, Imahori K, 1996. Regulation of mitochondrial pyruvate dehydrogenase activity by tau protein kinase I/glycogen synthase kinase 3beta in brain. Proc Natl Acad Sci U S A 93, 2719–2723. 10.1073/pnas.93.7.2719 [DOI] [PMC free article] [PubMed] [Google Scholar]
- Huang Y, 2010. Aβ-independent roles of apolipoprote in E4 in the pathogenesis of Alzheimer’s disease. Trends Mol. Med 10.1016/j.molmed.2010.04.004 [DOI] [PubMed] [Google Scholar]
- Huang Y, Liu XQ, Wyss-Coray T, Brecht WJ, Sanan DA, Mahley RW, 2001. Apolipoprotein E fragments present in Alzheimer’s disease brains induce neurofibrillary tangle-like intracellular inclusions in neurons. Proc. Natl. Acad. Sci. U. S. A 10.1073/pnas.151254698 [DOI] [PMC free article] [PubMed] [Google Scholar]
- Huang YWA, Zhou B, Wernig M, Südhof TC, 2017. ApoE2, ApoE3, and ApoE4 Differentially Stimulate APP Transcription and Aβ Secretion. Cell. 10.1016/j.cell.2016.12.044 [DOI] [PMC free article] [PubMed] [Google Scholar]
- Johansson N, Eriksson P, Viberg H, 2009. Neonatal Exposure to PFOS and PFOA in Mice Results in Changes in Proteins which are Important for Neuronal Growth and Synaptogenesis in the Developing Brain. Toxicol. Sci 108, 412–418. 10.1093/toxsci/kfp029 [DOI] [PubMed] [Google Scholar]
- Johansson N, Fredriksson A, Eriksson P, 2008. Neonatal exposure to perfluorooctane sulfonate (PFOS) and perfluorooctanoic acid (PFOA) causes neurobehavioural defects in adult mice. Neurotoxicology 29, 160–169. 10.1016/J.NEURO.2007.10.008 [DOI] [PubMed] [Google Scholar]
- Koffie RM, Hashimoto T, Tai HC, Kay KR, Serrano-Pozo A, Joyner D, Hou S, Kopeikina KJ, Frosch MP, Lee VM, Holtzman DM, Hyman BT, Spires-Jones TL, 2012. Apolipoprote in E4 effects in Alzheimer’s disease are mediated by synaptotoxic oligomeric amyloid-β. Brain. 10.1093/brain/aws127 [DOI] [PMC free article] [PubMed] [Google Scholar]
- Lau C, Anitole K, Hodes C, Lai D, Pfahles-Hutchens A, Seed J, 2007. Perfluoroalkyl Acids: A Review of Monitoring and Toxicological Findings. Toxicol. Sci 99, 366–394. 10.1093/toxsci/kfm128 [DOI] [PubMed] [Google Scholar]
- Lau C, Butenhoff JL, Rogers JM, 2004. The developmental toxicity of perfluoroalkyl acids and their derivatives. Toxicol. Appl. Pharmacol 198, 231–241. 10.1016/j.taap.2003.11.031 [DOI] [PubMed] [Google Scholar]
- Lau C, Thibodeaux JR, Hanson RG, Narotsky MG, Rogers JM, Lindstrom AB, Strynar MJ, 2006. Effects of perfluorooctanoic acid exposure during pregnancy in the mouse. Toxicol. Sci 10.1093/toxsci/kfj105 [DOI] [PubMed] [Google Scholar]
- Lau C, Thibodeaux JR, Hanson RG, Rogers JM, Grey BE, Stanton ME, Buttenhoff JL, Stevenson LA, 2003. Exposure to perfluorooctane sulfonate during pregnancy in rat and mouse. II: Postnatal evaluation. Toxicol. Sci 10.1093/toxsci/kfgl22 [DOI] [PubMed] [Google Scholar]
- Liu CC, Kanekiyo T, Xu H, Bu G, 2013. Apolipoprotein e and Alzheimer disease: Risk, mechanisms and therapy. Nat. Rev. Neurol 10.1038/nrneurol.2012.263 [DOI] [PMC free article] [PubMed] [Google Scholar]
- Liu G, Dhana K, Furtado JD, Rood J, Zong G, Liang L, Qi L, Bray GA, DeJonge L, Coull B, Grandjean P, Sun Q, 2018. Perfluoroalkyl substances and changes in body weight and resting metabolic rate in response to weight-loss diets: A prospective study. PLOS Med. 15, e1002502. 10.1371/journal.pmed.1002502 [DOI] [PMC free article] [PubMed] [Google Scholar]
- Long Y, Wang Y, Ji G, Yan L, Hu F, Gu A, 2013. Neurotoxicity of Perfluorooctane Sulfonate to Hippocampal Cells in Adult Mice. PLoS One. 10.1371/journal.pone.0054176 [DOI] [PMC free article] [PubMed] [Google Scholar]
- Luebker DJ, Case MT, York RG, Moore JA, Hansen KJ, Butenhoff JL, 2005. Two-generation reproduction and cross-foster studies of perfluorooctanesulfonate (PFOS) in rats. Toxicology. 10.1016/j.tox.2005.07.018 [DOI] [PubMed] [Google Scholar]
- Maisonet M, Terrell ML, McGeehin MA, Christensen KY, Holmes A, Calafat AM, Marcus M, 2012. Maternal concentrations of polyfluoroalkyl compounds during pregnancy and fetal and postnatal growth in british girls. Environ. Health Perspect 120, 1–26. 10.1289/ehp.1003096 [DOI] [PMC free article] [PubMed] [Google Scholar]
- Manoharan S, Guillemin GJ, Abiramasundari RS, Essa MM, Akbar M, Akbar MD, 2016. The Role of Reactive Oxygen Species in the Pathogenesis of Alzheimer’s Disease, Parkinson’s Disease, and Huntington’s Disease: A Mini Review. Oxid. Med. Cell. Longev 10.1155/2016/8590578 [DOI] [PMC free article] [PubMed] [Google Scholar]
- Martin L, Latypova X, Wilson CM, Magnaudeix A, Perrin ML, Yardin C, Terro F, 2013. Tau protein kinases: Involvement in Alzheimer’s disease. Ageing Res. Rev 10.1016/j.arr.2012.06.003 [DOI] [PubMed] [Google Scholar]
- Mondal D, Lopez-Espinosa MJ, Armstrong B, Stein CR, Fletcher T, 2012. Relationships of perfluorooctanoate and perfluorooctane sulfonate serum concentrations between mother-child pairs in a population with perfluorooctanoate exposure from drinking water. Environ. Health Perspect 10.1289/ehp.1104538 [DOI] [PMC free article] [PubMed] [Google Scholar]
- Murphy MP, Levine H, 2010. Alzheimer’s disease and the amyloid-β peptide. J. Alzheimer’s Dis 10.3233/JAD-2010-1221 [DOI] [PMC free article] [PubMed] [Google Scholar]
- Olsen GW, Burris JM, Ehresman DJ, Froelich JW, Seacat AM, Butenhoff JL, Zobel LR, 2007. Half-life of serum elimination of perfluorooctane sulfonate, perfluorohexanesulfonate, and perfluorooctanoate in retired fluorochemical production workers. Environ. Health Perspect 10.1289/ehp.10009 [DOI] [PMC free article] [PubMed] [Google Scholar]
- Pfrieger FW, 2003. Cholesterol homeostasis and function in neurons of the central nervous system. Cell. Mol. Life Sci 10.1007/s00018-003-3018-7 [DOI] [PMC free article] [PubMed] [Google Scholar]
- Salehi A, Delcroix JD, Mobley WC, 2003. Traffic at the intersection of neurotrophic factor signaling and neurodegeneration. Trends Neurosci. 10.1016/S0166-2236(02)00038-3 [DOI] [PubMed] [Google Scholar]
- Sun P, Gu L, Luo J, Qin Y, Sun L, Jiang S, 2019. ROS-mediated JNK pathway critically contributes to PFOS-triggered apoptosis in SH-SY5Y cells. Neurotoxicol. Teratol 10.1016/j.ntt.2019.106821 [DOI] [PubMed] [Google Scholar]
- Tai LM, Bilousova T, Jungbauer L, Roeske SK, Youmans KL, Yu C, Poon WW, Cornwell LB, Miller CA, Vinters HV, Van Eldik LJ, Fardo DW, Estus S, Bu G, Gylys KH, Ladu MJ, 2013. Levels of soluble apolipoprotein E/amyloid-beta (Abeta) complex are reduced and oligomeric Abeta increased with APOE4 and Alzheimer disease in a transgenic mouse model and human samples. J Biol Chem 288, 5914–5926. 10.1074/jbc.M112.442103 [DOI] [PMC free article] [PubMed] [Google Scholar]
- Verghese PB, Castellano JM, Holtzman DM, 2011. Apolipoprote in E in Alzheimer’s disease and other neurological disorders. Lancet Neurol. 10.1016/S1474-4422(10)70325-2 [DOI] [PMC free article] [PubMed] [Google Scholar]
- Wan HT, Zhao YG, Leung PY, Wong CKC, 2014. Perinatal Exposure to Perfluorooctane Sulfonate Affects Glucose Metabolism in Adult Offspring. PLoS One 9, e87137. 10.1371/journal.pone.0087137 [DOI] [PMC free article] [PubMed] [Google Scholar]
- Wang Y, Liu W, Zhang Q, Zhao H, Quan X, 2015. Effects of developmental perfluorooctane sulfonate exposure on spatial learning and memory ability of rats and mechanism associated with synaptic plasticity. Food Chem. Toxicol 10.1016/j.fct.2014.12.008 [DOI] [PubMed] [Google Scholar]
- Wang Y, Wang L, Chang W, Zhang Yinfeng, Zhang Yuan, Liu W, 2019. Neurotoxic effects of perfluoroalkyl acids: Neurobehavioral deficit and its molecular mechanism. Toxicol. Lett 10.1016/j.toxlet.2019.01.012 [DOI] [PubMed] [Google Scholar]
- Winkens K, Koponen J, Schuster J, Shoeib M, Vestergren R, Berger U, Karvonen AM, Pekkanen J, Kiviranta H, Cousins IT, 2017. Perfluoroalkyl acids and their precursors in indoor air sampled in children’s bedrooms. Env. Pollut 222, 423–432. 10.1016/j.envpol.2016.12.010 [DOI] [PubMed] [Google Scholar]
- Zannis VI, Breslow JL, Utermann G, Mahley RW, Weisgraber KH, Havel RJ, Goldstein JL, Brown MS, Schonfeld G, Hazzard WR, Blum C, 1982. Proposed nomenclature of apoE isoproteins, apoE genotypes, and phenotypes. J. Lipid Res 10.1016/S0022-2275(20)38094-9 [DOI] [PubMed] [Google Scholar]
- Zeng H. cai, Zhang L, Li Y. yuan, Wang Y. jian, Xia W, Lin Y, Wei J, Xu S. qing, 2011. Inflammation-like glial response in rat brain induced by prenatal PFOS exposure. Neurotoxicology 32, 130–139. 10.1016/j.neuro.2010.10.001 [DOI] [PubMed] [Google Scholar]
- Zhang Q, Zhao H, Liu W, Zhang Z, Qin H, Luo F, Leng S, 2016. Developmental perfluorooctane sulfonate exposure results in tau hyperphosphorylation and β-amyloid aggregation in adults rats: Incidence for link to Alzheimer’s disease. Toxicology 347–349, 40–46. 10.1016/j.tox.2016.03.003 [DOI] [PubMed] [Google Scholar]


