
Figure 11. GSK3β, CDK5 mRNA, and protein levels in differentiated SH-SY5Y cells after PFOS exposure (kinase pathway).
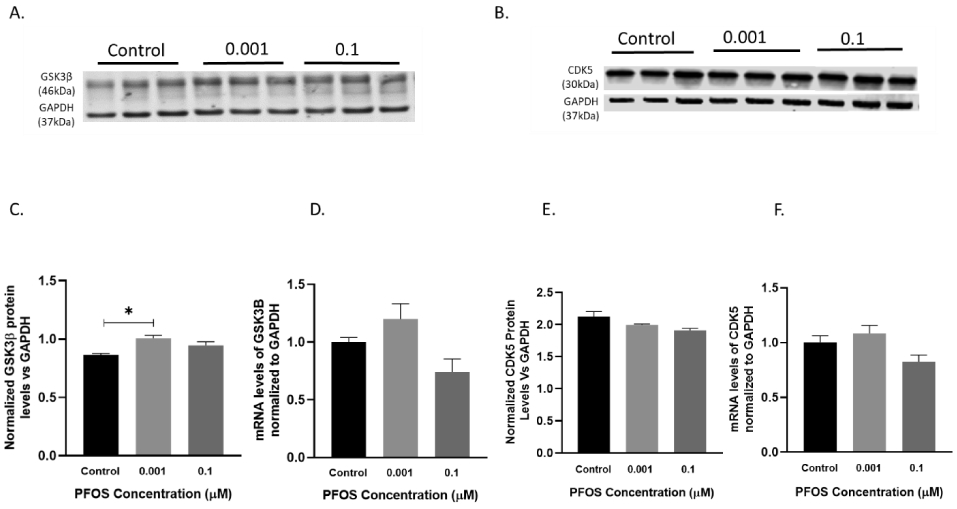
Differentiated SH-SY5Y cells exposed to PFOS at 0.001 and 0.1 μM concentrations for 24 h. (A, C) Blots and quantification of GSK3β protein levels normalized to GAPDH. (D) GSK3β mRNA levels. (B, E) Blots and quantification of CDK5 protein levels normalized to GAPDH. (F) CDK5 mRNA levels. Results are expressed as mean ± S.E.M using the one-way ANOVA followed by Dunnett’s for multiple comparisons, n=3 per treatment group (*P<0.05, **P< 0.01).