Abstract
The extracellular signal-regulated kinases ERK1 and ERK2 represent the foremost mitogenic pathway in mammalian cells, and their dysregulation drives tumorigenesis and confers therapeutic resistance. ERK1/2 are known to be activated by MAPK/ERK kinase (MEK)-mediated phosphorylation. Here we show that ERK1/2 are also modified by Lys63-linked polyubiquitin chains. We identify the tripartite motif-containing protein TRIM15 as a ubiquitin ligase, and the tumor suppressor CYLD as a deubiquitinase, for ERKs. TRIM15 and CYLD regulate ERK ubiquitination at defined lysine residues via mutually exclusive interactions as well as opposing activities. K63-linked polyubiquitination enhances ERK interaction with and activation by MEK. Down-regulation of TRIM15 inhibits growth of both drug-responsive and -resistant melanomas. Moreover, high TRIM15 expression and low CYLD expression are associated with poor prognosis of melanoma patients. These findings define a role of Lys63-linked polyubiquitination in the ERK signaling pathway and suggest a potential target for cancer therapy.
Introduction
The extracellular signal-regulated kinases ERK1 and ERK2, which share high structural and functional similarity, are prototypes of the evolutionarily conserved mitogen-activated protein kinases (MAPKs)1. ERK1/2 are the downstream effectors of a kinase cascade that also includes the RAF-family serine/threonine kinases and the dual-specificity MAPK/ERK kinases MEK1 and MEK2, which becomes activated in response to growth factors and mitogens2, 3. Upon activation, ERK1/2 phosphorylate a plethora of cytosolic and nuclear substrates to elicit fundamental responses including cell growth, proliferation, survival, migration, and differentiation. A hyperactive ERK pathway is prevalent in human tumors due to frequent mutations and/or overexpression of the upstream signaling components including receptor tyrosine kinases, the Ras GTPase, and RAFs4. Reactivation of ERK1/2 is also a common mechanism that confers resistance to drugs that inhibit these oncogenic components including mutant BRAF5–7, underscoring the importance of ERKs themselves as therapeutic targets8, 9.
Nevertheless, the mechanisms that govern ERK activation are not fully defined. MAPK cascades represent a paradigm for phosphorylation-mediated signal transduction2, 3, and it is unclear what other forms of posttranslational modification can also directly regulate the activation of ERKs or any other MAPKs. Moreover, MAPK cascades have evolved high specificity with the substrates for the upstream kinases being largely limited to the kinases next in the cascade, which ensures that each MAPK cascade responds to an exclusive set of extracellular stimuli1. ERK1 and ERK2 are the only known substrates of the dual-specificity kinases MEK1/2, and they are activated by phosphorylation at the Thr and Tyr residues of the activation loop. However, what facilitates the highly effective and specific signal transmission from MEK to ERK remains undefined.
Ubiquitination regulates protein function as well as stability10. Especially, conjugation to Lysine-63 (K63)-linked ubiquitin polymers is involved in the activation of kinases in NF-κB and Akt signaling pathways11–14. Here, we find that ERK1 and ERK2 are modified by K63-linked polyubiquitin chains, correlating with their activation. We identify a ubiquitin ligase and a deubiquitinating enzyme (DUB) for ERK1/2, and investigate the role of this non-degradative form of ubiquitination in ERK activation and the growth of both drug-responsive and -resistant melanomas.
RESULTS
ERK1/2 are conjugated to K63-linked polyubiquitin chains
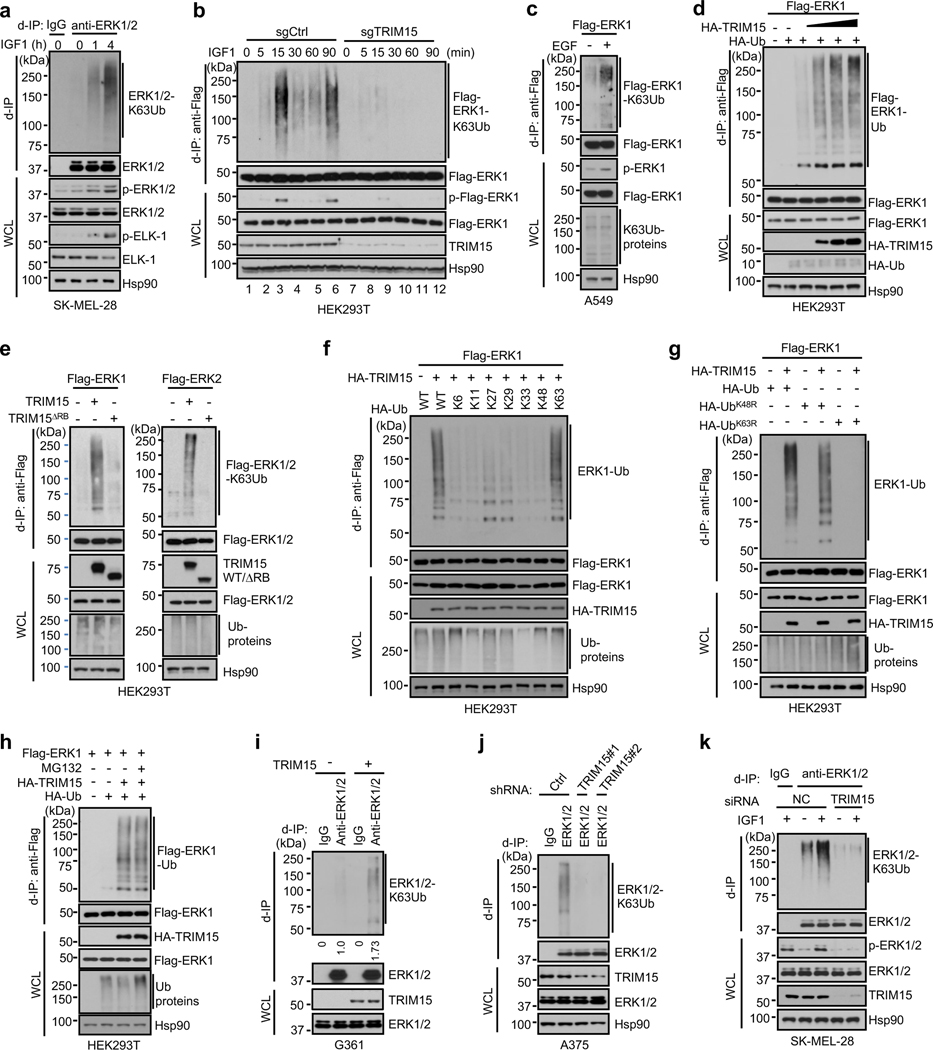
To investigate a potential role of K63 ubiquitination in ERK1/2 activation, we treated human melanoma SK-MEL-28 cells with insulin-like growth factor 1 (IGF1). Endogenous ERK1/2 were activated upon IGF1 stimulation, as shown by phosphorylation of the ERK activation loop and the ERK substrate ELK-1 (Fig. 1a). Interestingly, K63 ubiquitin-conjugated ERK1/2 proteins, which were low in unstimulated cells, increased over time and eventually reached high levels (Fig. 1a). Similarly, when HEK293T cells expressing Flag-ERK1 were treated with IGF1, K63 ubiquitinated Flag-ERK1 increased in an oscillating pattern, in parallel with its activation (Fig. 1b, lanes 1–6). Moreover, when lung cancer A549 cells expressing Flag-ERK1 were treated with epidermal growth factor (EGF), Flag-ERK1 was heavily modified by K63 ubiquitin chains as it became activated (Fig. 1c).
Fig. 1 |. K63 ubiquitination of ERK1/2 and identification of TRIM15 as a ubiquitin ligase.
a, b, K63-ubiquitination of ERK1/2 and Flag-ERK1 correlates with their activation following IGF1 stimulation. Serum-starved SK-MEL-28 cells (a), or control and TRIM15-knockout HEK293T expressing Flag-ERK1 (b), were treated with or without IGF1 (100 ng/ml IGF1) as indicated. Cell lysates were made in SDS-containing buffer, diluted, and immunoprecipitated with control IgG, anti-ERK1/2 antibody (a), or anti-Flag antibody (b) (d-IP). d-IP samples and whole cell lysates (WCL) were analyzed by Western blot.
c, K63-ubiquitination of Flag-ERK1 correlates with its activation following EGF stimulation. A549 cells transfected with Flag-ERK1 were serum-starved and treated with or without EGF (50 ng/ml) for 4 h. Cell lysates were subjected to d-IP with anti-Flag antibody. d-IP samples and whole cell lysates (WCL) were analyzed by Western blot.
d, e, TRIM15 mediates ERK1/2 ubiquitination. HEK293T cells were transfected with Flag-ERK1, HA-Ub, and increasing amounts of HA-TRIM15 as indicated (d), or with Flag-ERK1, Flag-ERK2, TRIM15-YFP, or TRIM15ΔRB-YFP, together with HA-Ub together (e). d-IP samples and WCL were analyzed by Western blot.
f, g, TRIM15 is a K63-linkage specific ubiquitin ligase for ERK1/2. HEK293T cells were transfected with Flag-ERK1, HA-TRIM15, and wild-type (WT) or mutant ubiquitin as indicated. d-IP samples and WCL were analyzed by Western blot.
h, Proteasome blockage does not alter ERK1 ubiquitination or abundance. HEK293T cells were transfected with Flag-ERK1, HA-TRIM15, and ubiquitin and treated with MG132 (10 μM) as indicated. d-IP samples and WCL were analyzed by Western blot.
i-k, TRIM15 promotes ubiquitination of endogenous ERK1/2. G361 cells transfected with control or TRIM15 expression plasmid (i), A375 cells transduced with control (Ctrl) or TRIM15 shRNA lentiviral vector (j), and SK-MEL-28 cells transfected with negative control (NC) or TRIM15 siRNA and treated with or without IGF1 (100 ng/ml) for 16 h (k) were analyzed for ERK1/2 ubiquitination (i-k) and phosphorylation (k).
Assays in panels a-k have been performed two times with similar results.
TRIM15 is a K63-specific ubiquitin ligase for ERK1/2
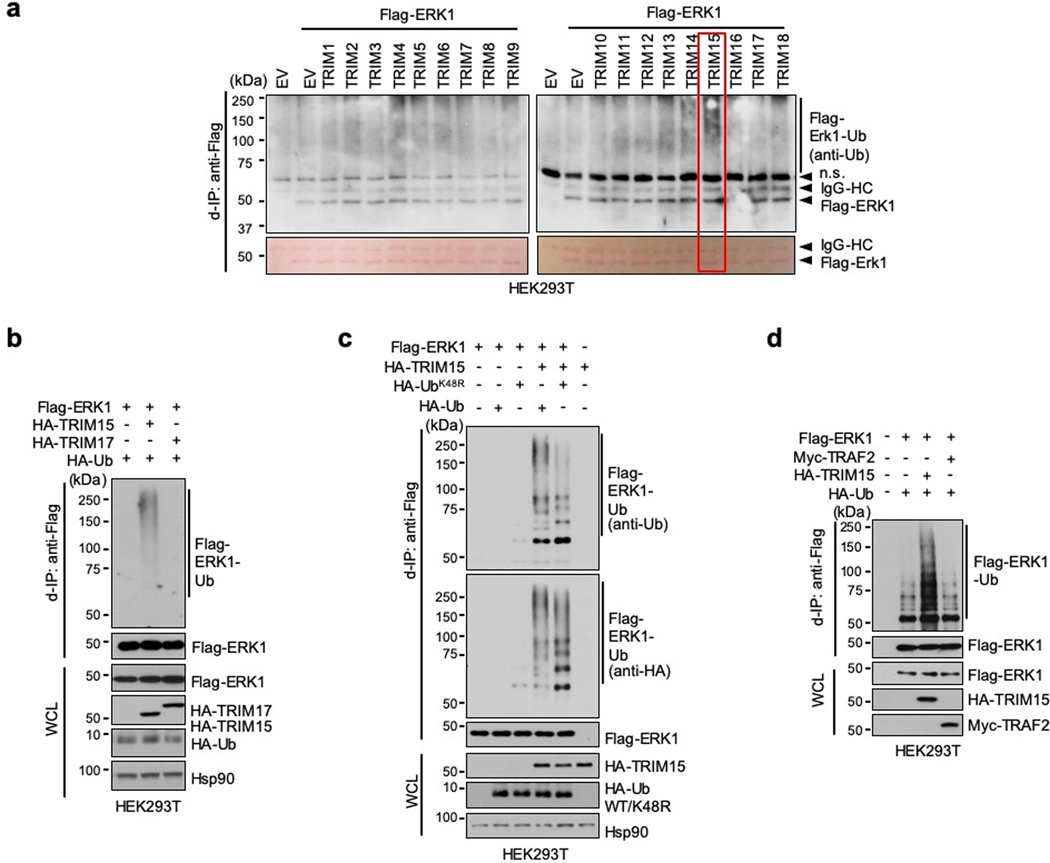
The close correlation between K63 ubiquitination and activation of ERK1/2 prompted us to identify the ubiquitin ligase responsible for this modification. The human genome encodes over 600 ubiquitin ligases15–17. A subgroup of these ligases includes over 70 tripartite motif (TRIM) proteins, which are defined by a TRIM/RBCC motif consisting of a RING domain, one or two B-boxes, and a predicted coiled-coil region18, 19. TRIMs are involved in a plethora of cellular processes including anti-viral responses, tumorigenesis18, 19, and protein quality control20–24. Moreover, at least four TRIMs (TRIM5, −8, −21, and −25) can mediate K63 ubiquitination of their target proteins25–28. Therefore, we screened TRIM proteins for their ability to ubiquitinate ERK1/2. When the first eighteen human TRIMs were expressed individually with Flag-ERK1 in HEK293T cells, TRIM15, but not the other TRIMs, strongly promoted ERK1 ubiquitination (Extended Data Fig. 1a,b). This effect of TRIM15 was dose dependent (Fig. 1d) and involved K63-linked ubiquitin chains (Fig. 1e). Similarly, TRIM15 promoted K63 ubiquitination of Flag-ERK2 (Fig. 1e). In contrast, a TRIM15 mutant lacking the RING and B-Box domains (TRIM15ΔRB) was unable to ubiquitinate ERK1 or ERK2 (Fig. 1e).
Polyubiquitination can occur via seven different Lys resides on ubiquitin15–17. To ascertain that TRIM15 promotes K63 ubiquitination of ERK1/2, we used a panel of ubiquitin mutants in which one Lys residue was retained while the rest being replaced with Arg, and observed that K63 ubiquitin, but not the other mutants, supported TRIM15-mediated ERK1 modification (Fig. 1f). Complementarily, we used a ubiquitin mutant in which K63 and, as a control, K48, were replaced with Arg (K63R and K48R, respectively). K63R ubiquitin was unable to support ERK1 modification, whereas K48R ubiquitin, which blocks the ubiquitin linkage that primarily targets proteins for proteasomal degradation, was able to (Fig. 1g and Extended Data Fig. 1c). Consistently, treatment with the proteasome inhibitor MG132, while increasing total ubiquitinated proteins in the cell, did not alter ERK1 ubiquitination or abundance (Fig. 1h). Therefore, TRIM15 mediates the non-degradative, K63 ubiquitination of ERK1/2. The activity of TRIM15 appears to be specific, as another K63 ubiquitin ligase, TRAF2, failed to ubiquitinate ERK1 (Extended Data Fig. 1d).
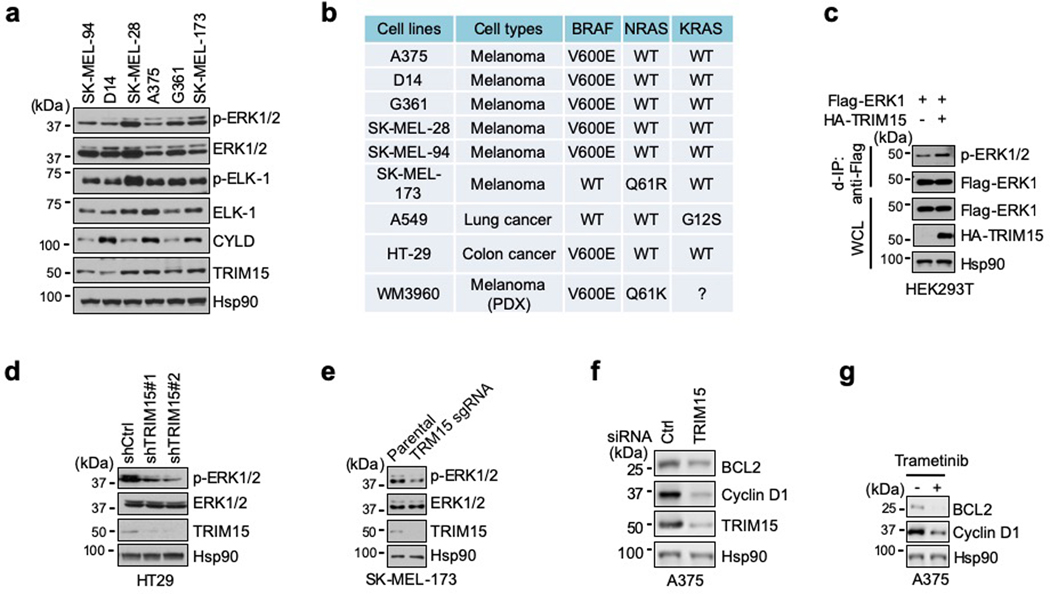
TRIM15 is expressed in melanoma cell lines at different levels (Extended Data Fig. 2a,b). To evaluate the effect of TRIM15 on endogenous ERK1/2, we forced its expression in G361 cells where TRIM15 levels were relatively low. This resulted in a noticeable increase in K63 ubiquitination of endogenous ERK1/2 (Fig. 1i). Conversely, when TRIM15 was knocked down using independent short hairpin RNAs (shRNAs) in A375 cells where TRIM15 levels were relatively high, K63 ubiquitination of ERK1/2 markedly declined (Fig. 1j). Similarly, knocking down TRIM15 in SK-MEL-28 cells not only strongly reduced basal levels of K63-ubiquitinated ERK1/2 under unstimulated conditions, but also near-completely prevented their increase under IGF1-stimulated conditions (Fig. 1k). Moreover, knocking out TRIM15 in HEK293T cells by means of CRISPR/Cas9-mediated gene editing near-completely abrogated the increase in K63 ubiquitination of Flag-ERK1 following IGF1 stimulation (Fig. 1b, lanes 7–12). Therefore, TRIM15 is critical for K63 ubiquitination of ERK1/2 in both unstimulated and mitogen-stimulated cells.
TRIM15 promotes ERK1/2 activation
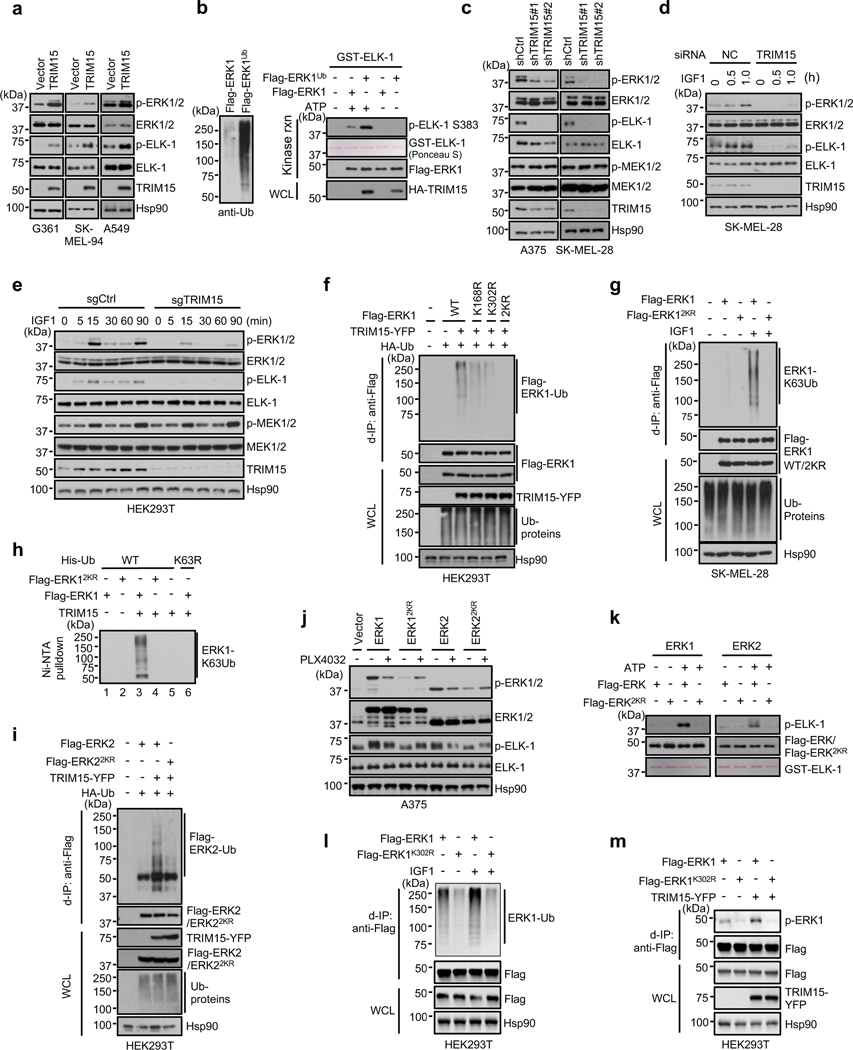
Forced TRIM15 expression also accentuated ERK1/2 activation. This was observed for endogenous ERK1/2 in G361, SK-MEL-94, and lung cancer A549 cells (Fig. 2a), as well as for Flag-ERK1 in HEK293T cells (Extended Data Fig. 2c). A comparison of recombinant Flag-ERK1 proteins purified from HEK293T cells where it was expressed alone and hence minimally ubiquitinated (referred to as Flag-ERK1), or together with TRIM15 and hence substantially ubiquitinate (referred to as Flag-ERK1Ub), confirmed that the latter possessed higher kinase activity (Fig. 2b).
Fig. 2 |. TRIM15 activates ERK1/2 by conjugating K63 ubiquitin to specific Lys residues.
a,c-e, TRIM15 promotes ERK1/2 activation. G361, SK-MEL-94, and A549 cells transduced with control or TRIM15 lentiviral vectors (a), A375 and SK-MEL-28 cells stably expressing control shRNA, TRIM15 shRNA #1, or TRIM15 shRNA #2 (c), SK-MEL-28 cells transfected with control (NC) or TRIM15 siRNA (d), and HEK293T cells stably expressing control or TRIM15 sgRNA cells (e) were untreated (a, c) or serum-starved and treated with IGF1 (100 ng/ml) as indicated (d, e). Cells were analyzed for ERK and MEK activation, ELK-1 phosphorylation, and protein expression.
b, Ubiquitination enhances ERK1 kinase activity. Left: levels of ubiquitination of purified Flag-ERK1 and Flag-ERK1Ub. Right: In vitro kinase assay using a GST fusion of ELK-1 (307 −428) (GST-ELK-1) as the substrate. The kinase reaction (rnx) and WCL were analyzed by Western blot and/or Ponceau S staining.
f,g,i, TRIM15 ubiquitinates ERK1/2 at specific Lys residues. HEK293T cells were transfected TRIM15-YFP, HA-Ub, together with wild-type (WT) or mutant Flag-ERK1 (f) or Flag-ERK2 (i). SK-MEL-28 cells stably expressing Flag-ERK1 or Flag-ERK12KR were serum-starved and stimulated with or without IGF1 for 20 h (g). Cells were analyzed for Flag-ERK1/2 ubiquitination, protein expression, and total ubiquitinated proteins (Ub-proteins).
h, In vitro ubiquitination assay using the indicated recombinant proteins in the presence of E1, E2, and ATP. The reaction mixtures were incubated with Ni-NTA beads and the precipitated proteins were analyzed by Western blot using anti-ERK1/2 antibody.
j, ERK1/22KR are unresponsive to BRAF inhibitor in cells. A375 cells expressing the indicated ERK proteins were treated with or without PLX4032 (2 μM) for 24 h. ERK activation was analyzed by Western blot.
k, ERK1/22KR are inactive. In vitro kinase assay was performed using indicated ERK proteins and GST-ELK-1, in the presence or absence of ATP.
l, K302 is the main ubiquitination site on ERK1. Ubiquitination of Flag-ERK1 and Flag-ERK1K302R in HEK293T cells that were serum-starved and treated with or without IGF1 (100 ng/ml).
m, Activation of ERK1 and ERK1K302R in HEK293T cells in the presence or absence of TRIM15-YFP. Assays in panels a-m have been performed two times with similar results.
Conversely, knocking down or knocking out TRIM15 decreased basal activity of endogenous ERK1/2 in SK-MEL-28, A375, SK-MEL-173, and colon cancer HT29 cells (Fig. 2c,d and Extended Data Fig. 2d,e). It also effectively abolished the increase in ERK activity in IGF1-stimulated SK-MEL-28 cells (Fig. 2d). Likewise, knocking out TRIM15 prevented the increase in endogenous ERK1/2 and Flag-ERK1 activity in IGF1-stimulated HEK293T cells (Fig. 1b, 2e). Knocking down TRIM15 also reduced expression of ERK-regulated proteins cyclin D1 and BCL229–31, similar to the treatment of the MEK inhibitor trametinib (GSK1120212) (Extended Data Fig. 2f,g). However, TRIM15 knockdown or knockout did not alter the activation of MEK1/2 (Fig. 2c,e). These results indicate that TRIM15 regulates the ERK signaling pathway at the level of ERK1/2 activation.
TRIM15 activates ERK1/2 by K63 ubiquitination
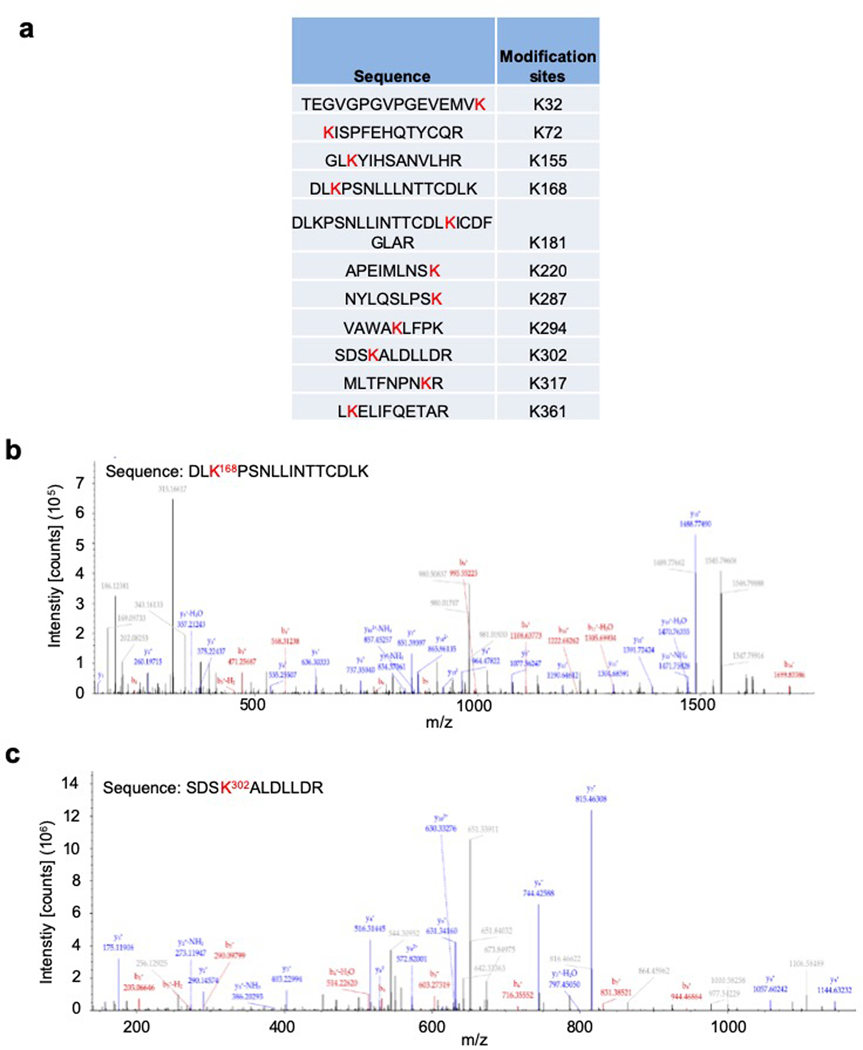
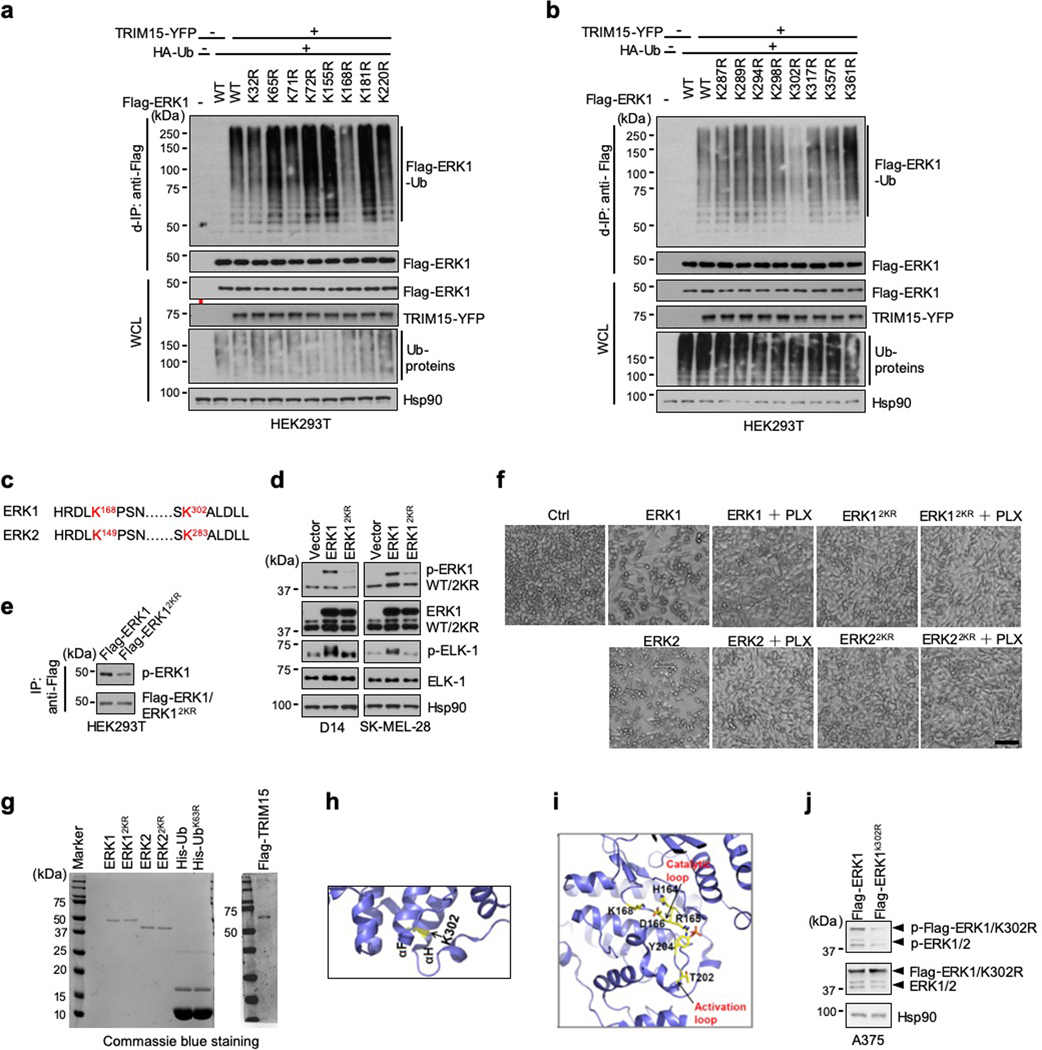
To ascertain that TRIM15 activates ERK1/2 by ubiquitination, we determined the ubiquitination site(s) on these MAPKs. An analysis of purified Flag-ERK1Ub protein by mass spectrometry revealed that at least eleven Lys residues of ERK1 might be conjugated to ubiquitin (Extended Data Fig. 3). We mutated all the eleven, as well as six additional, Lys residues to Arg. Two mutations (K168R and K302R) displayed a marked reduction in TRIM15-mediated ubiquitination (Fig. 2f and Extended Data Fig. 4a,b). The combined mutation, K168R/K302R or 2KR, exhibited virtually no ubiquitination in unstimulated or IGF1-stimulated cells (Fig. 2f,g). In vitro, TRIM15 promoted K63 ubiquitination of ERK1, but not ERK12KR (Fig. 2h). Thus, TRIM15 ubiquitinates ERK1 mainly at K168 and K302 residues.
An alignment of amino acid sequences revealed that K168 and K302 are conserved in ERK2, corresponding to K149 and K283, respectively (Extended Data Fig. 4c). An ERK2 mutation in which K149 and K283 were replaced with Arg (K149R/R283R or 2KR) could not be ubiquitinated by TRIM15 (Fig. 2i). Thus, TRIM15 ubiquitinates ERK2 mainly at K149 and K283 residues.
Compared to their wild-type counterparts, ERK12KR and ERK22KR exhibited substantially weaker kinase activity in A375, D14, SK-MEL-28, and HEK293T cells (Fig. 2j and Extended Data Fig. 4d,e). Treatment of A375 cells, which harbor the oncogenic BRAFV600E allele, with the BRAF inhibitor PLX4032 (Vemurafenib)32 suppressed the activity of ERK1/2, but not ERK1/22KR (Fig. 2j), indicating that ERK12KR and ERK22KR are nonresponsive to the mitogenic signals emanating from BRAFV600E. Forced expression of ERK1 or ERK2 can reduce cell viability in a kinase activity-dependent manner33, but ERK12KR or ERK22KR elicited no cytotoxic effect in A375 cells (Extended Data Fig. 4f). Also, recombinant ERK12KR and ERK22KR proteins purified from HEK293T cells displayed virtually no kinase activity towards ELK-1 (Fig. 2k and Extended Data Fig. 4g).
Ubiquitination at K302 appeared to be more abundant than that at K168 (Extended Data Fig. 3). K302 residue is accessible on the surface of ERK1, whereas K168 belongs to the catalytic loop (164HRDLK168) (Extended Data Fig. 4h,i), whose attachment to a poly-ubiquitin chain might create a local steric hindrance that impedes, rather than increases, ERK1 kinase activity. Thus, we tested the possibility that ubiquitination at K302 is the main activating event. When introduced into HEK293T cells, ERK1K302R, like ERK12KR, displayed substantially lower ubiquitination than ERK1, which was not increased upon IGF1 stimulation (Fig. 2l). ERK1K302R also displayed reduced phosphorylation at the activation loop (Fig. 2m and Extended Data Fig. 4j), which was not increased by co-expression with TRIM15 (Fig. 2m). Collectively, these results indicate that TRIM15 activates ERK1/2 by conjugating K63 ubiquitin chains to specific Lys residues, particularly K302 on ERK1 and the corresponding K283 on ERK2.
TRIM15 interacts with ERK1/2 via conserved domains
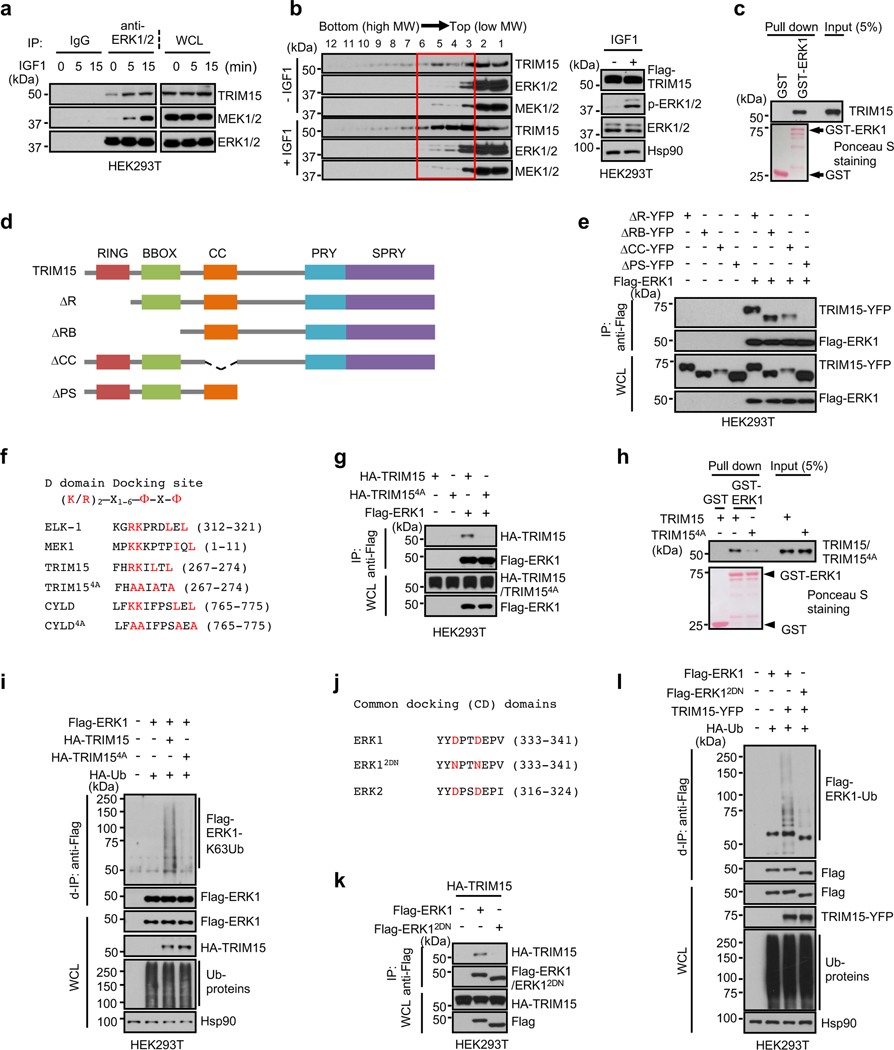
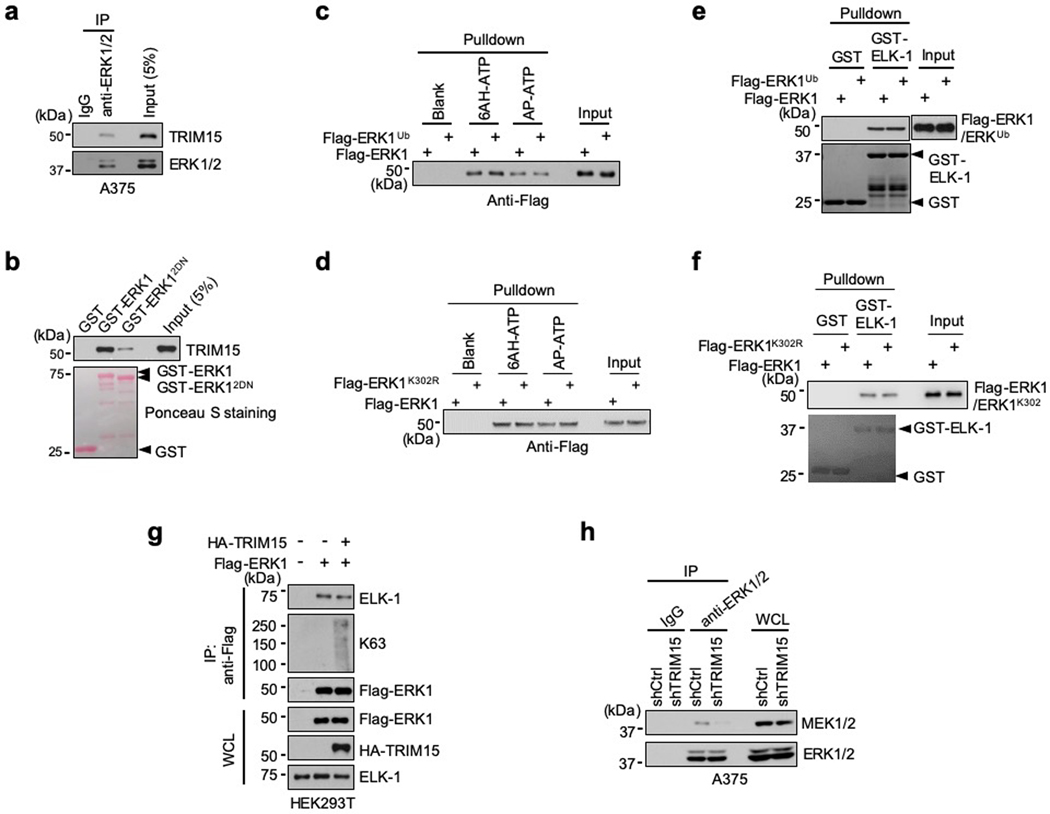
MAPKs often stably interact with their regulators/substrates via the common docking (CD) domain on MAPKs and the D domain-docking site on the regulators/substrates34–36. We observed interaction between endogenous TRIM15 and ERK1/2 in A375 and HEK293T cells (Fig. 3a and Extended Data Fig. 5a). Upon IGF1 treatment, the TRIM15-ERK1/2 interaction was strengthened (Fig. 3a), as these proteins were incorporated into large complexes (Fig. 3b). In vitro, purified Flag-TRIM15 bound to a glutathione S-transferase (GST) fusion of ERK1, but not GST (Fig. 3c), indicating that TRIM15 may directly binds to ERKs.
Fig. 3 |. TRIM15 interacts with ERK1/2 via conserved domains.
a, Interaction of ERK1/2 with TRIM15 and MEK1/2 in cells. Serum-starved HEK293T cells were treated with IGF1 for the indicated times. Cell lysates were immunoprecipitated with control IgG or anti-ERK1/2 antibody. Immunoprecipitates and WCL were analyzed by Western blot.
b, HEK293T cells transfected with Flag-TRIM15 were serum-starved and treated with or without IGF1 for 15 min. Cell lysates were centrifugated in sucrose gradient. Fractions (left) and unfractionated cell lysates (right) were analyzed by Western blot.
c, h, TRIM15-ERK1 interaction in vitro and its dependence on TRIM15 D-domain docking site. Purified Flag-TRIM15 (c,h) or Flag-TRIM154A (h) was incubated with GST or GST-ERK1 conjugated on beads. Pulldown samples and 5% of input were analyzed by Western blot and Ponceau S staining.
d, Schematic illustration of the full length TRIM15 and its deletion mutations.
e, The TRIM15 PRY-SPRY region is required for interaction with ERK1. Cell lysates derived from HEK293T cells transfected with the indicated Flag-ERK1 protein were analyzed by co-IP assay with anti-Flag mAb (M2) beads, followed by immunoblot.
f, The D domain-docking sites in ELK-1 and MEK1 and putative D domain-docking sites in TRIM15 and CYLD, with conserved residues indicated in red color. In TRIM154A and CYLD4A, four conserved residues were replaced with Ala. Amino acid numbers are indicated.
g, k, HEK293T cells were transfected with the indicated Flag-ERK1 and HA-TRIM15 plasmids. Anti-Flag immunoprecipitates and WCL were analyzed by Western blot.
i, l, TRIM15-mediated ERK1 ubiquitination is dependent on their stable interaction via conserved domains. HEK293T cells transfected with Flag-ERK1 together with HA-TRIM15 or HA-TRIM154A (i), or with TRIM15-YFP together with Flag-ERK1 or Flag-ERK12DN (l), were analyzed for ERK1 ubiquitination, total ubiquitinated proteins, and protein expression by d-IP and Western blot.
j, Common docking (CD) domains in ERK1 and ERK2. In ERK12DN, the two conserved Asp residues were replaced with Asn.
Assays in panels a-c, e, g-i, k and l have been performed two times with similar results.
To delineate structural determinants of the TRIM15-ERK interaction, we generated a panel of TRIM15 deletion mutations that lacked one or more domains within the N-terminal TRIM/RBCC motif (ΔR, ΔRB, and ΔCC) or the C-terminal PRY-SPRY region (ΔPS) (Fig. 3d). TRIM15ΔR, TRIM15ΔRB, and TRIM15ΔCC retained the ability to interact with ERK1 (Fig. 3e), while TRIM15ΔPS lost this ability, suggesting that the PRY-SPRY region is involved in the binding to ERKs.
We identified a potential D domain-docking site within the TRIM15 PRY-SPRY region (Fig. 3f). A TRIM15 mutant in which four conserved residues within this site were placed with Ala (4A, Fig. 3f) failed to bind to and ubiquitinate ERK1 (Fig. 3g–i). Moreover, a mutant ERK1 in which two conserved Asp residues with the CD domain were changed to Asn (D335N/D338N or 2DN; Fig. 3j) showed minimal or no binding to, and ubiquitination by, TRIM15 (Fig. 3k,l and Extended Data Fig. 5b). Thus, the D domain-docking site of TRIM15 likely anchors on the CD domain of ERK1/2, enabling TRIM15 to deliver ubiquitin molecules onto ERK1/2.
TRIM15 promotes ERK1/2 interaction with and activation by MEK
The K302 residue is within the αH-helix, which is adjacent to the αF-helix that functions as a central scaffold for the entire structure of ERK1 (Extended Data Fig. 4h)37–39. K63 ubiquitination at this and the corresponding residue in ERK2 might alter the conformation of ERKs, increasing their interactions with ATP, substrates, and/or activators. However, recombinant Flag-ERK1, Flag-ERK1Ub, and Flag-ERK1K302R proteins purified from mammalian cells, although differently ubiquitinated, bound to ATP (Extended Data Fig. 5c,d) or ELK-1 (Extended Data Fig. 5e,f) to a comparable extent. Moreover, overexpression of TRIM15 did not enhance the interaction of ERK1 with ELK-1 in cells (Extended Data Fig. 5g).
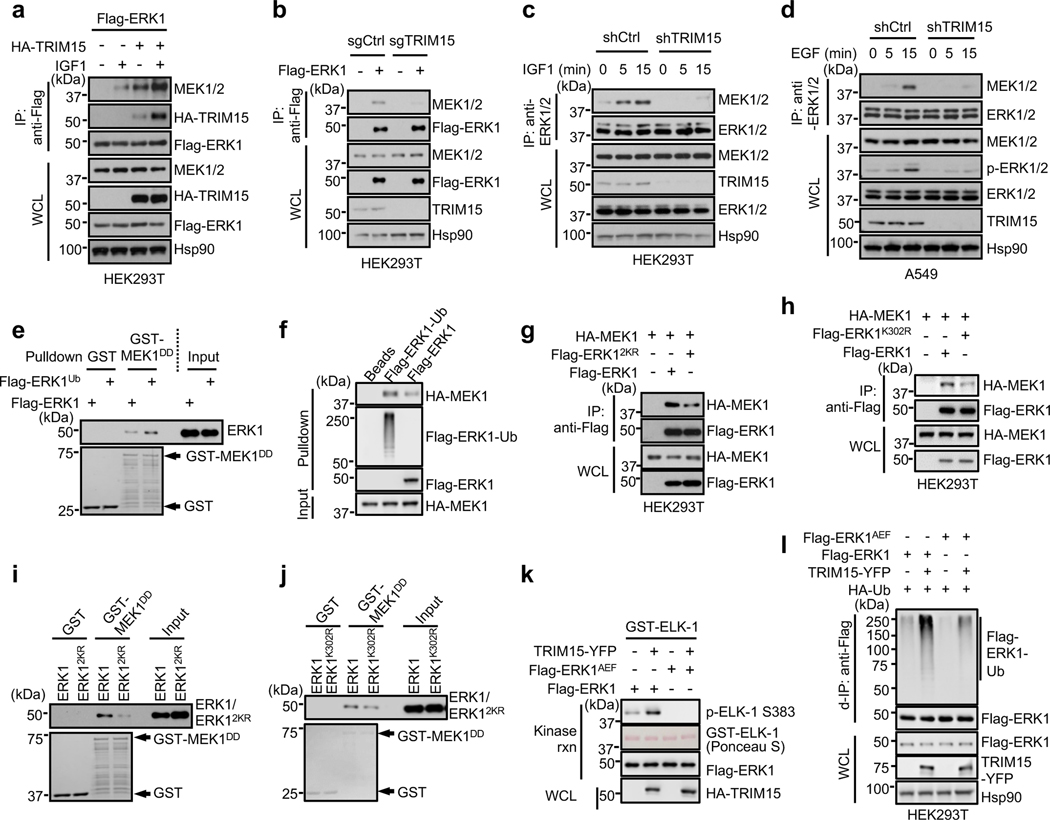
Of note, upon mitogenic stimulation, the ERK-MEK interaction increased following the increase in the TRIM15-ERK interaction (Fig. 3a). Thus, we examined whether TRIM15 promotes the ERK-MEK interaction. Forced TRIM15 expression augmented the interaction of Flag-ERK1 with endogenous MEK1/2 in unstimulated and IGF1-stimulated HEK293T cells (Fig. 4a). Conversely, TRIM15 knockout diminished the interaction of Flag-ERK1 with endogenous MEK1/2 in unstimulated HEK293T cells (Fig. 4b). TRIM15 knockdown also reduced endogenous ERK-MEK interaction in unstimulated HEK293T, A549, and A375 cells and prevented its increase in IGF1- or EGF-stimulated cells (Fig. 4c,d and Extended Data Fig. 5h). Thus, TRIM15 promotes the interaction of ERKs with MEKs.
Fig. 4 |. TRIM15-mediated ubiquitination promotes ERK interaction with and activation by MEK.
a, Overexpression of TRIM15 increases ERK-MEK interaction. HEK293 cells transfected with Flag-ERK1 alone or together with HA-TRIM15 were serum-starved and stimulated with or without IGF1. Interactions of Flag-ERK1 with HA-TRIM15 and MEK1/2 were analyzed by co-IP assay.
b, Knockout of TRIM15 impairs ERK-MEK interaction. HEK293T expressing control or TRIM15 sgRNA were transfected with Flag-ERK1. The interaction of Flag-ERK1 with MEK1/2 were analyzed by co-IP assay.
c, d, Knockdown of TRIM15 prevents the increase in the ERK-MEK association in mitogen-stimulated cells. HEK293T cells (c) or A549 (d) cells stably expressing shCtrl or shTRIM15 were serum-starved and stimulated with IGF1 (c) or EGF (d) for the indicate times. Interaction between ERK and MEK was examined by co-IP assay.
e, f, Ubiquitination of ERK1 increases its interaction with MEK. Flag- ERK1 and Flag-ERK1Ub were incubated with GST or GST-MEK1DD conjugated on beads (e), or HA-MEK1 was incubated with Flag-ERK1-Ub and Flag-ERK1 conjugated on beads (f). The input and pulldown samples were analyzed by Western blot. The amount of Flag-ERK1-Ub was estimated after treatment with CYLD to remove the ubiquitin chains (see below).
g, h, ERK12KR and ERK1K302R showed diminished interaction with MEK1 in cells. HEK293T cells were transfected with the indicated Flag-ERK1 and HA-MEK1 plasmids. The ERK-MEK interaction was examined by co-IP assay.
i, j, ERK12KR and ERK1K302R showed diminished interaction with MEK1 in vitro. Flag-ERK1 (i, j), Flag-ERK12KR (i), and ERK1K302R (j) were incubated with immobilized GST or GST-MEK1DD. The pulldown and input samples by Western blot and Ponceau S (i) or Coomassie blue (j) staining.
k, TRIM15 cannot activate ERK1AEF. Flag-ERK1 and Flag-ERK1AEF purified from HEK293T cells where they were expressed alone or together with TRIM15 were assayed for kinase activity.
l, TRIM15 still increases ERK1AEF ubiquitination. HEK293T cells were transfected with Flag-ERK1, Flag-ERK1AEF, TRIM15-YFP, and HA-Ub as indicated. Protein expression and ubiquitination of Flag-ERK1 were analyzed by d-IP and/or immunoblot.
Assays in panels a-l have been performed two times with similar results.
To evaluate whether ubiquitination enhances the ERK-MEK interaction, we compared ERK1 with different extents of ubiquitination for binding to MEK1 or MEK1DD, a constitutively active form of MEK1 (ref. 40). Flag-ERK1ub interacted with MEK1DD more strongly than Flag-ERK1 in vitro (Fig. 4e). A Flag-ERK1 protein that was near-completely conjugated with K63-linked ubiquitin chains (referred to as Flag-ERK1-Ub) also interacted with MEK1 more strongly than Flag-ERK1 (Fig. 4f). On the contrary, compared to ERK1, both ERK12KR and ERK1K302R exhibited a weaker interaction with MEK1 in cells (Fig. 4g,h) and with MEK1DD in vitro (Fig. 4i,j). Therefore, ubiquitination of ERKs increases their interaction with MEKs.
To determine whether ubiquitination-mediated ERK activation is dependent on phosphorylation at the activation loop, we used an ERK1 mutant in which Ser and Tyr at the activation loop TEY motif were replaced with Ala and Phe, respectively (ERK1AEF). Unlike Flag-ERK1, Flag-ERK1AEF protein purified from HEK293T cells where it was expressed alone showed no activity towards ELK1 in vitro (Fig. 4k). Co-expression with TRIM15, although increasing ERK1AEF ubiquitination (Fig. 4l), failed to activate ERK1AEF (Fig. 4k). Thus, TRIM15-mediated activation of ERK1/2 requires the phosphorylation of these MAPKs by MEK. Collectively, these results indicate that TRIM15 promotes ERK interaction with and activation by MEK via K63 ubiquitination.
CYLD is a K63-specific DUB for ERK1/2
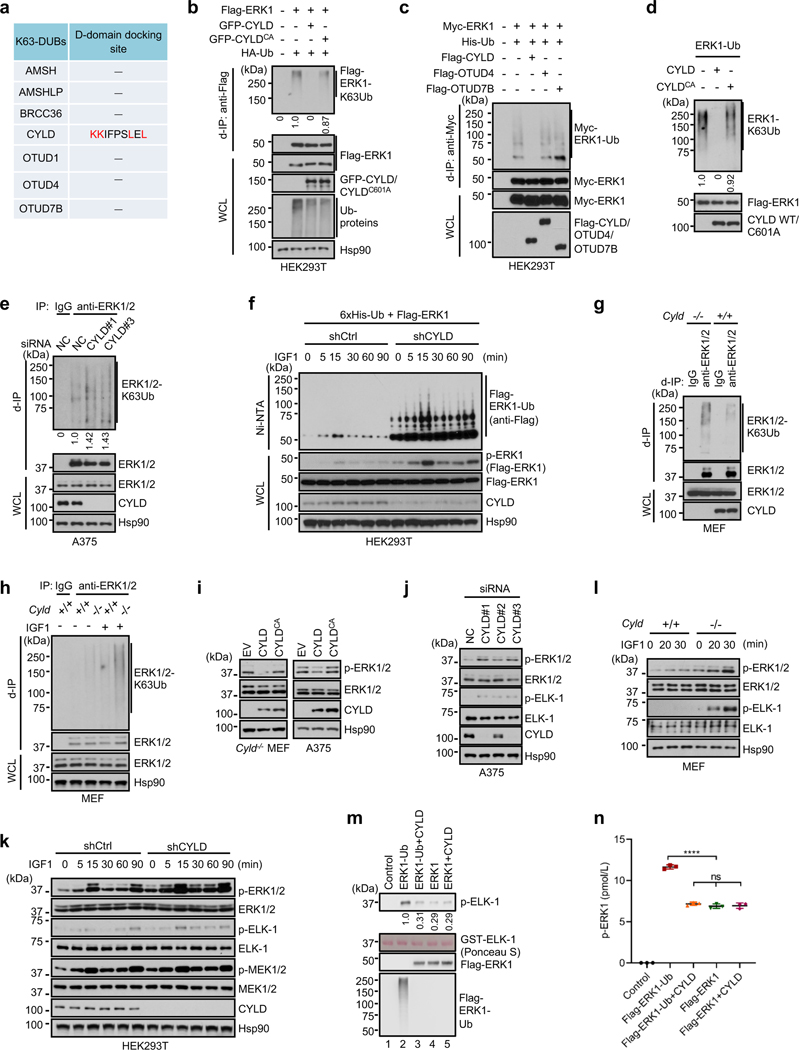
Next, we sought to identify the DUB that may counteract the effect of TRIM15 on ERKs. The human genome encodes ~100 DUBs41, 42. Whereas most DUBs display minimal or no preference for a certain ubiquitin linkage, a small number of them have evolved high specificity. Given that ERK1/2 can be targeted for proteasomal degradation presumably through K48-linked ubiquitination43, 44, we reasoned that a TRIM15-antagonizing DUB may display high specificity for the K63 linkage. Among several K63 linkage-specific DUBs, we identified a potential D domain-docking site in the tumor suppressor CYLD (cylindromatosis-associated DUB) (Fig. 3f, 5a). Upon co-expression in cells, CYLD inhibited K63 ubiquitination of ERK1 (Fig. 5b,c). In contrast, but not a catalytically-inactive CYLD mutant (C601A or CA) as well as two other K63 linkage-specific DUBs, ovarian tumor-related protease 4 (OTUD4) and OTUD7B, did not alter ERK1 ubiquitination (Fig. 5c). CYLD, but CYLDCA, also cleaved virtually all the ubiquitin chains off of Flag-ERK1-Ub in vitro (Fig. 5d).
Fig. 5 |. CYLD deubiquitinates and inactivates ERK1/2.
a, Analysis of known K63-specific DUBs for potential D-domain docking sites.
b, c, Ubiquitination of Flag-ERK1 (b) or Myc-ERK1 (c) in HEK293T cells in the presence or absence of GFP-CYLD, GFP-CYLDCA, and/or HA-Ub (b), or Flag-CYLD, Flag-OTUD4, Flag-OTUD7B and/or 6xHis-Ub. The relative ubiquitination signal was normalized to unmodified Flag-ERK1 in the IP samples.
d, Purified, K63-ubiquitinated ERK1 was incubated with or without purified CYLD or CYLDCA protein, and analyzed for de-ubiquitination. The relative ubiquitination signal was normalized to unmodified Flag-ERK1.
e, CYLD knockdown increases ERK ubiquitination. A375 cells transfected with control or CYLD siRNA were subjected to d-IP with control IgG or anti-ERK1/2 antibody, and analyzed for ERK1/2 ubiquitination. The relative ubiquitination signal was normalized to unmodified Flag-ERK1 in the IP samples.
f, HEK293T cells stably expressing shCtrl or shCYLD were transfected with Flag-ERK1 and 6xHis-Ub. Cells were serum-starved and stimulated with IGF1. Cell lysates were analyzed for Flag-ERK1 activation. Ubiquitinated proteins were pulled down by Ni-NTA beads and analyzed for Flag-ERK1 ubiquitination.
g, h, ERK1/2 ubiquitination in Cyld+/+ and Cyld−/− MEFs that were untreated (g) or serum-starved and treated with or without IGF1 overnight (h).
i, j, l, ERK1/2 activation in Cyld−/− MEFs and A375 cells transduced with control (EV), CYLD, or CYLDCA lentiviral vectors (i), A375 cells transfected with control or one of the three independent CYLD siRNAs (j), and Cyld+/+ and Cyld−/− MEFs that were treated with IGF1 for the indicated times (l).
k, ERK and MEK activation in HEK293T cells stably expressing shCtrl or shCYLD that were serum-starved and stimulated with IGF1 for the indicated times.
Assays in panels b-l have been performed two times with similar results.
m, n, Activation of ERK1 by MEK1DDin vitro is dependent on its ubiquitination. MEK1DD-mediated activation of Flag-ERK1-Ub and Flag-ERK1 proteins that were treated with or without CYLD was analyzed by in vitro kinase assay with GST-ELK1 as the substrate (m), and by levels of phospho-ERK1 (pTEpY) with ELISA (n). Data are Mean ± SD (n = 3 biologically independent samples). **** P < 0.0001; ns, no significance; One-way ANOVA followed by Tukey’s multiple comparisons test.
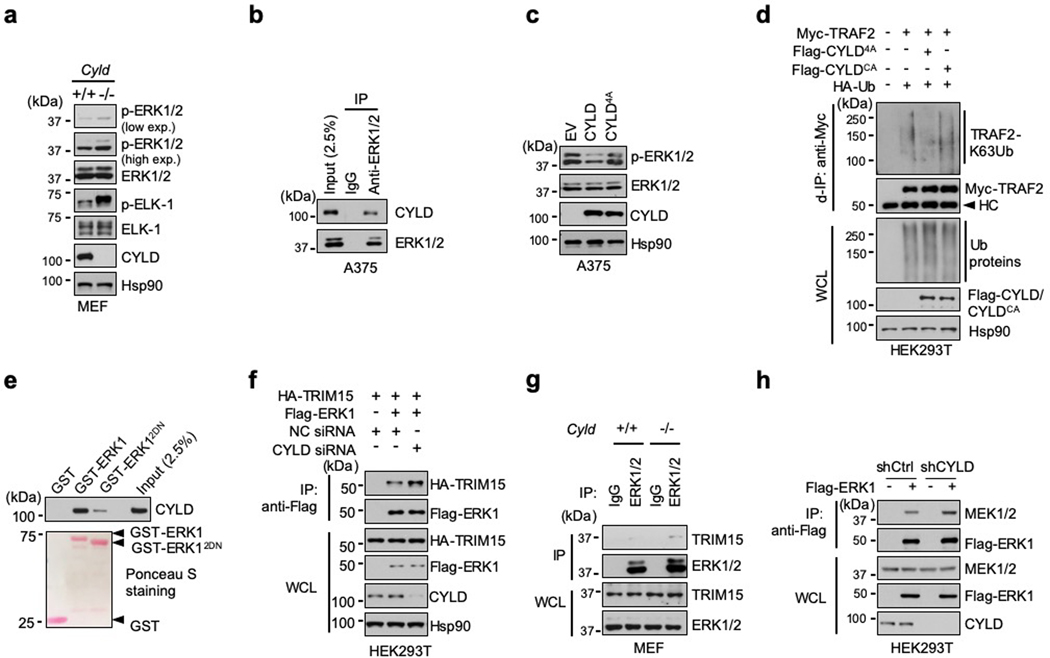
CYLD, like TRIM15, was expressed in multiple melanoma cell lines (Extended Data Fig. 2a). Knocking down CYLD with independent siRNAs increased K63 ubiquitination of endogenous ERK1/2 in A375 cells (Fig. 5e). Similarly, knocking down CYLD with an shRNA increased K63 ubiquitination of Flag-ERK1 in unstimulated and IGF1-stimulated HEK293T cells (Fig. 5f). Moreover, compared to wild-type (Cyld+/+) mouse embryonic fibroblasts (MEFs), Cyld-knockout (Cyld−/−) MEFs contained a higher basal level of K63-ubiquitinated ERK1/2 and, in response to IGF1 treatment, up-regulated ERK ubiquitination to a greater extent (Fig. 5g,h). These results suggest that CYLD is a K63 linkage-specific DUB for ERK1/2.
Forced expression of CYLD, but not CYLDCA, also reduced ERK1/2 activation in Cyld−/− MEFs and A375 cells (Fig. 5i). Conversely, knocking down CYLD elevated basal ERK1/2 activity in A375 cells in a manner correlating with the knockdown efficiency (Fig. 5j), and increased activity of Flag-ERK1 and endogenous ERK1/2 in unstimulated and IGF1-stimulated HEK293T cells (Fig. 5f,k). Moreover, compared to Cyld+/+ MEFs, Cyld−/− MEFs displayed higher basal ERK1/2 activity and accentuated ERK1/2 activity more strongly upon IGF1 treatment (Fig. 5l and Extended Data Fig. 6a). Therefore, CYLD keeps ERK1/2 in a hypo-ubiquitinated, inactive state.
In the presence of MEK1DD, recombinant Flag-ERK1-Ub displayed a higher level of kinase activity (Fig. 5m) and activation loop phosphorylation (Fig. 5n) than Flag-ERK1. Treatment with CYLD effectively abolished the difference between Flag-ERK1-Ub and Flag-ERK1 (Fig. 5m,n). These results further indicate that TRIM15-mediated ubiquitination enhances, while CYLD-mediated deubiquitination inhibits, activation of ERK1/2 by MEK.
CYLD interacts with ERK1/2 via conserved domains
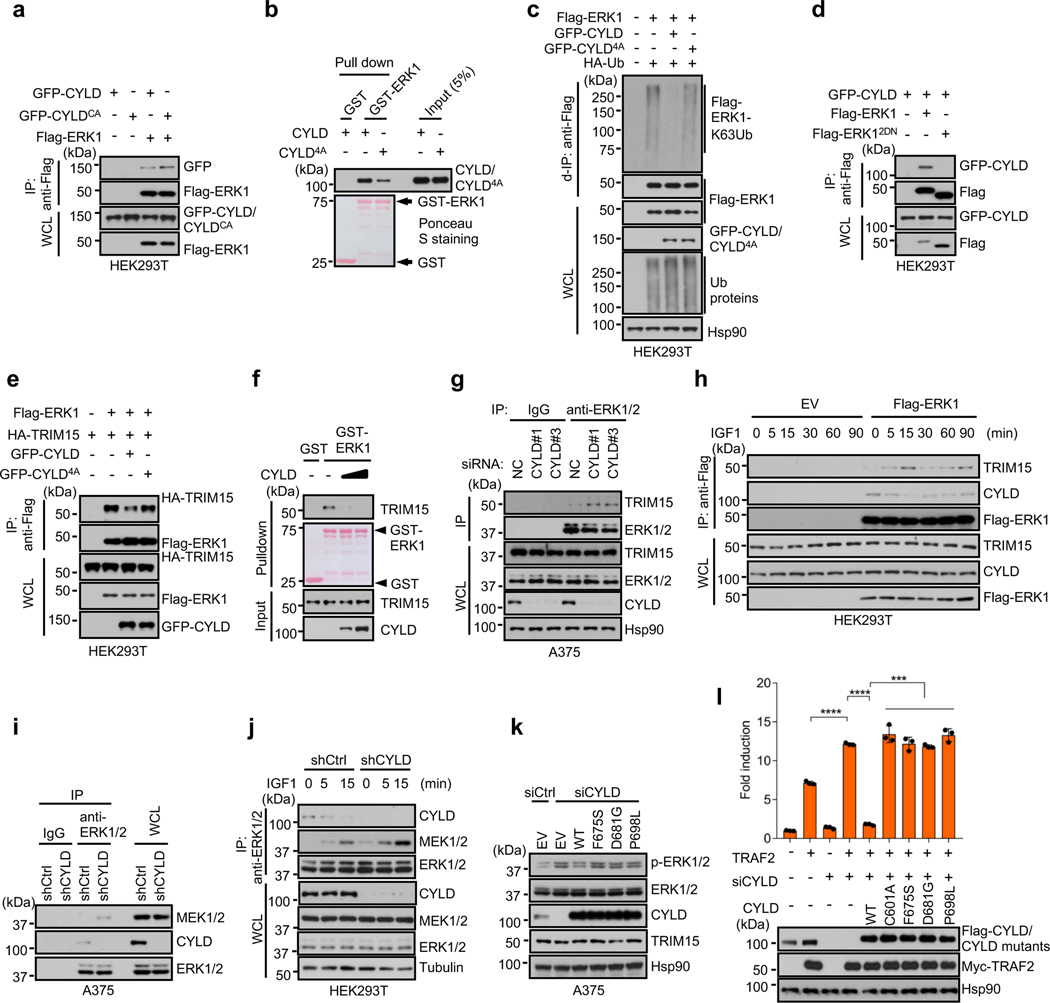
Upon co-expression, GFP-CYLD and GFP-CYLDCA interacted with Flag-ERK1 in HEK293T cells (Fig. 6a). Endogenous CYLD and ERK1/2 also interacted with each other in A375 cells (Extended Data Fig. 6b). In vitro, Flag-CYLD was pulled down by GST-ERK1, but not GST (Fig. 6b), indicating that a direct interaction between CYLD and ERK1.
Fig. 6 |. CYLD associates with ERK and inhibits its interaction with TRIM15 and MEK.
a, Interaction of GFP-CYLD and GFP-CYLDCA with Flag-ERK in HEK293T cells was analyzed by co-IP assay.
b, CYLD-ERK1 interaction in vitro and its dependence on CYLD D-domain docking site. Flag-CYLD and Flag-CYLD4A were incubated with immobilized GST or GST-ERK1. The pulldown samples and input were analyzed by Western blot and/or Ponceau S staining.
c, GFP-CYLD4A cannot effectively deubiquitinate ERK1. Ubiquitination of Flag-ERK1 in HEK293T cells in the presence of GFP-CYLD, GFP-CYLD4A, and/or HA-Ub.
d, CYLD interacts with the CD domain of ERK. Interaction between GFP-CYLD and Flag-ERK1 or Flag-ERK12DN in HEK293T cells were analyzed by co-IP assay.
e, CYLD impedes the TRIM15-ERK1 interaction in cells. TRIM15-ERK1 interaction in HEK293T cells in the presence or absence of GFP-CYLD or GFP-CYLD4A was analyzed by co-IP assay.
f, CYLD impedes the TRIM15-ERK1 interaction in vitro. Interaction between ERK1 and TRIM15 in the presence of increasing amount of CYLD was analyzed by an in vitro pulldown assay.
g, Interaction between endogenous ERK1/2 and TRIM15 in A375 cells transfected with negative control (NC) or CYLD siRNA was assayed by co-IP.
h, Interactions between Flag-ERK1 and endogenous TRIM15 and CYLD in HEK293T cells that were serum-starved and exposed to IGF1 (100 ng/ml) for the indicated durations.
i, Endogenous ERK-CYLD and ERK-MEK interaction in A375 cells stably expressing shCtrl or shCYLD.
j, Interactions of ERK1/2 with CYLD and MEK1/2 in control and CYLD-knockdown HEK293T cells that were stimulated with IGF1 for the indicated durations.
k, Activation of ERK1/2 in A375 cells treated with control or CYLD siRNA and transfected with EV or the indicated CYLD proteins.
Assays in panels a-k have been performed two times with similar results.
l, HEK293T cells were transfected with CYLD siRNA or control siRNA for 24 h and then with NF-κB reporter together with TRAF2, CYLD, or CYLD mutants. TRAF2-induced NF-κB activity was assayed. The result was shown as Mean ± SD (n = 3 biologically independent samples). *** P < 0.001; **** P < 0.0001; One-way ANOVA followed by Tukey’s multiple comparisons test.
A mutant CYLD in which four conserved residues within the D domain-docking site were replaced with Ala (4A; Fig. 3f) exhibited a weakened ability to bind to ERK1 (Fig. 6b). CYLD4A was also ineffective in deubiquitinating and inactivating ERK1 (Fig. 6c and Extended Data Fig. 6c), although it was fully capable of deubiquitinating another substrate, TRAF2 (Extended Data Fig. 6d)11. Moreover, ERK12DN showed no or minimal interaction with CYLD (Fig. 6d and Extended Data Fig. 6e). Thus, the CYLD-ERK interaction, like the TRIM15-ERK interaction, may be mediated by the D domain-docking site and the CD domain on the respective proteins.
CYLD inhibits ERK interactions with TRIM15 and MEK
Given that both TRIM15 and CYLD interact with the CD domain on ERK, we tested whether they compete for the binding. Overexpressing CYLD, but not CYLD4A, impeded the TRIM15-ERK1 interaction in cells (Fig. 6e). In vitro, recombinant CYLD near-completely blocked the association of TRIM15 with ERK1 (Fig. 6f). Conversely, knocking down CYLD increased the interactions of endogenous TRIM15 and ERK1/2 in A375 cells (Fig. 6g) and HA-TRIM15 and Flag-ERK1 in HEK293T cells (Extended Data Fig. 6f). The TRIM15-ERK interaction was also stronger in Cyld−/− than Cyld+/+ MEFs (Extended Data Fig. 6g). Moreover, an increase in the TRIM15-ERK1 association upon IGF1 stimulation was accompanied by a decline in the CYLD-ERK1 association (Fig. 6h). Thus, CYLD likely inhibits the TRIM15-ERK interaction.
Knockdown of CYLD also enhanced endogenous ERK-MEK interaction in A395 cells (Fig. 6i) and interaction of Flag-ERK1 with endogenous MEK in HEK293T cells (Extended Data Fig. 6h). As the interaction of ERK1/2 with CYLD declined following IGF1 stimulation, the interaction of ERK1/2 with MEK increased (Fig. 6j). Thus, CYLD also impedes the ERK-MEK interaction. Collectively, these results indicate that TRIM15 and CYLD regulate ERK activation through competitive binding in addition to opposing activities.
Distinct signaling specificities of CYLD and TRIM15
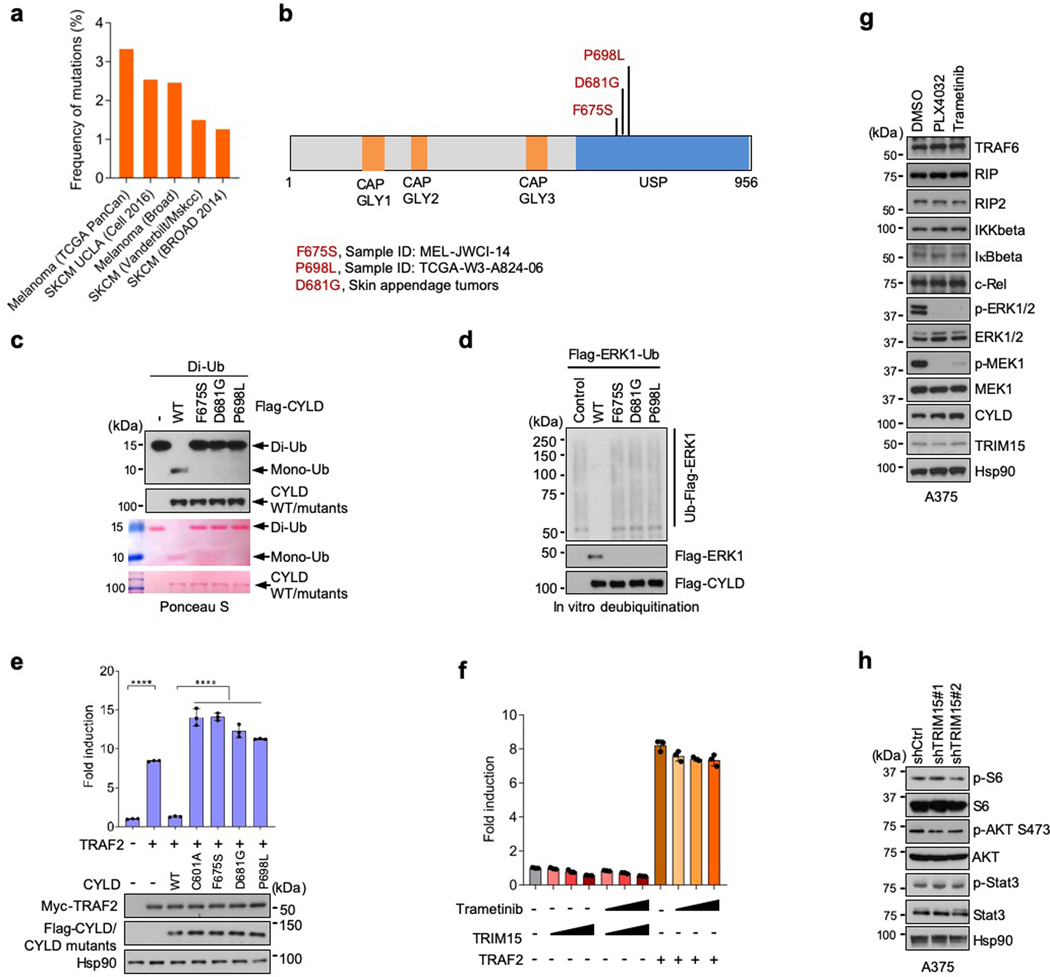
Mutations in CYLD are associated with cylindromas, a familial skin tumor of the head and neck45, as well as other tumors including melanoma (Extended Data Fig. 7a)46, 47. The tumor suppressive function of CYLD has been attributed in part to its inhibition of NF-κB signaling48–50. To evaluate whether tumor-associated CYLD mutants also lose the ability to regulate the ERK pathway, we generated two melanoma-associated mutants (F675S and P698L) and a skin tumor-associated mutant (D681G) in the ubiquitin specific protease (USP) domain (Extended Data Fig. 7b). These CYLD mutants were unable to cleave di-Ub or remove ubiquitin chains from ERK1-Ub (Extended Data Fig. 7c,d). They also failed to reverse ERK1/2 activation in CYLD-knockdown cells (Fig. 6k), and to suppress TRAF2-induced NF-κB signaling in control and CYLD-knockdown cells (Fig. 6l and Extended Data Fig. 7e). These results further indicate that CYLD regulates the ERK pathway in addition to the NF-κB pathway.
In contrast to CYLD, overexpression of TRIM15 did not activate NF-κB (Extended Data Fig. 7f). Suppression of the ERK pathway by PLX4032 or trametinib did not affect levels of NF-κB pathway components either (Extended Data Fig. 7g). Moreover, knockdown of TRIM15 did not affect the activation of Stat3 or the mTOR target S6, and only moderately reduced the activation of Akt (Extended Data Fig. 7h). Therefore, TRIM15 appears to be specific for the ERK pathway.
A role of TRIM15 in oncogenic growth of melanoma
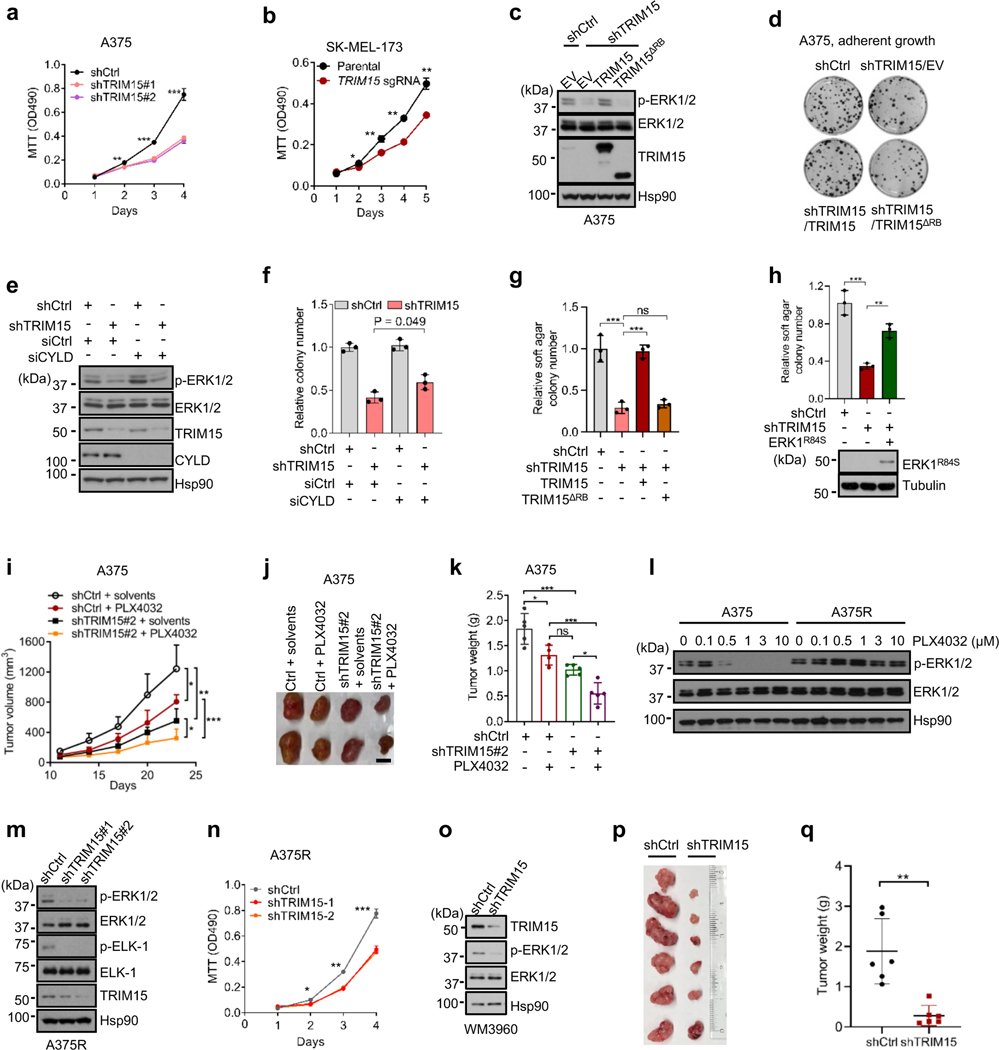
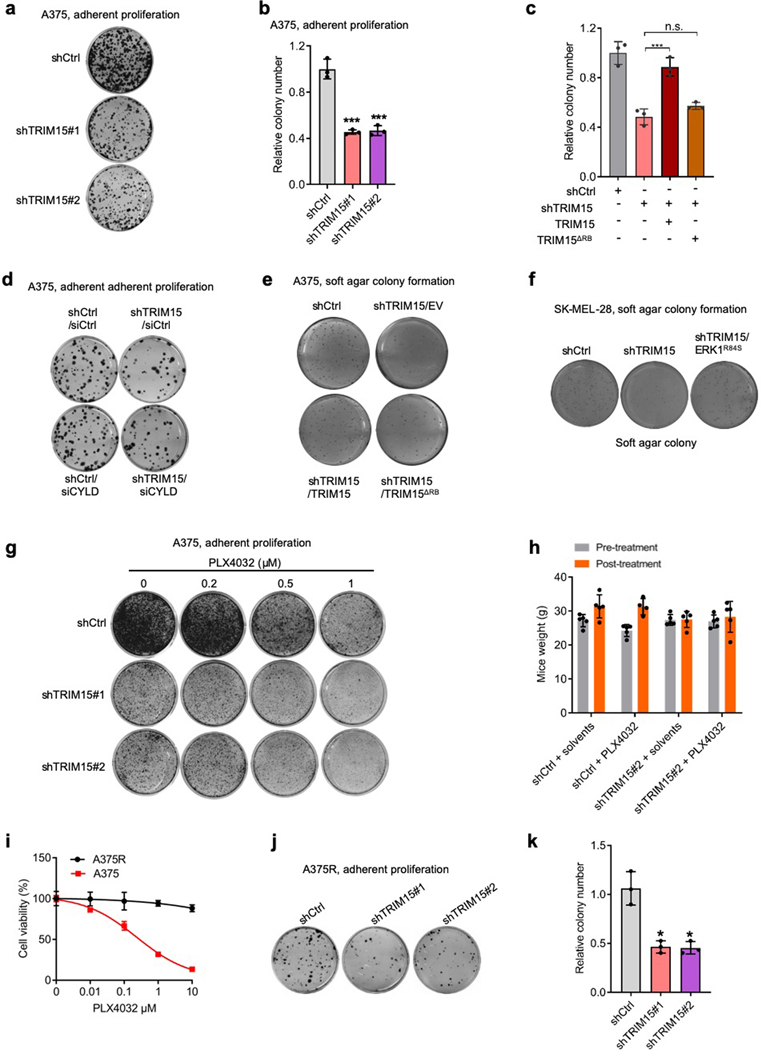
The stimulatory effect of TRIM15 on ERK prompted us to investigate its role in melanoma. TRIM15-knockdown A375 cells (Fig. 7a and Extended Data Fig. 8a,b) and TRIM15-knockout SK-MEL-173 cells (Fig. 7b) proliferated substantially slower compared to their respective control cells. An shRNA-resistant form of TRIM15, but not TRIM15ΔRB, restored ERK1/2 and proliferation in TRIM15-knockdown A375 cells (Fig. 7c,d and Extended Data Fig. 8c). Depleting CYLD in TRIM15-knockdown A375 cells also restored ERK1 activity and proliferation (Fig. 7e,f and Extended Data Fig. 8d). These results suggest that TRIM15 promotes, while CYLD inhibits, proliferation of melanoma cells.
Fig. 7 |. An oncogenic role for TRIM15 in melanoma.
a, Proliferation of A375 cells transduced with lentiviral vectors expressing control shRNA (shCtrl), TRIM15 shRNAs #1, or TRIM15 shRNAs #2.
b, Proliferation of parental and TRIM15-knockout SK-MEL-173 cells.
c, d, g, A375 cells stably expressing shCtrl or shTRIM15 were transfected with or without TRIM15 or TRIM15ΔRB. Cells were analyzed for ERK1/2 activation (c), colony formation (d) and soft agar colony formation (g).
e, f, TRIM15-knockdown A375 cells transfected with siCtrl or siCYLD were analyzed for protein expression (e) and colony formation (f).
h, Soft agar colony formation by SK-MEL-28 cells stably expressing control shRNA, TRIM15 shRNA, and Flag-ERK1R84S as indicated. ** P = 0.005; *** P = 0.0002.
i-k, Xenograft tumor formation by control and TRIM15-knockdown A375 cells in mice that were treated with or without PLX4032. Shown are tumor volume over time (i), and representative tumor images (j) and tumor weight (n = 5 animals) (k) at day 23.
l, Re-activation of ERK1/2 in PLX4032-resistant A375 (A375R) cells. A375 and A375R cells treated with increasing concentrations of PLX4032 for 24 h were analyzed for ERK1/2 activation by Western blot.
m, n, A375R cells were transduced with lentiviral vectors expressing control or one of the two independent TRIM15 shRNAs. Cells were analyzed for ERK1/2 and ELK-1 phosphorylation (m) and proliferation (n).o-q, Melanoma PDX-derived cell line WM3960 stably expressing control (shCtrl) or TRIM15 (shTRIM15) shRNAs were analyzed for protein expression (o) and tumor formation in xenografted mice with tumor images (p) and weights shown (q) (n = 6 biologically independent animals), ** P = 0.0037.
Assays in panels c, e, l, m, and o have been performed two times with similar results. Data are Mean ± SD (n = 4 biologically independent samples for a, and 3 for b, f-h, and n). * P < 0.05; ** P < 0.01; *** P < 0.001; ns, no significance. Two-tailed Student’s t-test for a, b, n, q; one-way ANOVA test followed by Tukey’s post hoc test for g-i, k.
Knocking down TRIM15 also impeded anchorage-independent growth of A375 cells (Fig. 7g and Extended Data Fig. 8e) and SK-MEL-28 cells (Fig. 7h and Extended Data Fig. 8f). This defect was again rescued by the shRNA-resistant form of TRIM15, but not TRIM15ΔRB (Fig. 7g and Extended Data Fig. 8e). It was also rescued by a constitutively active form of ERK1 (ERK1R84S; Fig. 7h and Extended Data Fig. 8f)51, further indicating that TRIM15 regulates tumor cell proliferation via the ERK pathway. In a xenograft model, tumors produced by TRIM15-knockdown cells progressed at a much slower rate compared to tumors produced by control cells (Fig. 7i–k). Collectively, these results show that TRIM15 is critical for tumorigenicity of melanoma cells.
A role of TRIM15 in the survival of drug-resistant melanomas
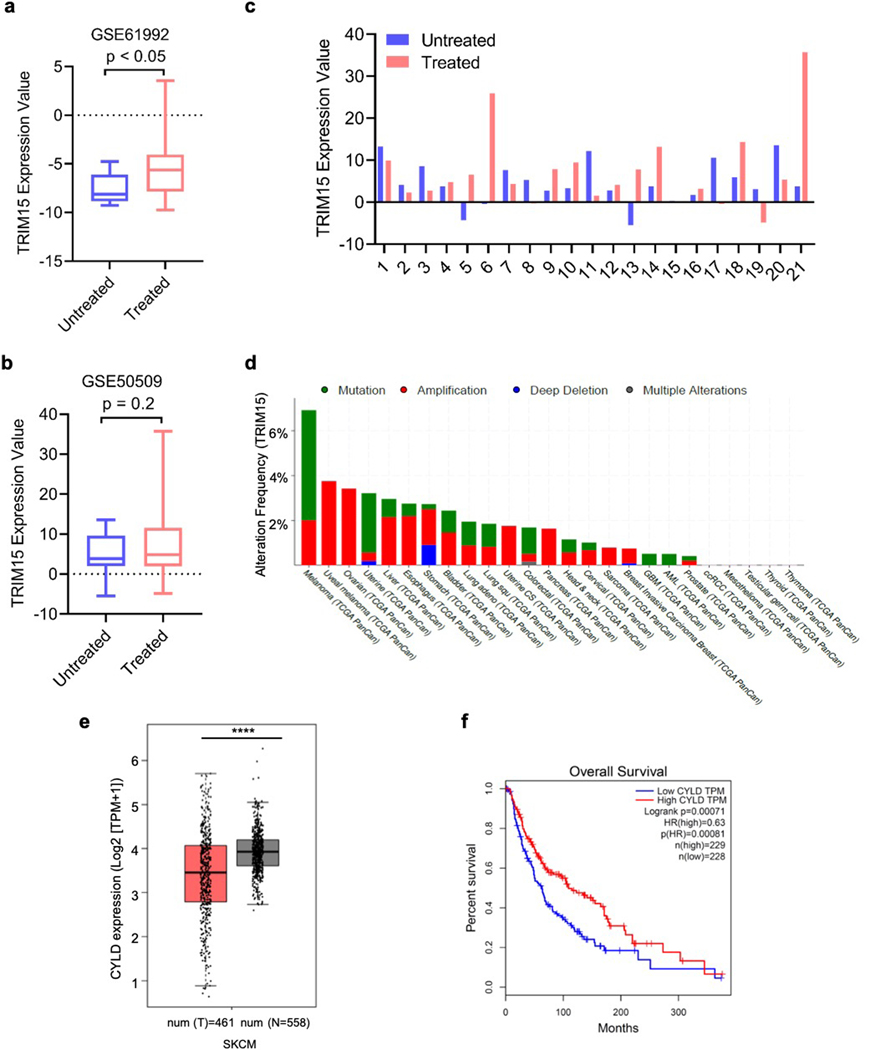
Small molecule inhibitors for oncogenic BRAF mutations, which are associated with 40–60% of melanomas as well as a significant fraction of other cancers52, substantially improve progression-free and overall survival32, 53–55. However, nearly all patients develop drug resistance in a relative short period of time through diverse mechanism, each accounting for a subset of the resistant tumors5–7. An analysis of public datasets showed that compared to matched pre-treatment tumor samples, there was a statistically significant increase in TRIM15 expression across melanoma samples that initially responded to BRAF inhibitor or BRAF plus MEK inhibitors but subsequently progressed (Extended Data Fig. 9a)56, or in a subset of these treated samples (Extended Data Fig. 9b,c)57. Thus, TRIM15 upregulation might contribute to drug resistance, although further investigation is needed.
Since the great majority of drug resistance mechanisms eventually lead to the re-activation of ERK1/2 (ref. 5–7), TRIM15 may be a valuable drug target in drug-resistant as well as drug-responsive tumors. Indeed, TRIM15 knockdown impaired adherent proliferation (Extended Data Fig. 8g) and tumorigenicity (Fig. 7i–k and Extended Data Fig. 8h) of A375 cells to an extent similar to that achieved by a high dose of PLX4032. TRIM15 knockdown also synergized with PLX4032 treatment, reducing adherent proliferation in culture and tumor growth in xenografted animals in a manner that was much stronger than either treatment alone (Fig. 7i–k and Extended Data Fig. 8h).
To evaluate the role of TRIM15 in BRAFV600E inhibitor-resistant melanomas, we continuously cultured A375 cells in the presence of PLX4032 and obtained PLX4032-resistant cells (A375R; Extended Data Fig. 8i), where ERK1/2 were re-activated (Fig. 7l). Knocking down TRIM15 in A375R cells inhibited ERK1/2 activation (Fig. 7m) and suppressed cell proliferation (Fig. 7n and Extended Data Fig. 8j,k). We also used a patient-derived xenograft (PDX) cell line, WM3960, which was established from a primary melanoma that harbored both BRAFV600E and NRASQ61K and was resistant to the BRAF inhibitor dabrafenib (GSK-2118436) and the MEK inhibitor trametinib58. Depleting TRIM15 in WM3960 cells markedly reduced ERK1/2 activation (Fig. 7o). It also strongly inhibited tumorigenicity in animals (Fig. 7p,q). These results suggest that TRIM15 is important for the survival of therapeutic-resistant melanomas.
TRIM15/CYLD expression in melanoma specimens
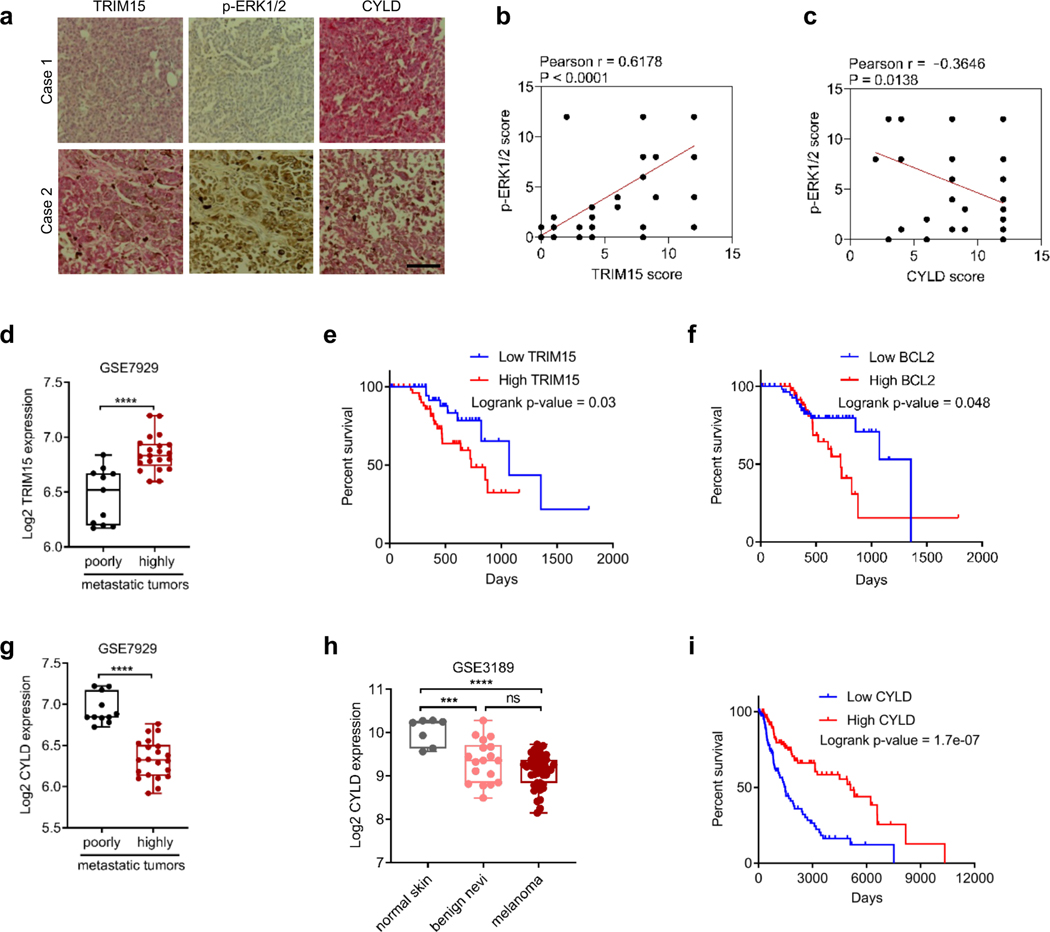
We performed an immunohistochemical analysis of human melanoma specimens, and observed that ERK1/2 activity positively correlated with TRIM15 protein levels and inversely correlated CYLD protein levels (Fig. 8a–c). An analysis of public databases revealed that the TRIM15 gene was amplified in melanoma and other tumors (Extended Data Fig. 9d). TRIM15 transcript was also significantly up-regulated in the highly metastatic derivatives of A375 cells compared to the poorly metastatic parental cells (Fig. 8d)59. Furthermore, high expression of TRIM15 or its target BCL2 correlated with poor survival of melanoma patients (Fig. 8e,f). In contrast, CYLD transcript was markedly decreased in highly metastatic derivatives of A375 cells (Fig. 8g). CYLD transcript was also lower in benign nevi and malignant melanoma compared to normal skin (Fig. 8h and Extended Data Fig. 9e)60. Moreover, low expression of CYLD correlated with poor survival in melanoma patients (Fig. 8i and Extended Data Fig. 9f). Thus, high TRIM15 expression and low CYLD expression may contribute to melanoma initiation and progression.
Fig. 8 |. TRIM15 and CYLD expression in melanoma cell lines and specimens.
a-c, IHC staining of 48 human melanoma specimens. Shown are representative images of two different specimens (a, scale bar, 100 μm), and Pearson correlation of staining intensity (b,c). Note that the scores of some samples overlapped.
d, g, mRNA levels of TRIM15 (d) and CYLD (g) in poorly metastatic (n = 11 biologically independent samples) and highly metastatic (n = 21 biologically independent samples) melanoma cell lines. In (d), the minimum, 25% percentile, median, 75% percentile, maxima are 6.171, 6.197, 6.520, 6.671, and 6.839, respectively, for poorly tumors; and 6.597, 6.738, 6.833, 6.938, and 7.196, respectively, for highly metastatic tumors. In (g), these values are 6.725, 6.835, 6.846, 7.174, and 7.222, respectively, for poorly metastatic tumors; and 5.919, 6.131, 6.324, 6.508, and 6.762, respectively, for highly metastatic tumors.
e, f, i, Kaplan-Meier survival curves of melanoma patients (II-IV stages) with TRIM15 mRNA high (n = 55 patients) and low (n = 45 patients) expression (e), BCL2 mRNA high (n = 43 patients) and low (n = 59 patients) expression (f), and CYLD mRNA high (n = 114 patients) and low (n = 114 patients) expression (i). Patient data were from HPA database with significance assessed by a log-rank test (e), or Human Protein Atlas (f) or OncoLnc (i) with significance assessed by a log-rank test,
h, CYLD mRNA expression in human normal skin (n = 7 independent donors), nevi (n = 18 independent nevi patients), and primary malignant melanoma (n = 45 independent melanoma patients) from GEO accession no. GSE3189. The minimum, 25% percentile, median, 75% percentile, maxima are 9.561, 9.636, 10.23, 10.27, and 10.28, respectively, for normal skin; 8.492, 8.838, 9.355, 9.711, and 10.28, respectively, for benign nevi; and 8.146, 8.838, 9.214, 9.372, and 9.730, for melanoma.
Data are Mean ± SD. *** P < 0.001, **** P < 0.0001; ns, no significance. Two-sided Student’s t-test for d, g; One-way ANOVA test followed by Tukey’s post hoc test for h.
Discussion
The ERK pathway is the preeminent mitogenic pathway in mammalian cells, normal or malignant. The signaling transduction through the ERK and other MAPK pathways has largely been investigated in the context of protein phosphorylation. The current study shows that K63 ubiquitination is critical for the ERK1/2 activation. This posttranslational modification, which is dynamically regulated by TRIM15 and CYLD, facilitates the interaction of ERK with MEK. Thus, our findings reveal a previously unrecognized mechanism that governs MAPK activity and permits the efficiency and specificity of signal transmission within MAPK cascades.
There is a paucity of information on the cellular function of TRIM15 except for a role in focal adhesion61. We find that TRIM15 appears to be the main ubiquitin E3 ligase for ERK1/2. In its absence, K63 ubiquitination on ERK1/2 is barely detectable even upon mitogenic stimulation. ERK1 and ERK2 may be the principal targets of TRIM15 for cell proliferation, as the proliferative defects caused by TRIM15 loss can be largely restored by a constitutively-active form of ERK1. In contrast, CYLD has been implicated in various cellular processes including inflammation, spermatogenesis, bone homeostasis, cell cycle progression, and cell migration, and its deregulation contributes to tumor formation46. Our results suggest that these diverse functions of CYLD may be attributable in part to its role the ERK pathway, in addition to the NF-κB pathway.
The ERK pathway is one of the most commonly mutated pathways in human tumors4. TRIM15 is required for the growth of both drug-responsive and -resistant melanoma cells, and its upregulation may correlate with ERK activation in melanoma specimens. These observations suggest a potential utility of TRIM15 as a drug target and a prognostic marker for various tumors driven by a hyperactive ERK pathway.
Methods
Plasmids.
HA-TRIM15 and Flag-TRIM15 were generated by cloning human TRIM15 cDNA into pcDNA3-HA and pcDNA3-Flag vector, respectively. Lentiviral vector expressing TRIM15 was generated by cloning TRIM15 cDNA into GFP-T2A-mCherry/pTRPE (kindly provided by J. L. Riley). pBabe-HA-MEK1 was kindly provided by Dr. D. Brady. Flag-CYLD and Flag-CYLDCA (C601A) were generated by cloning human CYLD cDNA into pcDNA3-Flag. pCDH-CYLD and pCDH-CYLDCA were generated by cloning the corresponding human CYLD cDNAs into pCDH-EF1-FHC vector. GST-ELK-1 (aa 307–428), GST-ERK1, GST-ERK12KR (K168R/K302R), and GST-TRIM15 constructs were generated by cloning the corresponding human cDNA into pGEX-1λT (a modified version of pGEX-4T1). TRIM15-YFP, _BCPS-YFP (TRIM15 ΔR-YFP), _CPS-YFP (TRIM15 ΔB-YFP), RB_PS-YFP (TRIM15 ΔCC-YFP), RBC_-YFP (TRIM15 ΔPS-YFP), pGIPZ shRNA, TRIM15 shRNA#1 and TRIM15 shRNA#2 were kindly provided by Walther Mothes61.
Point mutations were generated by site-directed mutagenesis. Flag-ERK1 K32R, K65R, K72R, R84S, K155R, K168R, K220R, K287R, K289R, K294R, K298R, K302R, K317R, K357R, K361R, AEF, 2KR K (168R/K302R), and 2DN (D335N/D338N) were generated using Flag-ERK1 (Addgene plasmid #49328) as the template. Flag-ERK22KR (K149R/K283R) was generated using Flag-ERK2 (kindly provided by Scott Eblen and Andy Catling) as the template. HA-TRIM154A (R269A/K270A/L272A/L274A) and Flag-CYLD4A (K767A/K768A/L773A/L775A) were generated with pcDNA3-HA-TRIM15 and pcDNA3-Flag-CYLD as the template, respectively. Other tagged TRIM154A and CYLD4A plasmids were generated by using the mutant pcDNA3 plasmids as templates. All constructs generated in this study were verified by DNA sequencing.
The following plasmids were purchased from Addgene: HA-Ubiquitin WT (#17608), HA-Ubiquitin K48R (#17604), HA-Ubiquitin K33 (#17607), HA-Ubiquitin K48 (#17605), and HA-Ubiquitin K63 (#17606) (gifts from Ted Dawson); HA-Ubiquitin K6 (#22900), HA-Ubiquitin K11 (#22901), HA-Ubiquitin K27 (#22902), and HA-Ubiquitin K29 (#22903) (gifts from Sandra Weller); GFP-CYLD (#60077) and GFP-CYLD-C601A (#60028) (gifts from Stephen Elledge); Flag-ERK1 (#49328) and Flag-ERK1 K71R (#49329) (gifts from Melanie Cobb); lentiCRISP v2-Blast (#83480, gift from Mohan Babu); GST-MEK1DD (#47576, gift from Kevin Janes); Myc-TRAF2 (#44104, gift from William Hahn); Flag-OTUD4 (#22594) and Flag-OTUD7B (#22550, gifts from Wade Harper), hRluc-NF-κB-firefly (#106979) and pCDH-EF1-FHC (#64874, gift from Richard Wood), pCI-His-Ubiquitin (#31815, gift from Astar Winoto).
Antibodies and other reagents.
Antibodies against the following proteins/epitopes were purchased from Cell Signaling Technology: K63 linkage-specific polyubiquitin (1:1000, #5621), Phospho-ELK-1 (Ser 383) (1:1000, #9181), Hsp90 (1:3000, #4877), ERK1/2 (1:1000, #4695), Phospho-ERK1/2 T202/Y204 (1:1000, #5726), MEK1/2 (1:2000, #4694; 1:2000, #2352), Phospho-MEK1 S217/221 (1:1000, #9154), HA (1:3000, #3724), DYKDDDDK (the same as Flag, 1:3000, #14793), BCL2 (1:1000, #3498), AKT1 (1:1000, #2938), Phospho-AKT1 (Ser473) (1:1000, #9018), S6 (1:1000, #2317), Phospho-S6 (Ser235/236) (1:1000, #4858), Stat3 (1:1000, #9319), Phospho- Stat3 (Tyr705) (1:1000, #9145), HRP-linked anti-rabbit IgG (1:5000, #7074), HRP-linked anti-mouse IgG (1:10000, #7076), anti-ERK1/2-conjugated Sepharose beads (#5736), and rabbit IgG-conjugated Sepharose beads (#3423). Antibodies for HA (1:1000, sc-805), ERK1/2 (1:1000, sc-514302), ubiquitin (1:1000, sc-9133), CYLD (1:1000, sc-137139), TRAF6 (1:1000, sc-7221), IKKbeta (1:1000, sc-52929), IκBbeta (1:1000, sc-945-G), c-Rel (1:1000, sc-071-G), and p-ERK1/2 (1:1000, sc-7383) were purchased from Santa Cruz. Antibody for ELK-1 (1:1000, A303–530A-M) was purchase from Bethyl Laboratories. Antibody for TRIM15 (1:1000, 13623–1-AP), Cyclin D1 (1:1000, 60186–1-Ig) and CYLD (1:1000, 11110–1-AP) was purchased from Proteintech. Antibody for TRIM15 (1:100, PA5–40946) was purchased from Invitrogen. Antibody for RIP (1:1000, 610458) and RIP2 (1:1000, 612348) were purchased from BD Biosciences. Anti-c-Myc agarose beads was purchased from ThermoFisher Scientific.
Z-Leu-Leu-Leu-al (MG132), IGF1 (I3769), puromycin and Flag (M2) beads were purchased from Sigma-Aldrich; EGF (E-100) from Alomone Labs; Di-ubiquitin (BML-UW0775–0100) from Enzo; and PLX4032 (Vemurafenib) from Selleckchem and AdooQ.
Cell culture.
Cells were purchased from ATCC unless otherwise indicated. HEK293T was cultured in DMEM (Corning). A375, D14, SK-MEL-28, SK-MEL-94, G361, and SK-MEL-173 were kindly provided by Dr. Irfan Asangani and cultured in DMEM; A549 was cultured in RPMI 1640 (Corning). Cyld+/+ and Cyld−/− MEFs were kindly provided by Dr. Yongge Zhao and cultured in DMEM. Melanoma PDX-derived cell line WM3960 (ref. 58) was cultured in Tu2% media (80% MCDB153, 20% Leibovitz’s L-15, 2% FBS and 1.68 mM CaCl2). Culture media were supplemented with 10% fetal bovine serum (Gemini) and 1% penicillin-streptomycin (Gibco), and cells were grown in a humidified incubator with 5% CO2 at 37 °C.
To generate PLX4032-resistant melanoma A375 cells, parental A375 cells were seeded at very low density and exposed to 2 μM PLX4032 (Adooq). After approximately 2 months of continuous PLX4032 exposure, PLX4032-resistant cells (A375R) were obtained. PLX4032-sensitive and resistant A375 cells were exposed to increasing doses of PLX4032 for three days. Cell viability was measured using MTT assay, and the p-ERK1/2 levels were detected by immunoblotting.
Lentiviral vectors and stable cell lines.
For production of lentiviral vectors, HEK293T cells were co-transfected with each lentiviral plasmid together with the helper plasmids. For generating TRIM15 lentiviral vectors, Gag, Rev, and VSVG were used. For generating shRNA lentiviral or Cas9-sgRNA lentiviral vectors, DR8.91 and VSVG were used. The virus-containing medium were harvested 72 h after transfection, centrifuged at 1,200 rpm for 5 min, filtered through 0.45 μm filters (Millipore), and concentrated by centrifugation at 10,000 rpm for 20 h. Cells were infected with the concentrated lentiviral particles in the presence of 8 μg/ml polybrene (Sigma) for 20–24 h and selected with appropriate antibiotics for one week.
Transient and stable RNAi knockdown.
For transient knockdown, cells were transfected with siRNAs (Integrated DNA Technologies) using Lipofectamine 2000 (Invitrogen Life Technologies) according to the manufacturer’s instructions. siRNA sequences were: negative control: 5’-GGUUAAUCGCGUAUAAUACGCGUAT-3’, CYLD#1: 5’-GGTACAAGATTGTTACTTCTATCAA-3’, CYLD#2: 5’-GGATGTTTATCATACTGTTTCTCTG-3’, CYLD#3: 5’-GGTTCATCCAGTCATAATAAACCAA-3’, TRIM15 siRNA mix (TRM15#1: 5’-AGATTGAGGATGTAAAGTGTCAAGA-3’, TRIM15#2: 5’-GATCCGTGATTTCCACAGGAAAATA-3’, and TRIM15#3: 5’-GATTCAGGGGTCATCACTCTGGACC-3’). For stable knockdown, cells were infected with the lentiviral particles expressing shRNAs as described above and selected in the presence of puromycin. shRNA sequences were: shControl: 5’-TACAAACGCTCTCATCGACAAG-3’, shTRIM15#1: 5’-AGCGGTTGTTTTTACTTTA-3’, shTRIM15#2: 5’-CAGCGGTTGTTTTTACTTT-3’ (ref. 61), shCYLD: 5’-TACTTAGACTCAACCTTATTC-3’ (ref. 62).
TRIM15 knockout cells.
To generate TRIM15 knockout SK-MEL-173 and HEK293T cell lines, single guide RNA (sgRNA) targeting TRIM15 was cloned by annealing two DNA oligos (Forward 5’-CACCG GCAGAGCAGGATCTTGCCCG-3’; Reverse 5’-AAACCGGGCAAGATCCTGCTCTGC C-3’) and ligating into lentiCRISPR v2-Blast (Addgene #83480). SK-MEL-173 and HEK293T cells were infected with lentiCRISPR v2-Blast-sgTRIM15 viral vectors and selected in the presence of 10 μg/ml of blasticidin.
Protein expression and purification.
To generate proteins from bacteria, E. coli BL21 (DE3) cells containing GST, GST-ERK1, GST-ERK12KR, GST-ERK12DN, and GST-ELK-1 (307–428) plasmids were induced for protein expression using 0.5 mM isopropyl-D-1-thiogalactopyranoside (IPTG) at 37 °C for 4–6 h. Cells were lysed with lysis buffer (50 mM Tris-Cl, pH 7.5, 0.5% Triton, 200 mM NaCl, 10% glycerol, 1 mM DTT, and 1 mM PMSF) and sonicated. After centrifugation lysates were incubated with Glutathione Sepharose 4B (GE Healthcare) at 4 °C for 4 h or overnight. The resin was washed with lysis buffer plus 300 mM NaCl for three times followed by PBS for two times. The proteins immobilized on Glutathione Sepharose beads were verified by SDS-PAGE and aliquoted to store at −80 °C. To perform in vitro kinase assay, GST-ELK-1 (307–428) protein was eluted using 20 mM reduced glutathione in buffer (50 mM Tris-Cl, pH 8.0, 10% glycerol, 1 mM DTT). To purify Flag-tagged ERK1, ERK2, TRIM15, TRIM154A, CYLD, and CYLD4A from mammalian cells, HEK293 cells were transfected with the corresponding plasmids, and the proteins were purified using anti-Flag (M2) beads as previously described63,64.
To purify Flag-ERK1 proteins that were partially (Flag-ERK1Ub) or nearly-completely (Flag-ERK1-Ub) conjugated to K63-linked polyubiquitin chains, HEK293T cells were transfected with Flag-ERK1, HA-TRIM15, and His-Ub. Flag-ERK1Ub was purified as for Flag-ERK1. Flag-ERK1-Ub, cells were lysed in buffer (250 mM NaH2PO4, 300 mM NaCl, 10 mM imidazole, 0.5% Triton, pH 8.0). Ubiquitinated proteins in the supernatant were purified with Ni-NTA beads. Eluted proteins were purified with anti-Flag M2 beads and eluted with 3xFlag peptides.
Immunoblotting and co-immunoprecipitation assay.
For immunoblotting, cells were lysed in lysis buffer (50 mM Tris-Cl at pH 7.4, 150 mM NaCl, 1% Triton, 1 mM DTT, supplemented with protease and phosphatase inhibitor cocktail [Thermo Scientific]) and sonicated at 20% amplitude for 20 sec (10 sec on, 10 sec off) on ice. Cell lysates were resolved by SDS-PAGE after measuring protein concentration by Bradford protein assays (Bio-Rad). For co-immunoprecipitation, cell lysates were immunoprecipitated with the indicated antibodies. Immunoprecipitates were washed four times with lysis buffer and subjected to SDS-PAGE and immunoblot.
In vivo ubiquitination assay.
Ubiquitination was detected by denaturing immunoprecipitation (d-IP). Cells were lysed in SDS-denaturing buffer (62.5 mM Tris-HCl pH 6.8, 2% SDS, 10% glycerol, 1.5% β-mercaptoethanol) and boiled for 10 min. Cell lysates were then diluted 10 to 40-fold in native lysis buffer (50 mM Tris-HCl pH 7.4, 0.5% Triton, 200 mM NaCl, 10% glycerol). After centrifugation at 13,000 rpm for 5 min, the supernatants were immunoprecipitated with anti-Flag mAb M2 beads (for Flag-tagged proteins), anti-ERK1/2 antibody-conjugated beads (for endogenous ERK1/2), or rabbit IgG-conjugated beads at 4 °C for 4 h or overnight. The immunocomplexes were washed 3 times with native lysis buffer, resolved by SDS-PAGE, and immunoblotted with antibody for ubiquitin or K63-linkage ubiquitin. For cells transfected with 6xHis-ubiquitin, ubiquitination was also detected by Ni-NTA beads (Qiagen). For this, cells were lysed with guanidine denaturing buffer (6 M guanidine-HCl, 0.1 M Na2HPO4/NaH2PO4, 10 mM imidazole, pH 8.0). After sonication, the whole cell extracts were incubated with nickel beads and washed, and the pulldown proteins were analyzed by immunoblot.
In vitro ubiquitination assay.
In vitro ubiquitination of ERK1 or ERK12KR was performed at 37 °C for 60 min in 50 μL reaction buffer (50 mM Tris pH 7.5, 5 mM MgCl2 and 2 mM DTT) which contains purified Flag-ERK1 or ERK12KR protein (5 μM), UBE1 (100 nM, Boston Biochem), UbcH13/Uev1a (1 μΜ, Boston Biochem), His-ubiquitin or His-ubiquitin K63R (100 μΜ, Boston Biochem), Flag-TRIM15 (2 μM) and Mg2+-ATP (10 mM, Sigma). The reaction mixtures were heated with addition of SDS-loading buffer at 95 °C for 10 min and then diluted with buffer (0.05% Triton, 0.1 M Na2HPO4/NaH2PO4, 10 mM imidazole, pH 8.0) for purification of ubiquitinated ERK1 or ERK12KR by Ni-NTA beads (Qiagen). Eluted proteins were analyzed by immunoblot.
Sucrose-gradient centrifugation analysis.
HEK293T cells were serum-starved for 24 h and then treated with IGF1 (100 ng/ml) for 15 min. Cells were harvested in pre-cold PBS on ice, pelleted, and lysed in lysis buffer (30 mM Tris-Cl pH 7.5, 150 mM sodium chloride, 1% Triton X-100, 25 mM sodium fluoride, 3mM sodium ortho-vanadate, 1 mM PMSF, and protease inhibitor cocktail) for 20 min. Lysates were centrifuged, and supernatant was layered on top of a 10–50% (10%, 20%, 30%, 40%, and 50%) sucrose gradient in buffer containing 30 mM Tris (pH 7.5), 150 mM sodium chloride, 0.02% Triton X-100, 25 mM sodium fluoride, 3 mM sodium ortho-vanadate, and protease inhibitors. Ultracentrifugation was performed in a Beckman SW41 Ti rotor at 40,000 rpm and 4 °C for 4 h. Fractions were collected and analyzed by SDS-PAGE and immunoblot.
Mass spectrometry.
Mass Spectrometry proteomics resources and services are provided by the Quantitative Proteomics Resource Core at the University of Pennsylvania. To prepare for protein samples, the protein bands from SDS-PAGE were de-stained with 100 mM ammonium bicarbonate/acetonitrile (50:50), and reduced in 10 mM dithiothreitol/100 mM ammonium bicarbonate for over 60 min in 52 °C. The bands were alkylated with 100 mM iodoacetamide in 100 mM ammonium bicarbonate at RT for 1 h in the dark. The proteins in the gel bands were digested by incubation with trypsin for overnight. The supernatant was removed and kept in fresh tubes. Additional peptides were extracted from the gel by adding 50 μL of 50% acetonitrile and 1% TFA and shaking for 10 min. The supernatants were combined and dried. The dried samples were reconstituted by 0.1% formic acid.
Desalted peptides were analyzed on a Q-Exactive HF (Thermo Scientific) attached to an Ultimate 300 nano UPLC system (Thermo Scientific). Peptides were eluted with a 25 min gradient from 2% to 32% ACN and to 98% ACN over 5 min in 0.1% formic acid. Data dependent acquisition mode with a dynamic exclusion of 45 second was enabled. One full MS scan was collected with scan range of 350 to 1200 m/z, resolution of 70 K, maximum injection time of 50 ms and AGC of 1e6. Then, a series of MS2 scans were acquired for the most abundant ions from the MS1 scan (top 15). Ions were filtered with charge 2–5. An isolation window of 1.40m/z was used with quadruple isolation mode. Ions were fragmented using higher-energy collisional dissociation (HCD) with collision energy of 28%. Orbitrap detection was used with, resolution of 35 K, maximum injection time of 54 ms and AGC of 5e4.
Database search criteria were as follows: taxonomy Homo sapiens, carboxyamidomethylated (+57 Da) at cysteine residues for fixed modifications, oxidized at methionine (+16 Da) residues, glygly(+114 Da) at lysine residues for variable modifications, two maximum allowed missed cleavage, 10 ppm MS tolerance, a 0.02-Da MS/MS tolerance. Only peptides resulting from trypsin digestion were considered. The target-decoy approach was used to filter the search results, in which the false discovery rate was less than 1% at the peptide and protein level.
In vitro deubiquitination assay.
K63-ubiquitinated ERK1 was purified as described above. To purify CYLD and CYLDCA, HEK293T cells were transfected with Flag-CYLD or Flag-CYLDCA. Cells were lysed with lysis buffer (50 mM Tris-Cl at pH 7.4, 150 mM NaCl, 1% Triton, and 1 mM DTT, supplemented with protease and phosphatase inhibitor cocktail [Thermo Scientific]). Flag-tagged proteins were immunoprecipitated with anti-Flag (M2) beads, and eluted with 3xFlag peptide. For in vitro deubiquitination assays, ubiquitinated ERK1 or Di-ubiquitin was incubated with CYLD or CYLD mutants in a deubiquitination buffer (50 mM Tris-Cl, pH 7.5, 100 mM NaCl, 5 mM MgCl2, and 10 mM DTT). Reactions were performed at 37 °C for 1 h, and terminated by 2x SDS loading buffer. Flag-ERK1 was immunoprecipitated by anti-ERK1 antibody and analyzed by Western blot.
GST pull-down assay.
Flag-tagged TRIM15, TRIM154A, CYLD, and CYLD4A purified from HEK293T cells were incubated with Glutathione Sepharose 4B beads (GE Healthcare) bound with bacterially expressed GST or GST fusion proteins in binding buffer (50 mM Tris-Cl at pH 7.4, 150 mM NaCl, 0.2% Triton, 10% glycerol, 1 mM DTT, protease inhibitor cocktail) at 4 °C overnight. The beads were washed three times with binding buffer. Input and the pull-down samples were analyzed by immunoblot.
Cell viability and colony formation assays.
Cell proliferation and viability were detected by MTT assay and crystal violet assay. For MTT assay, cells (1–3×10³ cells/well) were seeded in 96-well plates in DMEM complete medium. From the second day, 20 μL MTT (5 mg/ml) was added into each well for incubation at 37 °C for an additional 4 h, and culture media were discarded afterwards. DMSO (150 μL) was then added into the wells to dissolve the purple precipitate, and the absorbance was measured at 490 nm. All experimental data were a result of three to four replicates. The results were graphically presented using GraphPad Prism 8 (GraphPad Software). For crystal violet assay, cells (2×10³ cells/well) were seeded in 12-well plate in DMEM complete medium. Medium with or without indicated drugs was changed every two days. Cells were stained with crystal violet (0.1% in 20% methanol) at room temperature for 30 min. Colony formation was analyzed by crystal violet assay with 500–1000 cells/well in 6-well plates.
Soft agar assay.
1 × 10³ cells were mixed with culture medium containing 0.3% agar and plated on top of base agar (0.6%) that were pre-plated at 1.5 ml/well in 6-well plates. The plate was maintained at room temperature for 15 min to solidify and incubated at 37 °C incubator. After 1 to 2 weeks, colonies were observed and stained with crystal violet (0.1% in 20% methanol). All experiments were performed in triplicates. The number of colonies was counted by ImageJ.
Dual luciferase reporter assay.
Cells were plated in 96-well plate. NF-κB reporter construct (50 ng) and Renilla (5 ng) were applied in each well. Other plasmids or empty vectors were co-transfected and the amount of plasmid each well is 150 ng. At 24 h post-transfection, cells were lysed in native lysis buffer (Promega) and luciferase activity was assayed with the Dual-Luciferase Reporter Assay (E-1910, Promega) according to the manufacturer’s instructions.
ELISA assay.
The level of phosphorylated ERK1/2 was tested by a phospho-ERK1/2 (pT202/Y204) ELISA Kit (JLCa3420, JKBio) according to the manufacturer’s instructions. 50 ng proteins were used to monitor the level of phospho-ERK1. The level of phospho-ERK1 was calculated based on the curve produced with standard samples.
In vitro kinase assay.
Flag-ERK proteins immobilized on beads, as described above, were washed three times with lysis buffer, twice with kinase buffer (50 mM Hepes, pH 7.5, 50 mM NaCl, and 1 mM DTT), and pre-incubated with kinase buffer containing 2 mM MnCl2, 10 mM MgCl2, 1 mM ATP at 30 °C for 10 min. GST-ELK-1 (a.a. 307–428) was then added, and the mixture was incubated at 30 °C for 30 min with gentle agitation. Reactions were stopped by the addition of 2x SDS loading buffer, and subjected to SDS-PAGE and immunoblotting using antibody against ELK-1 phosphorylated at S383. GST-ELK-1 (307–428) was detected by Ponceau S staining.
In vivo experiments and drug administration.
Male athymic nude mice at 5–6 weeks of age (Jackson Laboratory) were used for tumor xenograft model. Mice were housed in a light/dark cycle of 12 h, in a pathogen free, temperature- and humidity-controlled room (22 °C and 45–55%, respectively). A375 cells expressing shCtrl or shTRIM15 (1×10⁶ each) were suspended in 100 μL 1:1 DMEM and Matrigel (BD Biosciences) and subcutaneously implanted in the right flank of each mouse. Treatment begun within several days after tumor was observed. PLX4032 was dissolved by solvents (4% DMSO + 30% PEG + 5% Tween 80 + ddH2O). Mice (shCtrl, N=10; shTRIM15, N=10) were randomly separated into four groups, namely shCtrl + solvents (N=5), shTRIM15 + solvents (N=5), shCtrl + PLX4032 (N=5), and shTRIM15 + PLX4032 (N=5). Mice were administrated by intraperitoneal injection of 20 mg/Kg PLX4032 once a day. The tumor size was measured every three days by digital caliper, and tumor volume was calculated by the formula: volume = length × width2/2. WM3960 cells expressing shCtrl or shTRIM15 (4×10⁶ each) were suspended in 100 μL 1:1 Tu2% medium and Matrigel and subcutaneously implanted in the right flank of each mouse (N=6). At the end of the experiment, mice were euthanized, and tumors were dissected and weighed. All animal experiments were performed in accordance with relevant guidelines and regulations and were approved by the University of Pennsylvania Institutional Animal Care and Use Committee (IACUC).
Immunohistochemistry.
A melanoma tissue array including 32 cases of primary melanoma and 16 metastatic melanoma (ME483a, US Biomax) was baked at 60 °C for 2 h followed by deparaffinization with Xylenes and rehydration through ethanol gradient. For the IHC staining of TRIM15 and CYLD, antigen retrieval was performed by heating at 95 °C in citrate buffer (10 mM sodium citrate, pH 8.5) for 30 min and cooling down to room temperature. Tissue slides were then analyzed with the Double Staining Polymer Kit (MP-7724, Vector Laboratories). Antibodies against TRIM15 (Invitrogen, 1:100) and CYLD (Proteintech, 1:50) were incubated with the sections overnight at 4 °C. IHC staining was shown as ImmPACT Vector Red (magenta). For IHC staining of phosphor-ERK1/2, antigen retrieval was performed by heating slides in a microwave submersed in citrate unmasking solution (14746, Cell Signaling) until boiling and then keeping at a sub-boiling temperature for 10 min. Cool slides to room temperature and incubate sections in 3% hydrogen peroxide for 10 min. Blocked sections were incubated with p-ERK1/2 (Cell Signaling, 1:200) at 4 °C overnight. Sections were incubated with SignalStain Boost IHC Detection Reagent (8114, Cell Signaling) at room temperature for 30 min. After washing, 400 μL Signal Stain DAB (mix 30 μL Signal DAB Chromogen Concentrate with 1 ml Signal DAB Diluent) (8059, Cell Signaling) was applied to the sections. Sections were then dehydrated, cleared in xylene and mounted on slides using DPX mounting medium (Electron Microscopy Science). Tissues were visualized and captured using an inverted fluorescence microscope (Revolve, Echo Laboratories). Immunohistochemical staining intensity scores were indicated as: negative (0), weak staining (1), moderate staining (2) and strong staining (3) and the extent of stained cells were indicated as: 0%= 0, 1–24% = 1, 25–49% = 2, 50–74% = 3, 75–100% = 4. The final scores were defined by multiplying the intensity scores with the scores of the extent of stained cells (0–12).
Melanoma gene expression database analysis.
CYLD and TRIM15 mRNA expression data (GEO DataSets: GSE61992 (ref. 56), GSE50509 (ref. 57), GSE3189 (ref. 60), and GSE7929 (ref. 59)) were downloaded from NCBI and analyzed by GraphPad Prism 8. CYLD gene expression and patient survival data of The Cancer Genome Atlas (TCGA) Skin Cutaneous Melanoma dataset were downloaded from OncoLnc (www.oncolnc.org) and analyzed by GraphPad Prism 8. CYLD gene comparison of normal skin and SKCM, and the correlation of patient survival and the level of CYLD gene expression were analyzed online on GEPIA website (gepia.cancer-pku.cn).
Statistics and reproducibility.
Quantification was performed by GraphPad Prism 8 (GraphPad Software) or Excel 2013. A two-tailed Student’s t-test or One-way ANOVA followed by Tukey’s post hoc test was used to evaluate the statistical significance between the mean value of more than two groups. P values are indicated in Figure legends. P < 0.05 was considered as statistical significance. Immunoblots shown are representative of two independent experiments with similar results, except for Fig. 5m, where the results represent three independent experiments. Cell viability, colony formation, ELISA and dual luciferase reporter assays have been performed three times with similar results unless specified in the legends. Mass spectrometry and immunohistochemistry assays have been performed two times with similar results unless specified in the legends.
Data availability.
The dataset from these resource that supports the findings of this study is available at OncoLnc (http://www.oncolnc.org), GEPIA (http://gepia.cancer-pku.cn) and cBioPortal (https://www.cbioportal.org). Publicly melanoma datasets used in this study were deposited under the accession numbers GSE3189, GSE7929, GSE61992 and GSE50509. All other data that support the findings of this study are available from the corresponding author on reasonable request. Unprocessed blots have been provided for Figs. 1a–k, 2a–m, 3a–c,e,g–i,k,l, 4a–l, 5b–m, 6a–l, 7c,e,l,m,o, and Extended Data Figs. 1a–d, 2a,c–g, 4a,b,d–g,j, 5a–h, 6a–h, 7c–e,g,h. Source data have been provided for Figs. 5n, 6l, 7a,b,f–i,k,n,q, 8b–i, and Extended Data Figs. 7e,f, d, 8b,c,h,i,k, 9a–c.
Extended Data
Extended Data Fig. 1. Identification of TRIM15 as a ubiquitin ligasefor ERK.
a, Screening of human TRIM proteins for ERK1 ubiquitination. HEK293T cells were transfected with Flag-ERK1 and each of the first eighteen human TRIMs. 24 h after transfection, cell lysates were made in SDS-containing buffer, diluted, and immunoprecipitated (denaturing IP or d-IP) with anti-Flag antibody.Immunoprecipitates were analyzed for ERK1 ubiquitination by Western blot using ubiquitin antibody and for sample loading by Ponceau S staining. HC, heavy chain. n.s., non-specific. b, TRIM15, but not TRIM17, promotes ERK1 ubiquitination. HEK293T cells were transfected with TRIM15 or TRIM17, together with Flag-ERK1 and HA-Ub. Flag-ERK1 was immunoprecipitated. d-IPsamples and whole cell lysates (WCL) were analyzed by Western blot. c, HEK293T cells transfected with Flag-ERK1, HA-TRIM15, and wild-type (WT) or mutant ubiquitinproteins as indicated were analyzed for Flag-ERK1 ubiquitination with both anti-ubiquitin (Ub) and anti-HA antibodies and for protein expression. d, HEK293T cells transfected with Flag-ERK1, HA-Ub, HA-TRIM15, and Myc-TRAF2as indicated were analyzedfor Flag-ERK1 ubiquitination and protein expression.
Extended Data Fig. 2. Expression of TRIM15 in melanoma cells and its role in ERK activation.
a, Expression of TRIM15 and CYLD, and phosphorylation of ERK1/2 and ELK-1, in melanoma cell lines. b, Tumor cell lines used in the current work and the status of BRAF, NRAS, and KRAS mutations. WM3960 was a cell line established from patient-derived xenografts (PDX) tumors58. c, HEK293T cells transfected with Flag-ERK1 and/or HA-TRIM15 were analyzed for Flag-ERK1 phosphorylation by anti-Flag d-IP, followed by Western blot. d, e, ERK1/2 activation in HT29 cells (which harbors BRAFV600E) stably expressing control (shCtrl) or one of the two independent TRIM15 shRNAs (#1 and #2) (d), and in parental and TRIM15-knockout SK-MEL-173 cells (e). f, g, Levels of cyclin D1 and BCL2 proteins in A375 cells transfected with control (Ctrl) or TRIM15 siRNA (f), or treated with vehicle (DMSO) or trametinib (2 μM) for 24 h.
Extended Data Fig. 3. Mass-spectrometry analysis of ERK1 for potential ubiquitination sites.
Flag-ERK1 protein co-expressed with HA-TRIM15 in HEK293T cells (Flag-ERK1Ub) were purified and analyzed by mass spectrometry. Shown are ubiquitination sites of ERK1 (a), and mass spectrum of peptides surrounding K168 (b) and K302 (c). Ubiquitination at K302 was detected when a relatively small amount of Flag-ERK1Ub protein was used, while ubiquitination at K168 was detected only when a relatively large amount of Flag ERK1Ub protein was used, suggesting that ubiquitination at K302 was more abundant than that at K168.
Extended Data Fig. 4. TRIM15 activates ERK1/2 by ubiquitinating them on specific Lys residues.
a, b, HEK293T cells transfected with wild-type or mutant Flag-ERK1, HA-Ub, and TRIM15-YFP were analyzed for Flag-ERK1 ubiquitination.c, Alignment of human ERK1 (total 379 aa) and mouse ERK2 (total 360 aa) sequences around the ubiquitination sites, which are indicated in red color. d, D14 (left) and SK-MEL-28 (right) cells transducedwith control lentiviral vector (Vector) or lentiviral vector expressing Flag-ERK1or Flag-ERK12KRwere analyzed for activation of Flag-ERK1/ERK12KRand phosphorylation of ELK-1.e, Flag-ERK1 or Flag-ERK12KRexpressed in HEK293T cells were immunoprecipitated (IP)with anti-Flag mAb (M2) beadsand analyzed for phosphorylation.f, A375 cells transducedwith control lentiviral vector or lentiviral vector expressing Flag-ERK1, Flag-ERK12KR, Flag-ERK2, or Flag-ERK22KRwere treated with or without 2 μM PLX4032 (PLX) for 24 h. Bright field images ofcells areshown. Scalebar, 100 μm.g, Flag-tagged ERK1, ERK2, and TRIM15 proteins purified from HEK293T cells, and His-Ub and His-Ub K63R purchased from a commercial source, were analyzed by SDS-PAGE and Coomassie blue staining. h, i, Ribbon diagram of human ERK1 structure (PDB ID: 2ZOQ) around K302 (h) and K168 (i), analyzed by PyMOL 2.0. Two α-helix domains(αF and αH), keyresidues, activation loop, and catalytic loop areindicated.j, A375 cells stably expressing Flag-ERK1 and Flag-ERK1K302Rwere analyzed for activation of Flag-ERK1/ERK1K302Rand endogenous ERK1/2.
Extended Data Fig. 5. TRIM15 interacts with ERK1/2 and promotes their association with MEK.
a, Interaction of endogenous TRIM15 and ERK1/2 in A375 cells was analyzed by co-immunoprecipitation (co-IP) assay with control IgG and anti-ERK1/2 antibody. b, Direct TRIM15-ERK1 interaction in vitroand its dependence on the ERK1 CD domain. Purified Flag-TRIM15protein was incubated with purified GST, GST-ERK1, or GST-ERK12DNimmobilized on beads. Pulldown samples and 5% of input TRIM15 were analyzed by Western blot (top) and Ponceau S staining(bottom). c, d, Ubiquitination of ERK1 does not affect its binding to ATP. Flag-ERK1 (c, d), Flag-ERK1Ub (c), and Flag-ERK1K302R(d) were analyzed for interaction with the ATP derivatives 6AH-ATP and AP-ATP conjugated to agarose beads in a pulldown assay. e, f, Ubiquitination of ERK1 does not affect its binding toELK-1. Flag-ERK1 (e, f), Flag-ERK1Ub (e), and Flag-ERK1K302R(f) were analyzed for interaction with GST and GST-ELK-1 bound to glutathione resins. g, TRIM15 does not affect ERK1-ELK-1 binding in cells. Flag-ERK1 was expressed alone or together with HA-TRIM15 in HEK293T cells. The interaction of Flag-ERK1 with endogenous EKL-1 was analyzed by co-IP. h, Knockdown of TRIM15 decreases ERK1/2-MEK1/2 association. Interaction of endogenous ERK1/2 with MEK1/2 in A375 cells stably expressing control or TRIM15 shRNAwere analyzed by co-IP.
Extended Data Fig. 6. CYLD inhibitsERK1/2 activity and their interaction with MEK1/2.
a, Knockout Cyldin MEFs increases ERK1/2 activity. Cyld+/+MEFs and Cyld−/−MEFs were analyzed for ERK1 and ELK-1 phosphorylation and CYLD expression by Western blot.b, Interaction of endogenous CYLD and ERK1/2 in A375 cells was analyzed by co-IP with anti-ERK1/2 antibody. c, CYLD4Ahas weakened ability to inactivate ERK1/2. A375 cells were infected with empty pCDH (EV), pCDH-CYLD, or pCDH-CYLD4A lentiviral vector.Cell lysates were examined for ERK1/2 activation and CYLD/CYLD4Aexpression.d, CYLD4Ais still able to deubiquitinate TRAF2. Myc-TRAF2 and HA-Ub were expressed in the presence or absence of Flag-CYLD4Aand Flag-CYLDCA in HEK293T cells. Ubiquitination of Myc-TRAF2 was examined by d-IP with anti-Myc antibody.e, CYLD shows reduced interaction with ERK12DN. Flag-CYLD was incubated with immobilized GST, GST-ERK1, or GST-ERK12DN. The pulldown samples and input were analyzed by SDS-PAGE followed by Western blot and/or Ponceau S staining.f, Knockdown of CYLD increases ERK1-TRIM15 interaction. HEK293T cells were treated with NC or CYLD siRNA, and transfected with HA-TRIM15 alone or together with Flag-ERK1.Interaction between TRIM15 and ERK1 was assayed by co-IP with anti-Flag antibody.g, Knockout of CYLD increases TRIM15-ERK1/2 interaction.Cyld+/+and Cyld−/−MEFs were analyzed for TRIM15-ERK1/2 interaction using co-IP with anti-ERK1/2 antibody.h, Interaction of Flag-ERK1 with endogenous MEK1 in HEK293T cells stably expressing shCtrl or shCYLD.
Extended Data Fig. 7. Distinct signaling specificities of CYLD and TRIM15.
a, Frequency of CYLD mutations in melanoma (cBioPortal).b, Schematic paragraph showing melanoma-derived point mutants. CAP-GLY, cytoskeleton-associated protein (CAP)-glycine-rich (GLY) domain; USP, ubiquitin-specific protease.c, In vitrodeubiquitination of Di-Ub by CYLD or CYLD mutants. Di-Ub was incubated withpurified CYLD or CYLD mutants, and reaction mixtures were analyzed by Western blot (top) and Ponceau S staining (bottom).d, In vitrodeubiquitination of Flag-ERK1-Ub by CYLD or CYLD mutants. Ubiquitinated Flag-ERK1 protein (Flag-ERK1-Ub) was treated withCYLD or the indicated CYLD mutants. De-ubiquitination was analyzed by Western blot with anti-ERK antibody.e, NF-κB reporter assays show the effect of wild-type (WT) and mutant CYLD proteins on TRAF2-induced NF-κB signaling in HEK293T cells. Data are Mean ±SD(n= 3 biologically independent samples). ****P< 0.0001, One-way ANOVA followed by Tukey’s multiple comparisons test.f, NF-κB reporter assay show no effect of TRIM15 on NF-κB signaling in HEK293T cells. Data are Mean ±SD(n = 3 biologically independent samples).g, Immunoblot of whole cell lysates from A375 cells treated with PLX4032 (2 μM) or trametinib (1 μM) for 24 h.h, Immunoblot of total cell lysates from A375 cells expressing control or TRIM15 shRNA.
Extended Data Fig. 8. TRIM15 is critical forthe survival of melanoma cells.
a, b, A375 cellsexpressing control or TRIM15 shRNA were grown on adherent plates. Shown are representative images (a) and relative number (b) of colonies. Data areMean ±SD(n = 3biologically independent samples). *** P< 0.001, two-tailed Student’s t-test.c, A375 cellsexpressing control shRNA, or expressing TRIM15 shRNA and transfected with EV, TRIM15, or TRIM15ΔRB, were grown on adherent plates. Relative numbers of coloniesare shownas Mean ±SD(n = 3biologically independent samples). *** P< 0.001, n.s., no significance, one-way ANOVA test followed by Tukey’s post hoc test. d, Adherent colony formation by control or TRIM15-knockdown A375 cells that were transfected with siCtrl or siCYLD. e,Soft agar colony formation by A375 cells stably expressing shCtrl or shTRIM15 and transfected with or without TRIM15 or TRIM15ΔRB. f, Soft agar colony formationof SK-MEL-28 cells stably expressing control or TRIM15 shRNA, or expressing TRIM15 shRNA and transfected with Flag-ERK1R84S.g, Control or TRIM15-knockdown A375 cellsgrew on adherent plates for 6 days in the presence of indicated concentration of PLX4032, and stained with Crystal violet. h,Weightsof micethat underwent the indicated treatment for two weeks. Data were shown as Mean ±SD(n = 5 biologically independent animals). i, Relative survival of A375 and A375R cells treated with increasing concentrations of PLX4032. Data were shown as Mean ±SD(n =4 biologically independent samples).j, k, A375Rcellsexpressing control or TRIM15 shRNA were grown on adherent plates and stained with crystal violet. Shown are representative images (j) and relative colony number (k). Data are Mean ±SD(n = 3biologically independent samples).* P< 0.05, two-tailed Student’s t-test.
Extended Data Fig. 9. TRIM15expression in treated and untreated melanoma specimens, and correlation of high TRIM15 and low CYLD expression with poor prognosis of melanoma patients.
a, TRIM15 expression in eleven melanoma samples that initially responded but subsequently progressed on the combined treatment of the BRAF inhibitor dabrafenib and the MEK inhibitor trametinib (treated), and nine matched pre-treatment tumor samples (untreated), based on the microarray dataset (GSE61992)56. The minimum, 25% percentile, median, 75% percentile, maxima are −9.271, −8.848, −8.118, −6.084, and −4.756, respectively, for untreated group; and −9.734, −7.84, −5.619, −4.041, and 3.549, respectively, for treated group. b, c, Average TRIM15 expression in 38 tumors that were treated the BRAF inhibitor dabrafenib or vemurafenib but subsequently progressed (treated) and 21 matched pretreatment tumors (untreated) (b), and TRIM15 expression in 21 matched treated and untreated samples (c). Note that TRIM15 was highly upregulated in two samples (#6 and #21). The results are from the microarray dataset (GSE50509)57. For b, the minimum, 25% percentile, median, 75% percentile, maxima for are −5.492, 1.99, 3.811, 9.627, and 13.59, respectively, for untreated group;and −4.804, 1.927, 4.814, 11.56, and 35.71, respectively, for treated group. d, Frequency of TRIM15 alterations in cancers (cBioPortal). e, CYLD mRNA expression in normal skin and SKCM. Results were analyzed on GEPIA website.****P<0.0001, two-sided Student’s t-test. f, Poor survival of melanoma patients withlow CYLD expression. Results were analyzed on GEPIA website.
Supplementary Material
Acknowledgments
We thank Y. Zhao, J. L. Riley, S. Eblen, A. Catling, I. Asangani, W. Mothes, and P. Uchil for plasmids and/or cell lines, and W. Wu, H. Li, X. Su, Y. Xu, R. Wang, S. Ghaisas, D. Harischandra and K. Lv for technical assistance. Supported by grants from NIH (R01CA182675, R01CA184867, R01CA235760, and R01CA243520) to X.Y.
Footnotes
Competing interests
The authors declare no competing interests.
References
- 1.Morrison DK MAP kinase pathways. Cold Spring Harb Perspect Biol 4 (2012). [DOI] [PMC free article] [PubMed] [Google Scholar]
- 2.Shaul YD & Seger R. The MEK/ERK cascade: from signaling specificity to diverse functions. Biochim Biophys Acta 1773, 1213–1226 (2007). [DOI] [PubMed] [Google Scholar]
- 3.Lavoie H, Gagnon J. & Therrien M. ERK signalling: a master regulator of cell behaviour, life and fate. Nat Rev Mol Cell Biol 21, 607–632 (2020). [DOI] [PubMed] [Google Scholar]
- 4.Vogelstein B. et al. Cancer genome landscapes. Science 339, 1546–1558 (2013). [DOI] [PMC free article] [PubMed] [Google Scholar]
- 5.Johannessen CM et al. COT drives resistance to RAF inhibition through MAP kinase pathway reactivation. Nature 468, 968–972 (2010). [DOI] [PMC free article] [PubMed] [Google Scholar]
- 6.Nazarian R. et al. Melanomas acquire resistance to B-RAF(V600E) inhibition by RTK or N-RAS upregulation. Nature 468, 973–977 (2010). [DOI] [PMC free article] [PubMed] [Google Scholar]
- 7.Villanueva J. et al. Acquired resistance to BRAF inhibitors mediated by a RAF kinase switch in melanoma can be overcome by cotargeting MEK and IGF-1R/PI3K. Cancer Cell 18, 683–695 (2010). [DOI] [PMC free article] [PubMed] [Google Scholar]
- 8.Samatar AA & Poulikakos PI Targeting RAS-ERK signalling in cancer: promises and challenges. Nat Rev Drug Discov 13, 928–942 (2014). [DOI] [PubMed] [Google Scholar]
- 9.Ryan MB, Der CJ, Wang-Gillam A. & Cox AD Targeting RAS-mutant cancers: is ERK the key? Trends Cancer 1, 183–198 (2015). [DOI] [PMC free article] [PubMed] [Google Scholar]
- 10.Komander D. & Rape M. The ubiquitin code. Annu Rev Biochem 81, 203–229 (2012). [DOI] [PubMed] [Google Scholar]
- 11.Deng L. et al. Activation of the IkappaB kinase complex by TRAF6 requires a dimeric ubiquitin-conjugating enzyme complex and a unique polyubiquitin chain. Cell 103, 351–361 (2000). [DOI] [PubMed] [Google Scholar]
- 12.Wang C. et al. TAK1 is a ubiquitin-dependent kinase of MKK and IKK. Nature 412, 346–351 (2001). [DOI] [PubMed] [Google Scholar]
- 13.Yang WL et al. The E3 ligase TRAF6 regulates Akt ubiquitination and activation. Science 325, 1134–1138 (2009). [DOI] [PMC free article] [PubMed] [Google Scholar]
- 14.Chan CH et al. The Skp2-SCF E3 ligase regulates Akt ubiquitination, glycolysis, herceptin sensitivity, and tumorigenesis. Cell 149, 1098–1111 (2012). [DOI] [PMC free article] [PubMed] [Google Scholar]
- 15.Chen ZJ & Sun LJ Nonproteolytic functions of ubiquitin in cell signaling. Mol Cell 33, 275–286 (2009). [DOI] [PubMed] [Google Scholar]
- 16.Kulathu Y. & Komander D. Atypical ubiquitylation - the unexplored world of polyubiquitin beyond Lys48 and Lys63 linkages. Nat Rev Mol Cell Biol 13, 508–523 (2012). [DOI] [PubMed] [Google Scholar]
- 17.Yau R. & Rape M. The increasing complexity of the ubiquitin code. Nat Cell Biol 18, 579–586 (2016). [DOI] [PubMed] [Google Scholar]
- 18.Ozato K, Shin DM, Chang TH & Morse HC 3rd TRIM family proteins and their emerging roles in innate immunity. Nat Rev Immunol 8, 849–860 (2008). [DOI] [PMC free article] [PubMed] [Google Scholar]
- 19.Hatakeyama S. TRIM proteins and cancer. Nat Rev Cancer 11, 792–804 (2011). [DOI] [PubMed] [Google Scholar]
- 20.Guo L. et al. A cellular system that degrades misfolded proteins and protects against neurodegeneration. Mol Cell 55, 15–30 (2014). [DOI] [PMC free article] [PubMed] [Google Scholar]
- 21.Chen L, Zhu G, Johns EM & Yang X. TRIM11 activates the proteasome and promotes overall protein degradation by regulating USP14. Nat Commun 9, 1223 (2018). [DOI] [PMC free article] [PubMed] [Google Scholar]
- 22.Chen L. et al. Enhanced degradation of misfolded proteins promotes tumorigenesis. Cell Rep 18, 3143–3154 (2017). [DOI] [PMC free article] [PubMed] [Google Scholar]
- 23.Liu Y. et al. TRIM25 promotes the cell survival and growth of hepatocellular carcinoma through targeting Keap1-Nrf2 pathway. Nat Commun 11, 348 (2020). [DOI] [PMC free article] [PubMed] [Google Scholar]
- 24.Zhu G. et al. TRIM11 Prevents and Reverses Protein Aggregation and Rescues a Mouse Model of Parkinson’s Disease. Cell Rep 33, 108418 (2020). [DOI] [PMC free article] [PubMed] [Google Scholar]
- 25.Pertel T. et al. TRIM5 is an innate immune sensor for the retrovirus capsid lattice. Nature 472, 361–365 (2011). [DOI] [PMC free article] [PubMed] [Google Scholar]
- 26.Li Q. et al. Tripartite motif 8 (TRIM8) modulates TNFalpha- and IL-1beta-triggered NF-kappaB activation by targeting TAK1 for K63-linked polyubiquitination. Proc Natl Acad Sci U S A 108, 19341–19346 (2011). [DOI] [PMC free article] [PubMed] [Google Scholar]
- 27.McEwan WA et al. Intracellular antibody-bound pathogens stimulate immune signaling via the Fc receptor TRIM21. Nat Immunol 14, 327–336 (2013). [DOI] [PMC free article] [PubMed] [Google Scholar]
- 28.Gack MU et al. TRIM25 RING-finger E3 ubiquitin ligase is essential for RIG-I-mediated antiviral activity. Nature 446, 916–920 (2007). [DOI] [PubMed] [Google Scholar]
- 29.Lopez-Bergami P. et al. Rewired ERK-JNK signaling pathways in melanoma. Cancer Cell 11, 447–460 (2007). [DOI] [PMC free article] [PubMed] [Google Scholar]
- 30.McGill GG et al. Bcl2 regulation by the melanocyte master regulator Mitf modulates lineage survival and melanoma cell viability. Cell 109, 707–718 (2002). [DOI] [PubMed] [Google Scholar]
- 31.Kim YJ, Tsang T, Anderson GR, Posimo JM & Brady DC Inhibition of BCL2 Family Members Increases the Efficacy of Copper Chelation in BRAF(V600E)-Driven Melanoma. Cancer Res 80, 1387–1400 (2020). [DOI] [PMC free article] [PubMed] [Google Scholar]
- 32.Chapman PB et al. Improved survival with vemurafenib in melanoma with BRAF V600E mutation. N Engl J Med 364, 2507–2516 (2011). [DOI] [PMC free article] [PubMed] [Google Scholar]
- 33.Goetz EM, Ghandi M, Treacy DJ, Wagle N. & Garraway LA ERK mutations confer resistance to mitogen-activated protein kinase pathway inhibitors. Cancer research 74, 7079–7089 (2014). [DOI] [PMC free article] [PubMed] [Google Scholar]
- 34.Bardwell L. & Thorner J. A conserved motif at the amino termini of MEKs might mediate high-affinity interaction with the cognate MAPKs. Trends Biochem Sci 21, 373–374 (1996). [PubMed] [Google Scholar]
- 35.Tanoue T. & Nishida E. Molecular recognitions in the MAP kinase cascades. Cell Signal 15, 455–462 (2003). [DOI] [PubMed] [Google Scholar]
- 36.Tanoue T, Adachi M, Moriguchi T. & Nishida E. A conserved docking motif in MAP kinases common to substrates, activators and regulators. Nat Cell Biol 2, 110–116 (2000). [DOI] [PubMed] [Google Scholar]
- 37.Kinoshita T. et al. Crystal structure of human mono-phosphorylated ERK1 at Tyr204. Biochem Biophys Res Commun 377, 1123–1127 (2008). [DOI] [PubMed] [Google Scholar]
- 38.Taylor SS & Kornev AP Protein kinases: evolution of dynamic regulatory proteins. Trends in biochemical sciences 36, 65–77 (2011). [DOI] [PMC free article] [PubMed] [Google Scholar]
- 39.Roskoski R Jr. ERK1/2 MAP kinases: structure, function, and regulation. Pharmacol Res 66, 105–143 (2012). [DOI] [PubMed] [Google Scholar]
- 40.Alessi DR et al. Identification of the sites in MAP kinase kinase-1 phosphorylated by p74raf-1. EMBO J 13, 1610–1619 (1994). [DOI] [PMC free article] [PubMed] [Google Scholar]
- 41.Mevissen TET & Komander D. Mechanisms of Deubiquitinase Specificity and Regulation. Annu Rev Biochem 86, 159–192 (2017). [DOI] [PubMed] [Google Scholar]
- 42.Clague MJ, Urbe S. & Komander D. Breaking the chains: deubiquitylating enzyme specificity begets function. Nat Rev Mol Cell Biol 20, 338–352 (2019). [DOI] [PubMed] [Google Scholar]
- 43.Lu Z, Xu S, Joazeiro C, Cobb MH & Hunter T. The PHD domain of MEKK1 acts as an E3 ubiquitin ligase and mediates ubiquitination and degradation of ERK1/2. Mol Cell 9, 945–956 (2002). [DOI] [PubMed] [Google Scholar]
- 44.Zhang Y. et al. Nitration-induced ubiquitination and degradation control quality of ERK1. Biochem J 476, 1911–1926 (2019). [DOI] [PMC free article] [PubMed] [Google Scholar]
- 45.Bignell GR et al. Identification of the familial cylindromatosis tumour-suppressor gene. Nat Genet 25, 160–165 (2000). [DOI] [PubMed] [Google Scholar]
- 46.Sun SC CYLD: a tumor suppressor deubiquitinase regulating NF-kappaB activation and diverse biological processes. Cell Death Differ 17, 25–34 (2010). [DOI] [PMC free article] [PubMed] [Google Scholar]
- 47.Massoumi R. et al. Down-regulation of CYLD expression by Snail promotes tumor progression in malignant melanoma. J Exp Med 206, 221–232 (2009). [DOI] [PMC free article] [PubMed] [Google Scholar]
- 48.Trompouki E. et al. CYLD is a deubiquitinating enzyme that negatively regulates NF-kappaB activation by TNFR family members. Nature 424, 793–796 (2003). [DOI] [PubMed] [Google Scholar]
- 49.Brummelkamp TR, Nijman SM, Dirac AM & Bernards R. Loss of the cylindromatosis tumour suppressor inhibits apoptosis by activating NF-kappaB. Nature 424, 797–801 (2003). [DOI] [PubMed] [Google Scholar]
- 50.Kovalenko A. et al. The tumour suppressor CYLD negatively regulates NF-kappaB signalling by deubiquitination. Nature 424, 801–805 (2003). [DOI] [PubMed] [Google Scholar]
- 51.Levin-Salomon V, Kogan K, Ahn NG, Livnah O. & Engelberg D. Isolation of intrinsically active (MEK-independent) variants of the ERK family of mitogen-activated protein (MAP) kinases. J Biol Chem 283, 34500–34510 (2008). [DOI] [PMC free article] [PubMed] [Google Scholar]
- 52.Davies H. et al. Mutations of the BRAF gene in human cancer. Nature 417, 949–954 (2002). [DOI] [PubMed] [Google Scholar]
- 53.Flaherty KT et al. Inhibition of mutated, activated BRAF in metastatic melanoma. N Engl J Med 363, 809–819 (2010). [DOI] [PMC free article] [PubMed] [Google Scholar]
- 54.Bollag G. et al. Clinical efficacy of a RAF inhibitor needs broad target blockade in BRAF-mutant melanoma. Nature 467, 596–599 (2010). [DOI] [PMC free article] [PubMed] [Google Scholar]
- 55.Planchard D. et al. Dabrafenib plus trametinib in patients with previously treated BRAF(V600E)-mutant metastatic non-small cell lung cancer: an open-label, multicentre phase 2 trial. Lancet Oncol 17, 984–993 (2016). [DOI] [PMC free article] [PubMed] [Google Scholar]
- 56.Long GV et al. Increased MAPK reactivation in early resistance to dabrafenib/trametinib combination therapy of BRAF-mutant metastatic melanoma. Nat Commun 5, 5694 (2014). [DOI] [PubMed] [Google Scholar]
- 57.Rizos H. et al. BRAF inhibitor resistance mechanisms in metastatic melanoma: spectrum and clinical impact. Clin Cancer Res 20, 1965–1977 (2014). [DOI] [PubMed] [Google Scholar]
- 58.Krepler C. et al. A Comprehensive Patient-Derived Xenograft Collection Representing the Heterogeneity of Melanoma. Cell Rep 21, 1953–1967 (2017). [DOI] [PMC free article] [PubMed] [Google Scholar]
- 59.Xu L. et al. Gene expression changes in an animal melanoma model correlate with aggressiveness of human melanoma metastases. Molecular cancer research : MCR 6, 760–769 (2008). [DOI] [PMC free article] [PubMed] [Google Scholar]
- 60.Talantov D. et al. Novel genes associated with malignant melanoma but not benign melanocytic lesions. Clinical cancer research : an official journal of the American Association for Cancer Research 11, 7234–7242 (2005). [DOI] [PubMed] [Google Scholar]
- 61.Uchil PD et al. TRIM15 is a focal adhesion protein that regulates focal adhesion disassembly. J Cell Sci 127, 3928–3942 (2014). [DOI] [PMC free article] [PubMed] [Google Scholar]
- 62.Yang WL et al. Cycles of ubiquitination and deubiquitination critically regulate growth factor-mediated activation of Akt signaling. Sci Signal 6, ra3 (2013). [DOI] [PMC free article] [PubMed] [Google Scholar]
- 63.Tang J. et al. Critical role for Daxx in regulating Mdm2. Nat Cell Biol 8, 855–862 (2006). [DOI] [PubMed] [Google Scholar]
- 64.Jiang P. et al. p53 regulates biosynthesis through direct inactivation of glucose-6-phosphate dehydrogenase. Nat Cell Biol 13, 310–316 (2011). [DOI] [PMC free article] [PubMed] [Google Scholar]
Associated Data
This section collects any data citations, data availability statements, or supplementary materials included in this article.
Supplementary Materials
Data Availability Statement
The dataset from these resource that supports the findings of this study is available at OncoLnc (http://www.oncolnc.org), GEPIA (http://gepia.cancer-pku.cn) and cBioPortal (https://www.cbioportal.org). Publicly melanoma datasets used in this study were deposited under the accession numbers GSE3189, GSE7929, GSE61992 and GSE50509. All other data that support the findings of this study are available from the corresponding author on reasonable request. Unprocessed blots have been provided for Figs. 1a–k, 2a–m, 3a–c,e,g–i,k,l, 4a–l, 5b–m, 6a–l, 7c,e,l,m,o, and Extended Data Figs. 1a–d, 2a,c–g, 4a,b,d–g,j, 5a–h, 6a–h, 7c–e,g,h. Source data have been provided for Figs. 5n, 6l, 7a,b,f–i,k,n,q, 8b–i, and Extended Data Figs. 7e,f, d, 8b,c,h,i,k, 9a–c.


