

Introductory paragraph
Plasma SARS-CoV-2 RNA may represent a viable diagnostic alternative to respiratory RNA levels that rapidly decline after infection. RT-qPCR reference assays exhibit poor performance with plasma, likely reflecting dilution and degradation of viral RNA released into the circulation, but these issues could be addressed by analyzing viral RNA packaged into extracellular vesicles (EVs). Herein we describe an assay approach where EVs directly captured from plasma are fused with reagent-loaded liposomes to sensitively amplify and detect a SARS-CoV-2 gene target. This approach accurately diagnosed COVID-19 patients, including challenging cases missed by RT-qPCR. SARS-CoV-2-positive EVs were detected at day one post-infection, and plateaued from day six to the day 28 endpoint in a non-human primate model, while 20–60 day signal durations were observed in young children. This nanotechnology approach, which uses a non-infectious sample, could thus improve COVID-19 diagnosis by extending virus detection windows to identify COVID-19 cases missed by current assays.
Keywords: Extracellular vesicles, COVID-19, SARS-CoV-2, Liposome fusion, Blood test, RT-RPA, CRISPR, Lysate free assay
Reverse-transcriptase quantitative polymerase chain reaction (RT-qPCR) analysis of respiratory samples is the gold-standard for COVID-19 diagnosis1, but has limitations. SARS-CoV-2 RNA levels in the upper respiratory tract rapidly decrease after infection2 while lower respiratory tract levels remain high3. RT-qPCR assays performed after early SARS-CoV-2 infection may thus yield false-negatives, but infection events are often unclear, complicating interpretation. Nasopharyngeal tissue highly expresses angiotensin converting enzyme 24, the primary receptor for SARS-CoV-25, but this protein is also expressed in other tissues (e.g., cardiac and small intestine6) reported to develop SARS-CoV-2 infections and related pathology7. Nasopharyngeal RT-qPCR assay results thus may not accurately reflect the status of lower respiratory tract or extrapulmonary infections.
Circulating SARS-CoV-2 RNA detectable in mild to severe COVID-19 correlates with and predicts disease severity8–10, and appears responsible for extrapulmonary infections7. However, RT-qPCR exhibits poor overall sensitivity for SARS-CoV-2 RNA in plasma (≤ 41%)11. More sensitive and robust blood-based SARS-COV-2 RNA assays compatible with routine clinical tests could thus improve COVID-19 diagnosis and prognostic evaluation. However, only two studies employing droplet digital RT-PCR, which is not suited for clinical used, have used ultrasensitive approaches to detect SARS-CoV-2 RNA in serum or plasma.
Infected cells can secrete EVs containing pathogen-derived factors12,13, protecting these factors from hydrolases and allowing them to accumulate in the circulation14. Hepatitis A and C can infect cells by EV-mediated transfer of their viral genomes15, suggesting that SARS-CoV-2 might utilize a similar mechanism. Such virus-loaded EVs might thus serve as indicators of systemic viral load and disease severity, but most EV isolation and analysis methods are not feasible for clinical applications.
This study describes the development of an assay where EVs captured directly from plasma by an antibody to the EV surface protein CD81 are fused with liposomes containing RT, recombinase polymerase amplification (RPA), and CRISPR/Cas12a reagents, using a clinically viable workflow similar to diagnostic ELISAs (Fig. 1a). In this assay, guide-RNA directs CRISPR/Cas12a binding to an RT-RPA amplicon, inducing concentration-dependent cleavage of a quenched oligonucleotide probe for ultrasensitive detection of SARS-CoV-2 RNA (Supplementary Figure 1). This approach employs two mature technologies: antibody-mediated capture and liposome-mediated reagent delivery16, while extensive literature describes liposome synthesis and stabilization methods for clinical applications.
Figure 1. RT-RPA-CRISPR liposome design, characterization, and functional evaluation.
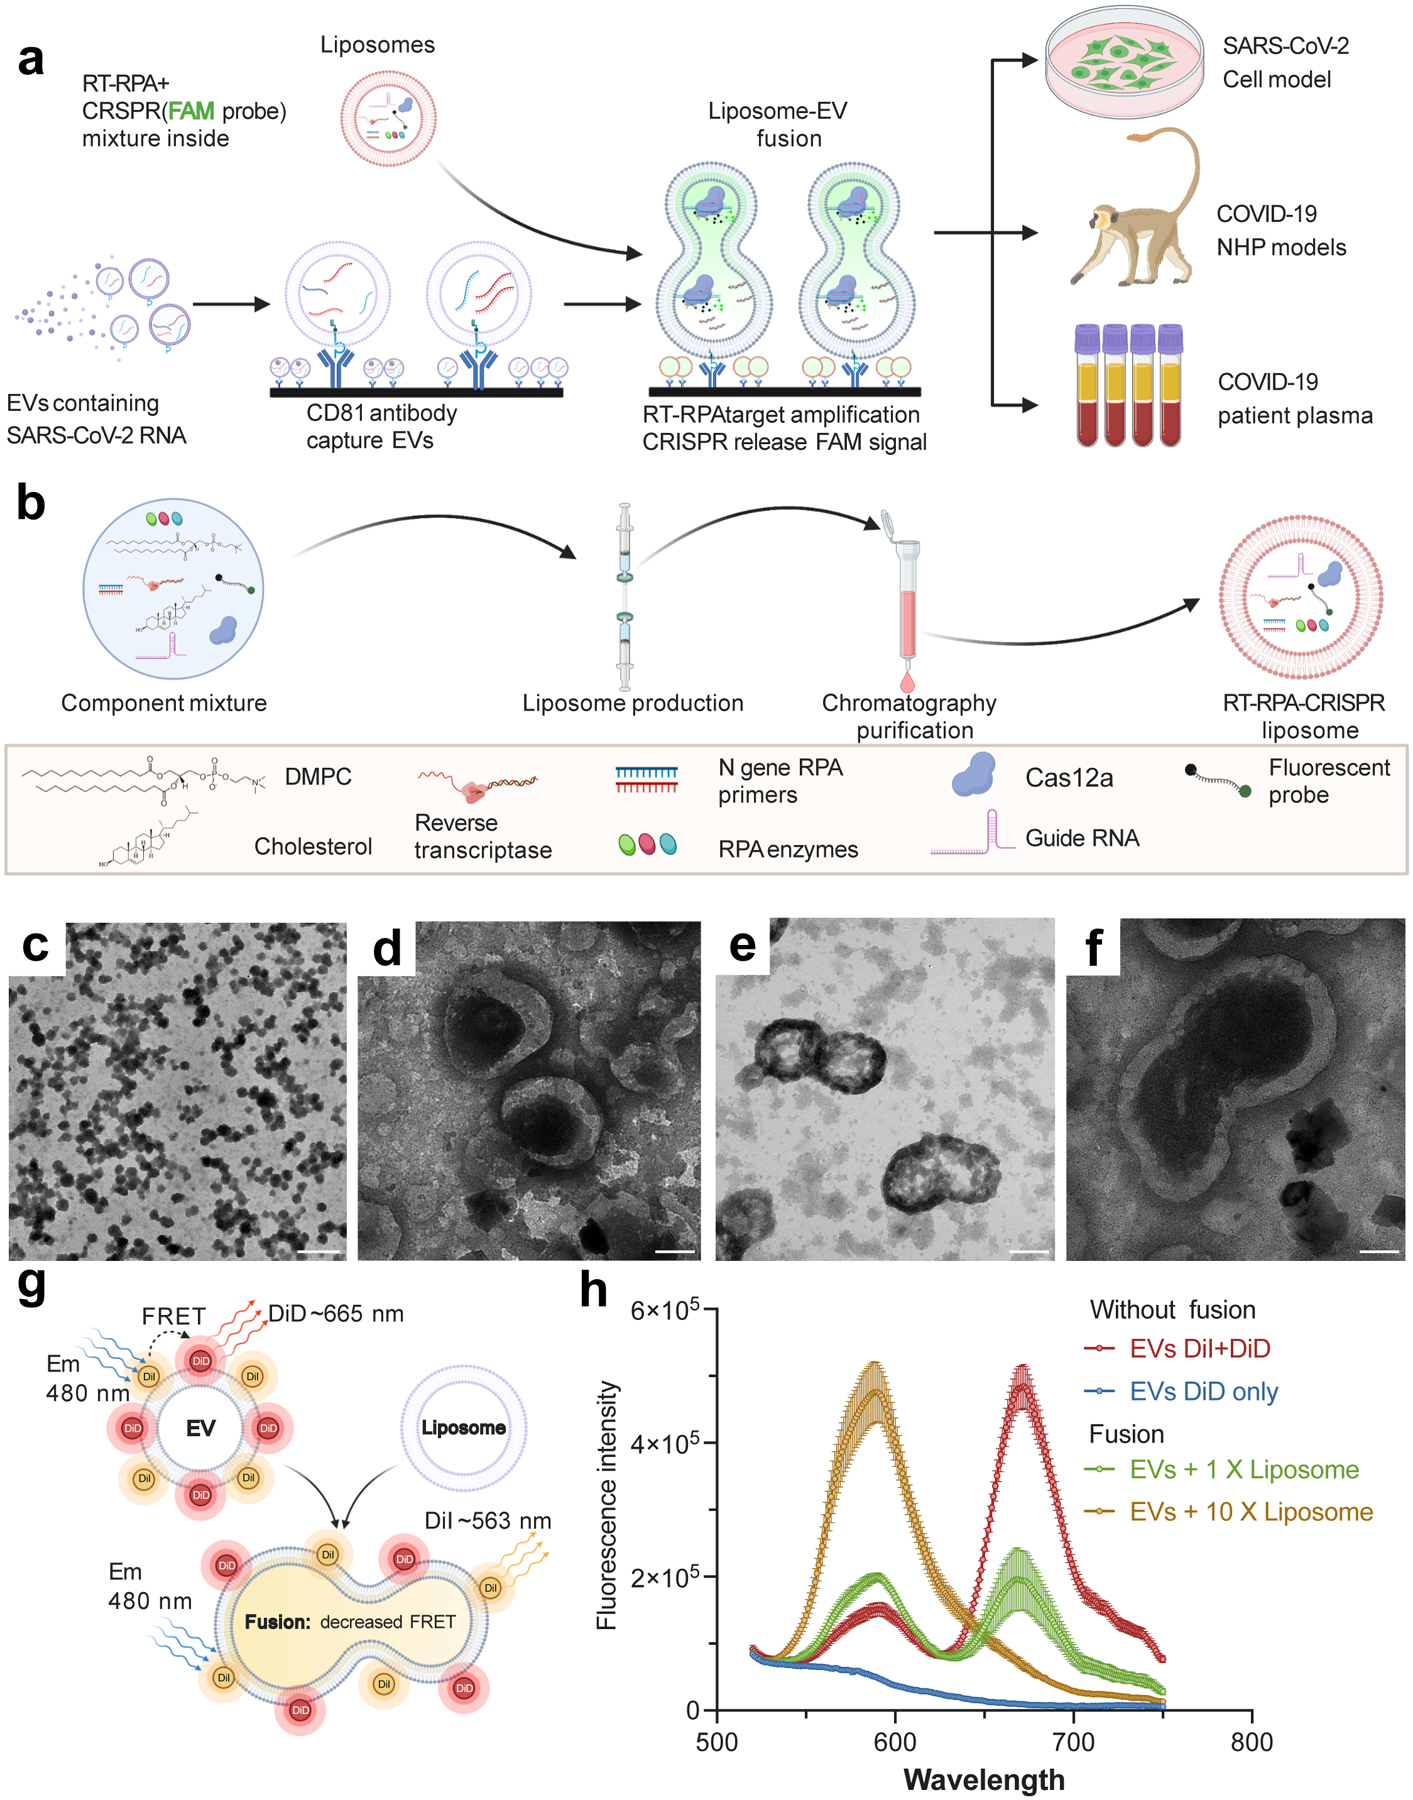
a. Schematic of the proposed assay, indicating CD81-mediated capture of plasma EVs, their fusion with RT-RPA-CRISPR-loaded liposomes, RT-RPA-mediated target amplification, and signal generation by CRISPR-mediated cleavage of a quenched fluorescent probe in proportion to target amplificon concentration. Analysis sample types include cell culture media and plasma from non-human primate (NHP) COVID-19 disease models and COVID-19 patients. b. Schematic of the RT-RPA-CRISPR liposome synthesis workflow and reagents. c–f: Representative TEM images of liposomes at (c) low and (d) high magnification and liposome-EV fusion reactions in different views (e–f). Two repeat experiments were performed. Scale bar, 500 nm (c), 100 nm (d–f). g–h. (g) Schematic of and (h) results from an assay measuring the increase in FRET donor signal (588 nm) and decrease in FRET acceptor signal (665 nm) due to dye separation on labeled EVs (2×10⁸) as a result of increased distance following membrane fusion after incubation with 1× (2×108) or 10× (2×109) molar ratios of unlabeled liposomes. Data represent the mean±SD of three replicates. (a, b & g) were created with BioRender.com.
Nanoscale liposomes synthesized to deliver RT-RPA-CRISPR reagents (Fig. 1b) exhibited uniform morphology (~100 nm mean diameter; Supplementary Figure 2a), and fusion products when incubated with purified EVs and PEG 800017 (Supplementary Figure 2b–c). Transmission electron microscopy (TEM) analysis of these reactions (Figs. 1c–f) revealed ~200 nm vesicles consistent with incomplete fusion (Supplementary Figure 2c&d). To confirm EV-liposome fusion events, EVs were dual-labeled with 1,1’-dioctadecyl-3,3,3’,3’ tetramethylindocarbocyanine perchlorate (DiI; donor) and DiIC18(5) (DiD; acceptor) in a Fӧrster resonant energy transfer (FRET) dequenching assay18 (Fig 1g). FRET activity decreased with the liposome-to-EV ratio, consistent with liposome membrane diluting the FRET dyes to respectively enhance and attenuate donor and acceptor signal (Fig 1h).
Since EV capture and EV-liposome fusion reactions occur over broad temperature ranges19,20, we optimized conditions to produce a one-step CRISPR-enhanced RT-RPA fluorescent detection system (CRISPR-FDS) for incorporation into liposome fusion probes, using assay conditions from a previous study as our starting point21. RT-RPA performed at room temperature (~22 °C) did not induce marked CRISPR-mediated probe conversion under optimal CRISPR conditions, but similar and robust CRISPR-FDS signal was observed within the optimal RT-RPA temperature range (Fig. 2a). CRISPR reactions performed at 22°C, 37°C and 42°C with a constant amplicon amount revealed different reaction kinetics but similar endpoints, reaching their respective maximum signal intensities at approximately 25, 13 and 10 minutes (Fig. 2b). RT-RPA-CRISPR-FDS assays using these optimized conditions and plasma EV RNA isolates accurately distinguished individuals with and without COVID-19 (Fig. 2c). Negative controls containing genomic RNA from other human respiratory viruses, including two influenza strains and alpha and beta coronaviruses (Supplementary Table 2) also produced no CRISPR-FDS signal (Fig. 2d), confirming the SARS-CoV-2-specificity of this one-step assay approach.
Figure 2. Optimization of RT-RPA and CRISPR-FDS assay conditions.
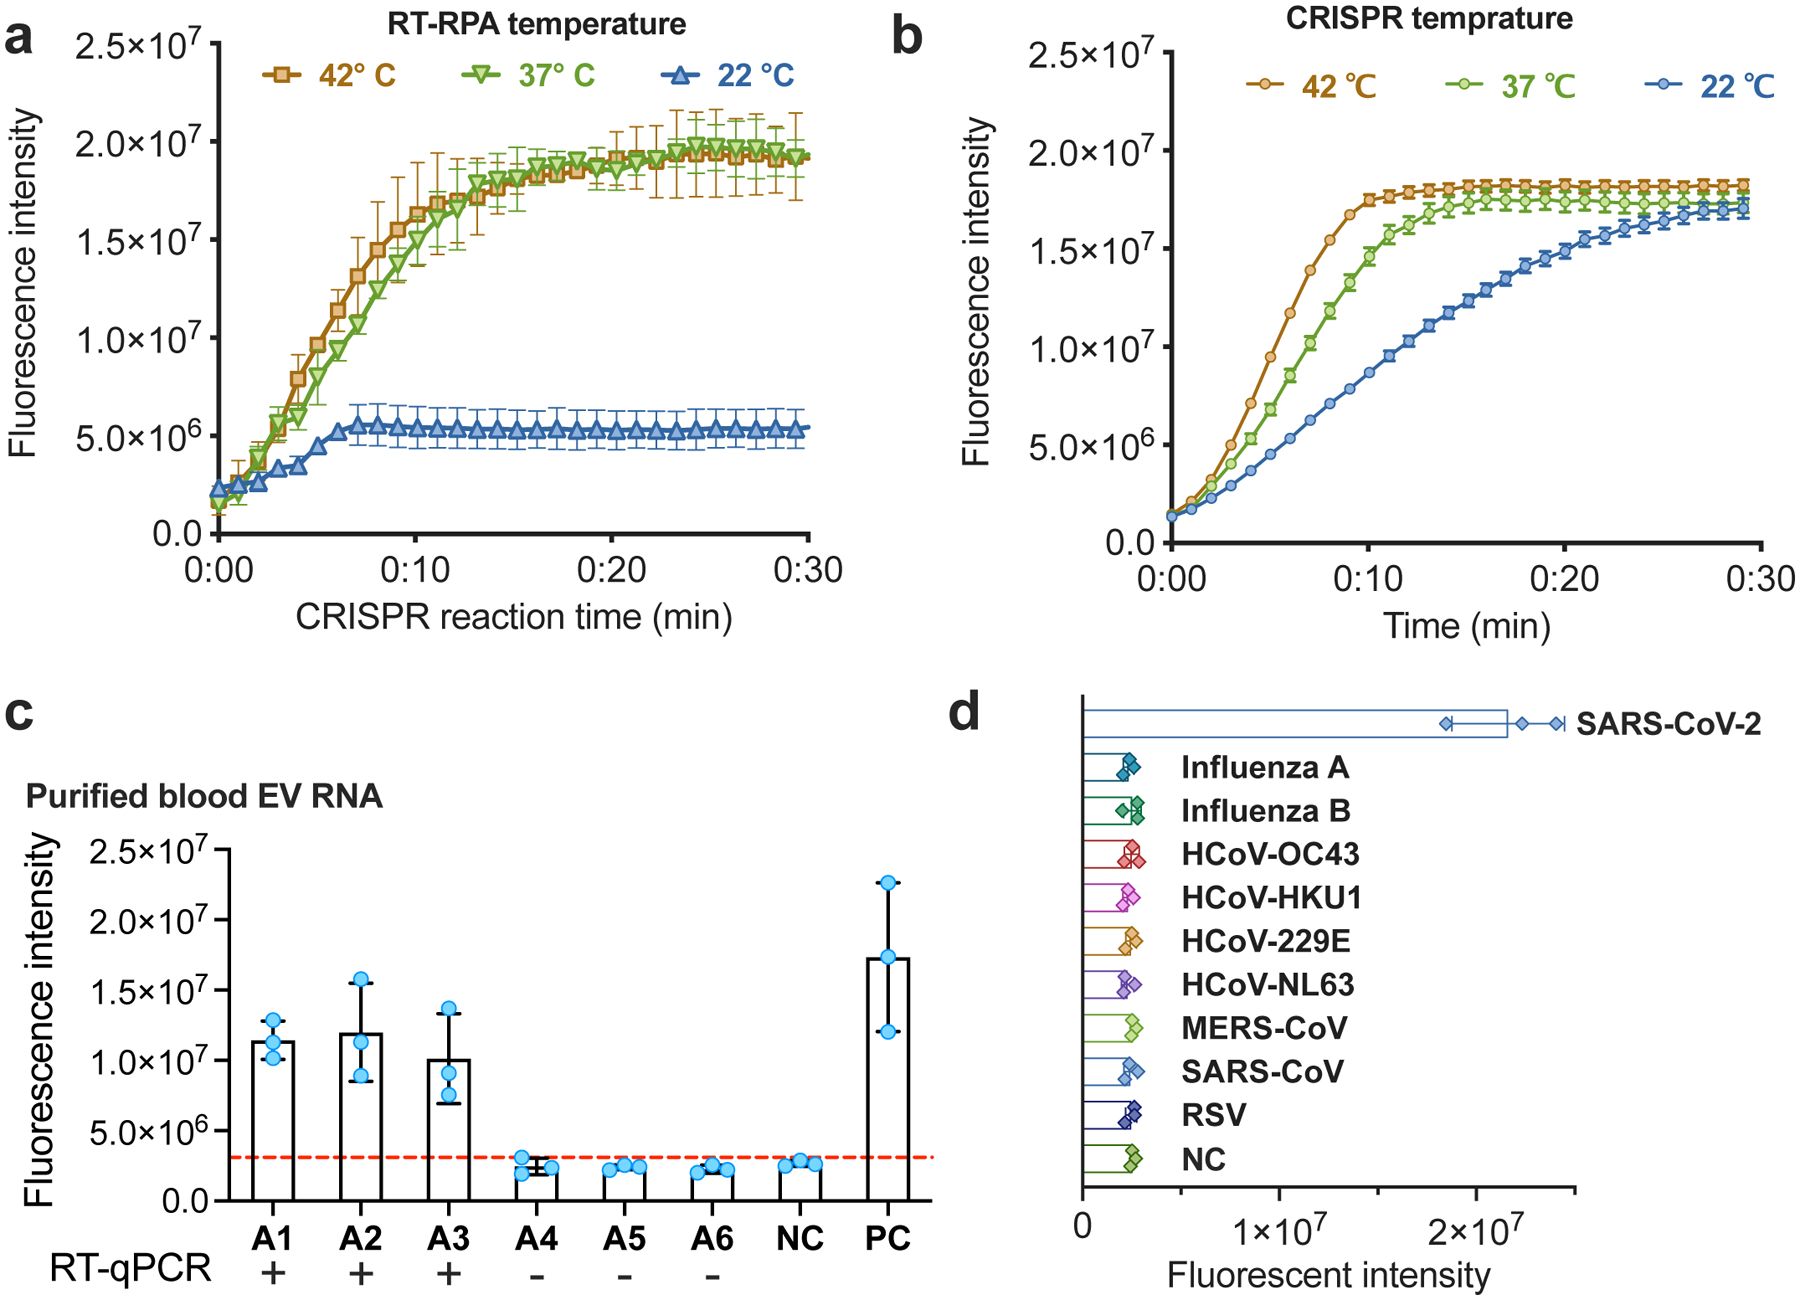
a–b: CRISPR-FDS assay signal from 5 μL PBS aliquots spiked with 100 copies of SARS-CoV-2 RNA and then incubated at (a) 22~42°C for 15 min with 15 μL of RT-RPA reagents and at 37 °C for 15 min with 50 μL of CRISPR reagents; or (b) 37°C for 15 min with 15 μL of RT-RPA reagents and then at 22–42 °C 15 min with 50 μL of CRISPR reagents. c. CRISPR-FDS signal detected with RNA isolated from EVs purified from 50 μL plasma aliquots of individuals diagnosed with or without COVID-19 by positive or negative nasal RT-qPCR results. d. CRISPR-FDS signal for RNA extracts obtained from healthy human plasma spiked (50 μL) with or without RNA or virions (>105 copies) of the indicated human respiratory viruses. Data represent the mean±SD of three replicates.
Liposomes loaded with RT-RPA-CRISPR reagents were then incubated with antibody-captured EVs to evaluate CRISPR-FDS signal produced upon vesicle fusion. This analysis found CRISPR-FDS signal was significantly greater for EVs captured from cells expressing the SARS-CoV-2 N gene instead of control cells (Figs. 3a, Supplementary Figure 3a&b). CRISPR-FDS signal differences were also observed by one hour after initiating EV-liposome fusion in assays analyzing EVs directly captured from plasma of individuals with and without COVID-19, and increased until the two hour endpoint, while did not differ without fusion (Fig. 3b, Supplementary Figure 4). Similar results were obtained with a larger patient cohort with similar overall plasma EV levels (Supplementary Figure 5), where mean CRISPR-FDS intensity was > 1.7× higher in individuals diagnosed with COVID-19 (Fig. 3c, Supplementary Table 3), but no CRISPR-FDS signal was observed with plasma from patients with other lung diseases (Supplementary Figure 6). CRISPR-FDS liposome assays performed on archived plasma from six hospitalized individuals with suspected COVID-19, who had pulmonary CT scans consistent with COVID-19 but negative nasal RT-qPCR results, detected EV SARS-CoV-2 RNA in all these patients (Fig. 3d). Four of these individuals improved after receiving COVID-19 convalescent plasma, and those who did not had SARS-CoV-2 specific antibodies upon retrospective analysis (Supplementary Data), supporting clinical judgements that all these patients had COVID-19.
Figure 3. Direct detection of SARS-CoV-2 RNA in plasma EVs.
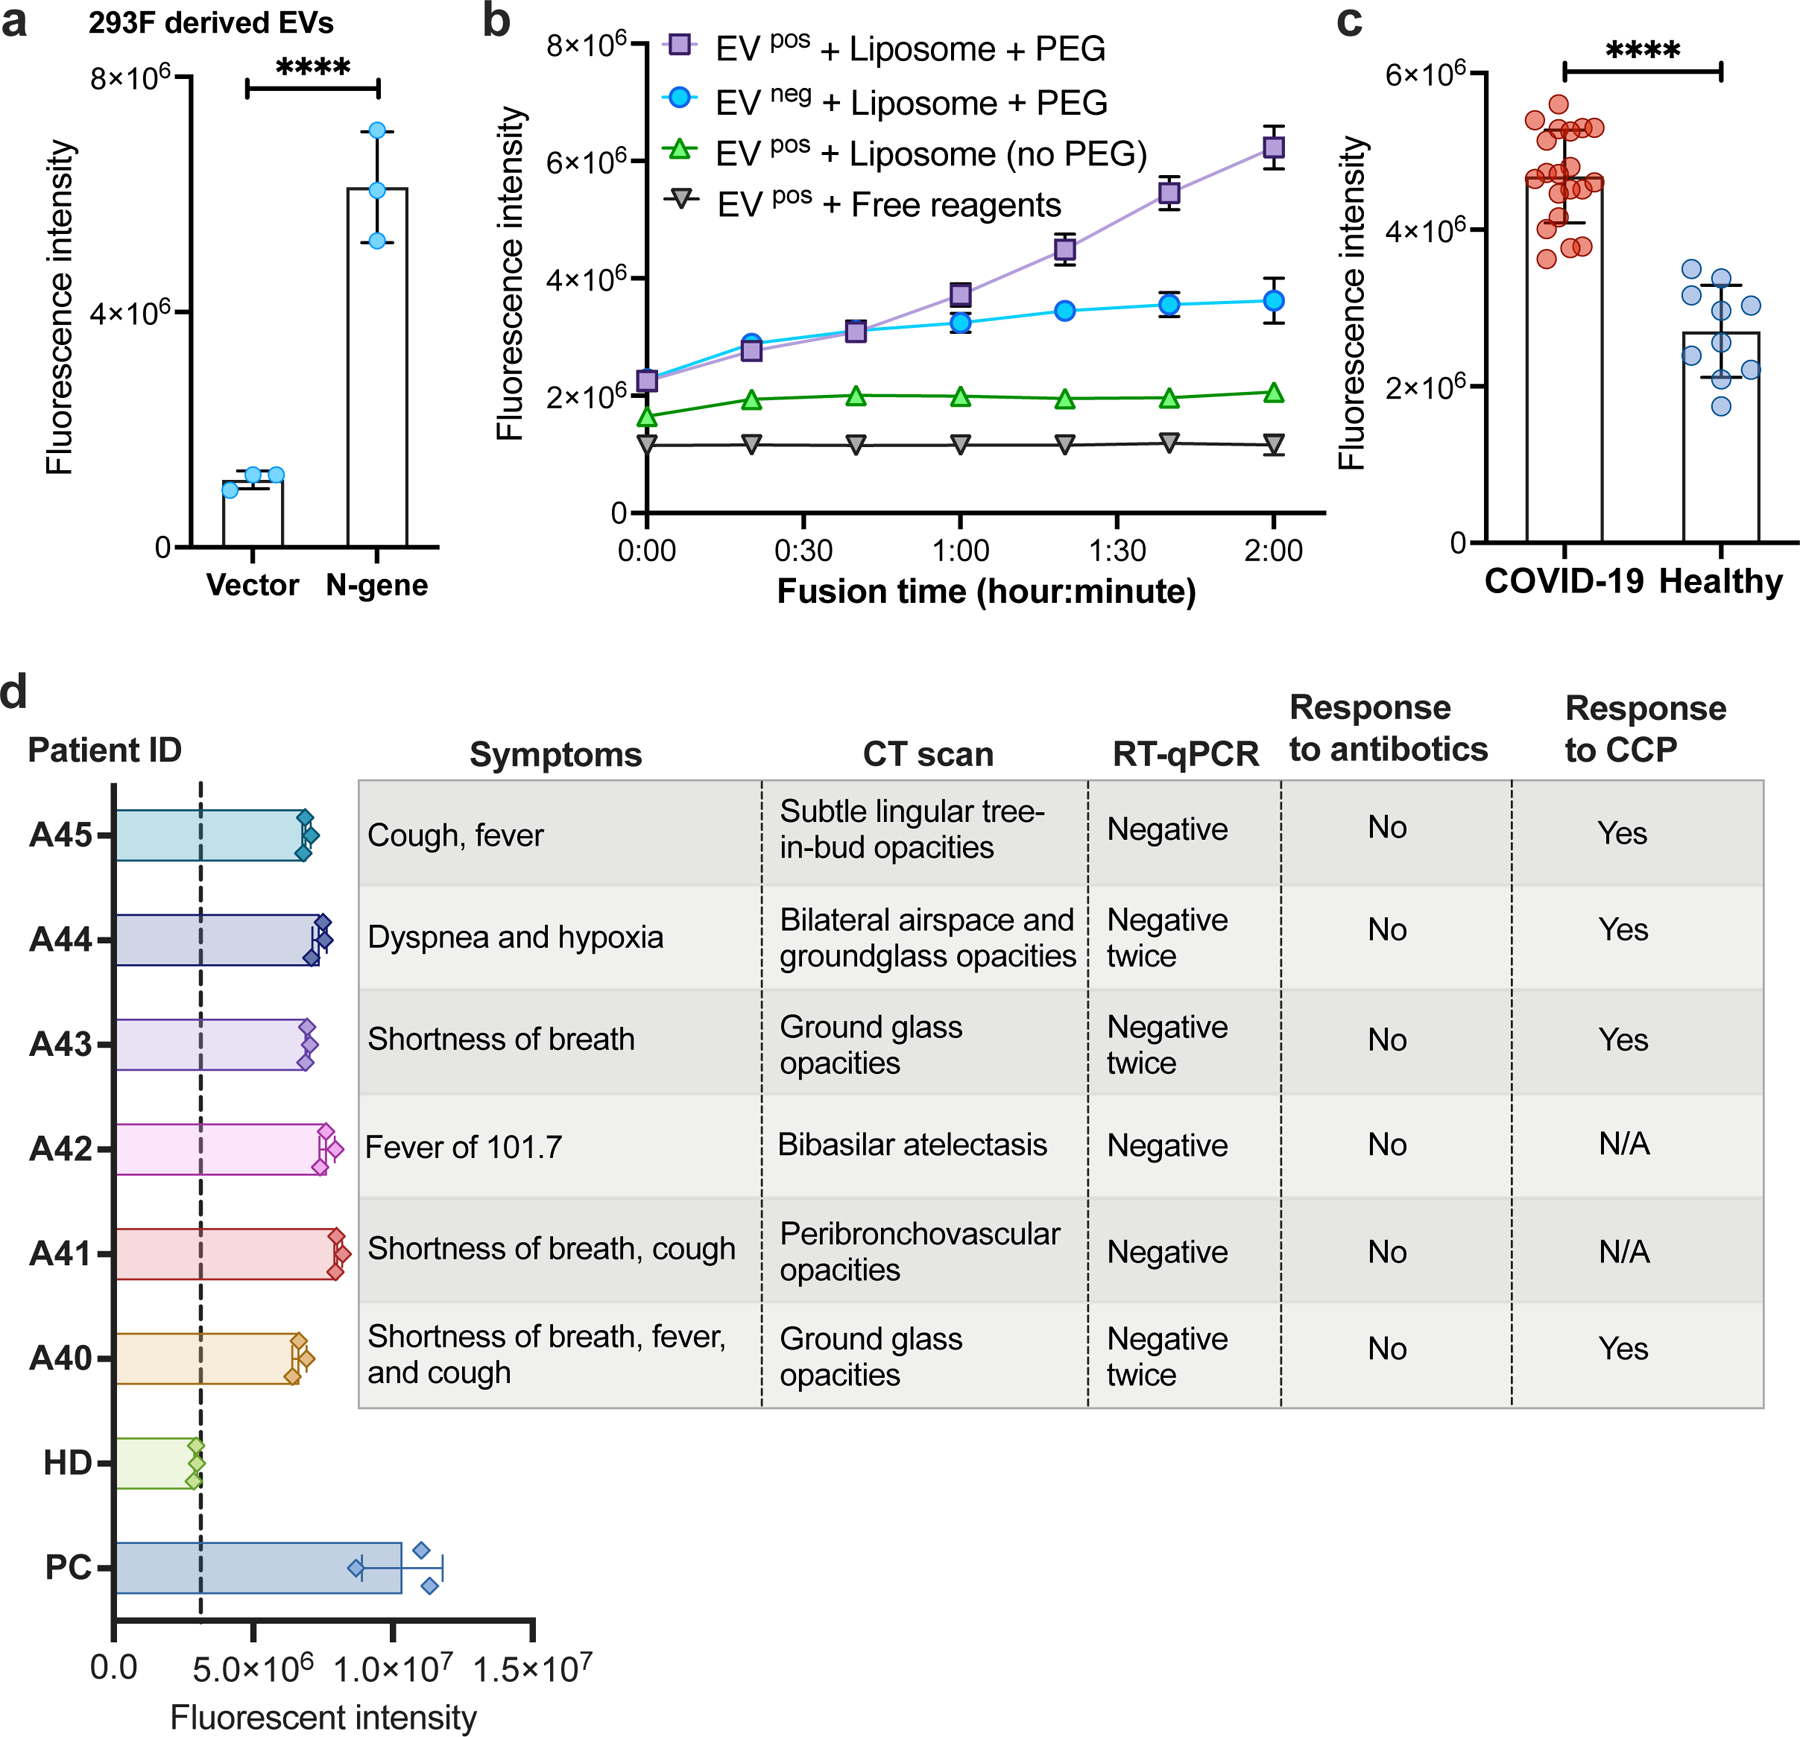
a. CRISPR-FDS liposome assay signal detected with EVs isolated from 293F cells stably transfected with a SARS-CoV-2 N gene expression vector or the empty expression vector. Data represent the mean±SD of three replicates. b. CRISPR-FDS liposome assay kinetics upon analysis of EVs captured from 100 μL plasma aliquots of individuals diagnosed with and without COVID-19 (EV pos/EV neg samples) upon incubation with CRISPR-FDS reagent-loaded liposomes with or without polyethylene glycol (PEG), or with free CRISPR-FDS reagents. c. CRISPR-FDS liposome assay signal detected for plasma aliquots from 20 adults with COVID-19 and 10 adults without COVID-19, as diagnosed by nasal swab RT-qPCR results. d. CRISPR-FDS liposome assay signal detected for plasma samples from six patients diagnosed with COVID-19 based on (A40–A45) who were diagnosed COVID-19 negative by nasal swab sample and a healthy donor (HD) and positive control (PC, whose nasal swab samples are RT-qPCR positive). Data represent the mean±SD of three replicates. ****, p<0.0001.
SARS-CoV-2 viral replication is detectable longer in the lower versus upper respiratory tract22, and other infection sites could give rise to EV SARS-CoV-2 RNA detected in patients with negative nasal RT-qPCR results. To evaluate changes in SARS-CoV-2 RNA level in nasal tissue and plasma EVs following infection, we analyzed serial samples collected from a non-human primate (NHP) model of SARS-CoV-2 infection in which adult African green monkeys were followed for 28 days after exposure to a low-dose SARS-CoV-2 aerosol (Supplementary Figure 7, Supplementary Table 5). We observed high nasal SARS-CoV-2 RNA levels by RT-PCR CRISPR23 at day 1 post-infection, which tended to peak between days 1 and 13 post-infection, and decrease rapidly after peak expression (Fig. 4a). CRISPR-FDS liposome assays performed using matched plasma, however, detected lower EV SARS-CoV-2 RNA levels at day 1 post-infection, which consistently increased at day 6 post-infection and remained stable for the entire time course, suggesting that EV SARS-CoV-2 RNA expression may be a more durable marker of infection.
Figure 4. SARS-CoV-2 RNA expression time course in plasma EVs.
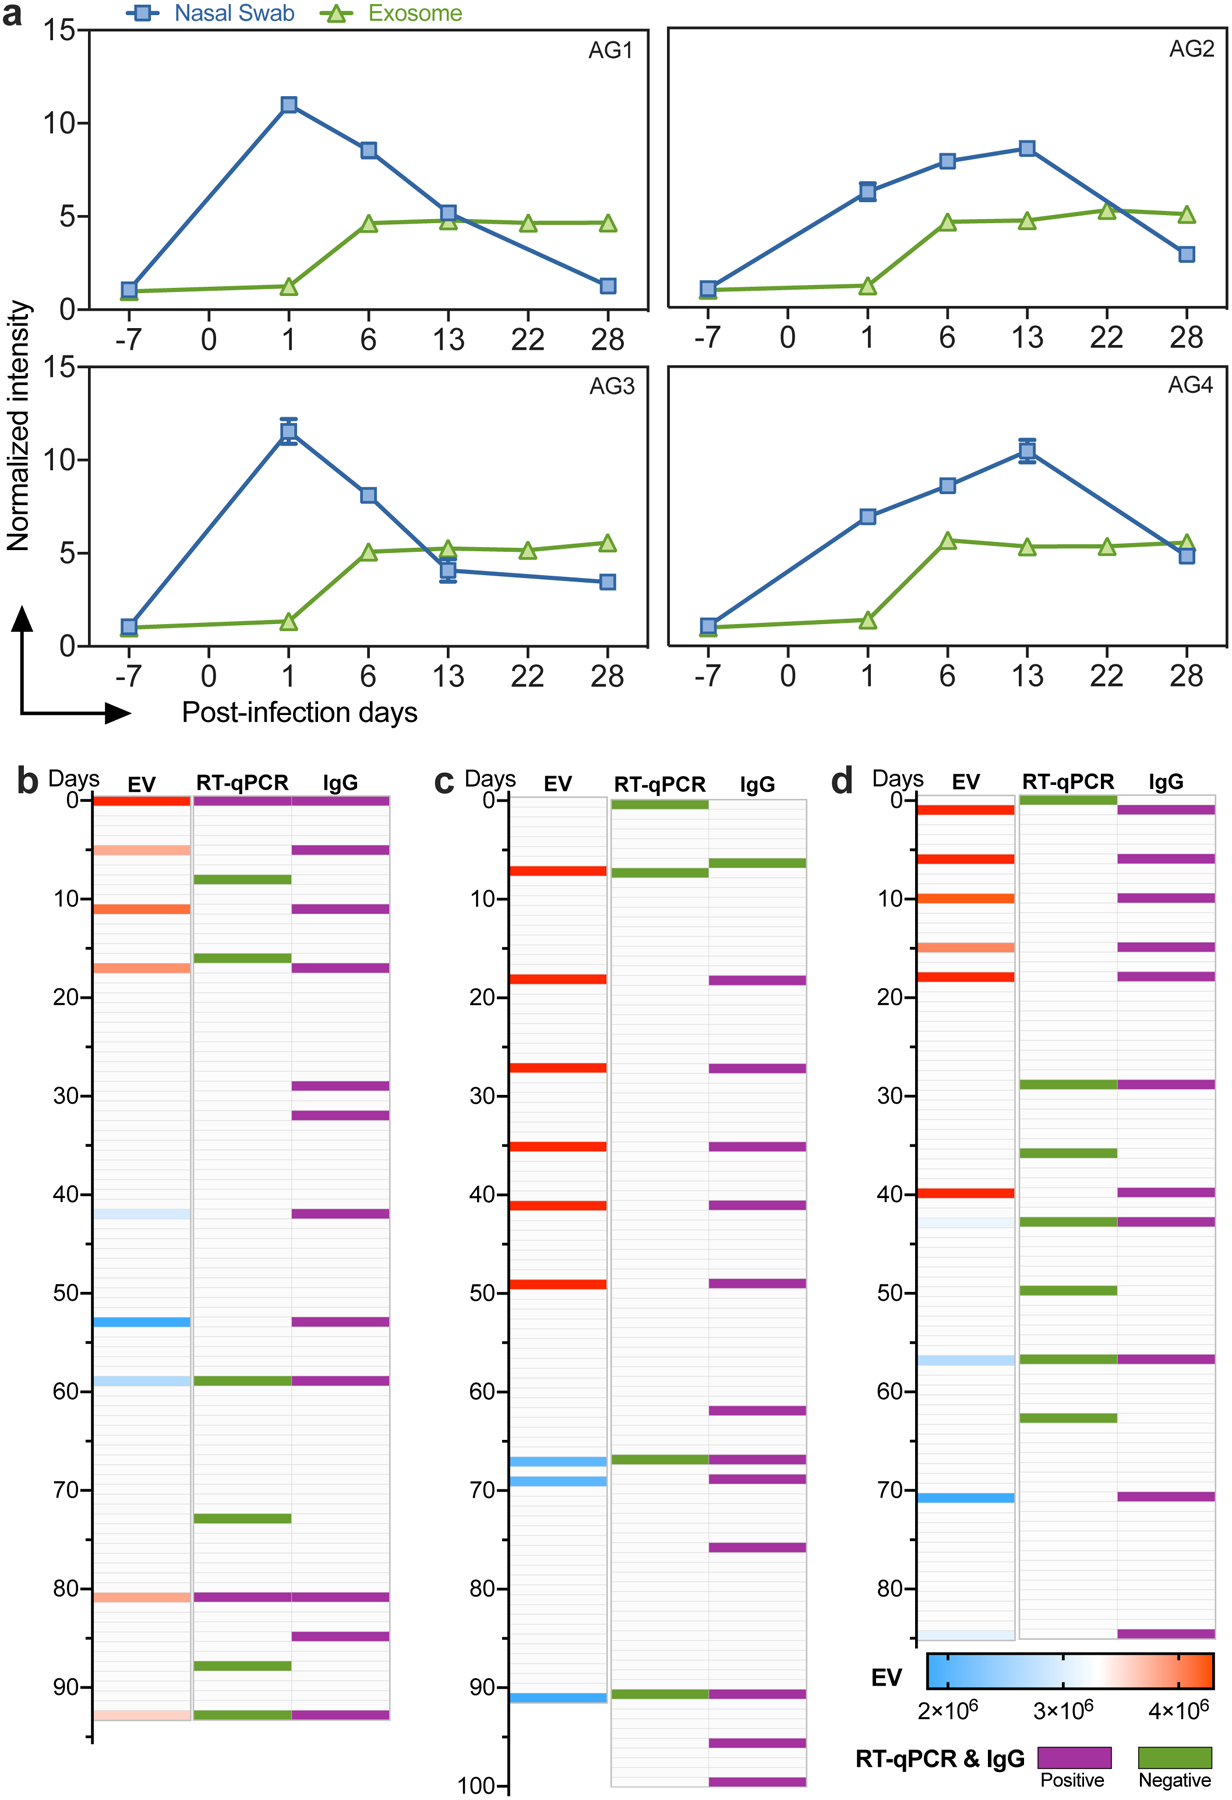
a. Normalized CRISPR-FDS liposome signal intensity from 4 NHP (African Green, AG1–4) plasma samples and RT-PCR-CRISPR signal intensity from AG1–4 nasal swab samples at the indicated timepoints. b–d, Positive (red) and negative (blue) results for CRISPR-FDS liposome (EV) fluorescent intensity, nasal RT-qPCR, and serological results (IgG) in three children at the indicated time points after first evaluation. Data represent the mean±SD of three replicates.
Since SARS-CoV-2 RNA levels in NHP plasma EVs exhibited a delayed and sustained peak relative to their nasal swabs, we examined the time course of SARS-CoV-2 EV signal in young children who demonstrated evidence of COVID-19 at or following initial evaluation and had nasal swab RT-qPCR results and archived blood samples during a >3-month follow-up. Two children had negative nasal swab results at all timepoints, but SARS-CoV-2-positive plasma EV results from initial evaluation to 40–60 days thereafter, with EV signal remaining positive ~40 days after their first SARS-CoV-2 IgG positive sample23 (Fig. 4c–d). A third child had a single positive RT-qPCR test followed by two negative tests, but four positive plasma EV results over the same interval, after which there was a two month period where both tests yielded negative results before again detecting SAR-CoV-2 RNA suggestive of disease recurrence or reinfection (Fig. 4b). RT-qPCR detected a single positive sample followed by two negative samples for this child, whereas all plasma samples collected within this interval were positive. SARS-CoV-2 IgG positive samples were also detected throughout the evaluation period, but this child was only two months of age at first evaluation and thus detected IgG could have derived from the mother, whose infection status was unknown and who did not have samples available for analysis.
Our data indicate that plasma EVs containing SARS-CoV-2 RNA are detectable early after infection and persist after gold-standard nasal RT-qPCR assays return negative results. However, this study does not address several important questions. First, while our data indicate that SARS-CoV-2 RNA is detectable in plasma EVs from early infection onward, the form of EV RNA cargo is unclear. However, EV-derived SARS-CoV-2 RNA was detected under reaction conditions not expected to disrupt SARS-CoV-2 virions and release their RNA. Proteomic analysis of plasma EVs isolated from COVID-19 patients also did not detect SARS-CoV-2 viral protein (Supplementary Figure 8), suggesting that these EVs did not contain substantial amounts virus-encapsulated SARS-CoV-2 RNA, although sensitivity of this analysis was limited by the lack of a SARS-CoV-2 RNA-enriched EV sample.
Second, the functional significance of detecting SAR-CoV-2 RNA in these EVs is unclear. Two other single strand plus-sense RNA viruses are reported to employ the EV biogenesis pathway to deliver their genomes to recipient cells to initiate infection,15 but it is not known if EVs found to carry SARS-CoV-2 RNA in the current study also support infection. Our CRISPR-FDS liposome assay detects a region of the SARS-CoV-2 N gene, but not whether EVs containing this region also contain the entire intact viral genome required to support infection. Reports indicate that some COVID-19 patients develop SARS-CoV-2 infections at extrapulmonary sites7 implying that functional virus particles, or possibly EVs that carry the full-length SARS-CoV-2 RNA genome, enter the circulation to initiate infections at secondary sites. SARS-CoV-2 RNA has been detected in the circulation of COVID-19 patients, but studies have yet to report isolation of virus activity from COVID-19 patient plasma or serum. Given that EVs can directly promote the systemic spread of other viral infections15, similar studies should be conducted for SARS-CoV-2.
Finally, while our results indicate that circulating EVs carry SARS-CoV-2 RNA, our current assay does not detect sub-genomic RNA fragments that serve as an indicator of an active infection. Future studies are therefore underway to evaluate SARS-CoV-2 genomic and sub-genomic RNA expression in circulating EVs.
Most diagnostics analyze upper respiratory tract samples or saliva, where virus replication appears more transient than in lower respiratory tract, and potentially extrapulmonary, infections24,25. We believe the major utility of our extraction-free approach is its ability to detect plasma EV-derived SARS-CoV-2 RNA as an early and durable sign of systemic infection. EV analysis may be more advantageous than analysis of total plasma RNA for SARS-CoV-2 detection since captured EV RNA may contain less degraded or off-target RNA than extravesicular RNA. Our EV assay eliminates laborious and time-consuming EV isolation steps required by other EV analysis approaches, which produce substantial variation due to batch-to-batch differences in EV yield and purity. Further, it may also be possible to adapt this approach to determine the specific contribution(s) of potential target tissues to SARS-CoV-2 RNA during extended infections, which is not possible with analyses using total plasma RNA.
Some new SARS-CoV-2 diagnostic assays do not require RNA isolation and/or amplification, but require high viral loads, and analyze upper respiratory tract samples rather than blood. We believe our assay has potential utility as a secondary test for suspected COVID-19 cases that are RT-qPCR negative but lack alternative diagnoses. It may be particularly valuable for individuals with long-term evidence of infection since transient upper respiratory tract RT-qPCR results may not reflect virus levels in pulmonary or extrapulmonary infections. This includes individuals with compromised immune systems, such as transplant recipients and others receiving immunosuppressive therapies. It may also be relevant during organ donation to reduce the risk of virus transfer, as recently documented for a lung transplant case where the donor’s SARS-CoV-2 infection was not detected by respiratory tract RT-qPCR testing and lead to the death of the recipient and infection of the surgeon26. Our assay is intended as a clinical application since it analyzes plasma, requires wash steps, and utilizes a benchtop plate reader for its longitudinal readout. A portable device that utilizes a microfluid chip to generate and analyze a fingerstick blood sample, could potentially be developed for a point of care solution, although this would require stabilization of the reagent-loaded liposomes or an adaptation to analyze lysates of the captured EVs.
Methods
CRISPR-FDS assay
One tube of TwistAmp™ Basic powder (TwistDx, TABAS03KIT) was mixed with 35.4 μL of Rehydration buffer, 3 pmol N gene primer pairs (Supplementary Table 1), 1 μL ProtoScript® II Reverse Transcriptase (NEB M0368L), 3 μL 80 mM MgOAc and 2.6 μL nuclease-free water. The mixture was aliquoted into 3 part for triplicates assay, each 15 μL RT-RPA reagents were incubated with 5 μL template RNA at 22–42 °C for 15 min and then at 37 °C for 15 min with 50 μL of CRISPR reagents including 0.16 pmol Cas12a (NEB M0653T), 0.16 pmol N gene guide RNA, and 1 pmol FAM-labeled DNA probe for method optimizations. A combined RT-RPA-CRISPR assays used for EV RNA detection and pathogen cross activity were performed with a total of 30 min incubation at 37 °C. Nasal swab RT-PCR CRISPR was performed as previously reported23.
CRISPR-FDS liposome probe synthesis
Nanoscale liposomes employed to deliver CRISPR-FDS reagents to EVs were synthesized by dissolving 48 μmol 1,2-dimyristoyl-sn-glycerol-3-phosphorylcholine (DMPC) and 4.8 μmol cholesterol in 1 mL ethanol, which were mixed and dried under nitrogen gas. This material was then mixed with CRISPR-FDS reagents (10 μL RT enzyme, 300 μL 10× NEBuffer 2.1, 0.3 pmol N gene primer pairs, 10 tubes of TwistAmp™ Basic powder, 300 μL rehydration buffer, 0.16 pmol Cas12a, 0.16 pmol N gene guide RNA, and 1 pmol FAM-labeled DNA probe). CRISPR-FDS-loaded liposomes were then prepared by sequentially passing this lipid-reagent mixture through 0.8 μm, 0.4 μm, 0.2 μm and 0.1 μm polycarbonate membranes (20× for each filter) at room temperature27, after which free reagents and lipid were removed by size exclusion chromatography using a G25 Dextran column. The liposome fraction was then analyzed by NanoSight to determine the liposome size distribution and diluted and vortexed in 5 mL PBS to generate a concentrated liposome solution (8.5×10⁹ liposomes/mL), which was aliquoted and stored at 4 °C until aliquots were diluted for use in CRISPR-FDS liposome assays.
CRISPR-FDS liposome fusion assay
Black-wall 96-well ELISA plates (Corning Costar 3601) coated with 1 μg anti-CD81 (Invitrogen, MD5-13548)/well by overnight incubation at room temperature were incubated with 100 μL purified EVs or plasma, as described, for 2 hours at 37°C to allow EV capture, washed 3× with phosphate buffered saline with 0.05% Tween 20 (PBST). Sample wells were then incubated with 50 μL of a reaction solution containing 4.2×10⁸ RT-RPA-CRISPR liposomes, adjusted to a final concentration of 25% mass/volume PEG8000, and incubated at 37°C for 2 hours, after which CRISPR-FDS fluorescent signal was read with a benchtop plate reader (480 nm excitation; 530 nm emission). An EV assay result was considered positive if it was equal or greater than a cut-off threshold defined by the mean signal of the negative control samples plus three times their standard deviation28.
EV isolation from cell culture medium.
EV isolation from cell culture medium was performed as previously described29. Briefly, ten 70–80% confluent 15 cm culture dishes of 293F cells (Invitrogen) were washed three times with PBS and then cultured in DMEM media supplemented with 10% EV-depleted FBS for 48 hours, after which conditioned media was collected and centrifuged at 2000g for 30 minutes to remove cell debris and passed through a 0.45 μm filter (LG-FPE404150S, LifeGene). EVs in this clarified supernatant were concentrated passing this material over a 100KDa centrifugal filter unit (UFC901008, Thermo Fisher Scientific) at 3000g for 20–30 minutes for three times. Retained sample was collected by washing the membrane 3× with 500 μL PBS, centrifuged twice at 4 °C, 12,000g for 30 minutes to precipitate residual debris. This supernatant was then centrifuged twice at 100,000g and 4°C for 3 hours, discarding the supernatant and resuspending the pellet in PBS after each centrifugation step. This EV fraction was then analyzed by NanoSight to determine EV size distribution and diluted and vortexed in 5 mL PBS to generate a concentrated EV solution (8.75×10⁹ EVs/mL), which was aliquoted and stored at −80°C until aliquots were diluted for use in CRISPR-FDS liposome assays.
Plasma EV isolation.
Plasma EV samples used in Fig. 3b were isolated with an ExoQuick ULTRA EV Isolation Kit (EQULTRA-20A-1, System Biosciences) following manufacturer instructions. Briefly, 250 μL plasma aliquots were centrifuged at 3000g for 15 minutes, supernatants were then gently mixed with 67 μL ExoQuick solution and incubated on ice for 30 minutes, and then centrifuged at 3000g and 4 °C, for 10 minutes. EV pellets were then processed according to the manufacturer’s instructions, and EVs was then analyzed by NanoSight.
Particle size measurement
The relative concentrations of purified plasma EV samples were measured by bicinchoninic acid (BCA) assay, and all samples were diluted to a 5 μg/mL final concentration in PBS before subsequent analysis. The size distributions and concentrations EVs and liposome samples were measured using a NanoSight NS300 instrument employing Nanoparticle Tracking Analysis Software (Malvern Instruments) and a capture duration of 60 s for each sample.
TEM
Liposome or purified EV samples were diluted to a final concentration of ~8.45×10⁹ vesicles/μL in 2% pH 7.0 phosphotungstic Acid (PTA), which EVs were diluted to a final concentration of 50 ng EV protein/μL. Samples aliquots (20 μL) were then spotted on parafilm, and allowed to adhere for 20 minutes to a carbon-coated grid that was floated carbon side down over them, after which excess fluid was removed by wicking through filter paper. Grids were rinsed with distilled water before being placed carbon side down on a 20 μL drop of filtered 2% pH 7.0 PTA to stain for approximately 1 min, then the PTA was with filter paper wicking and samples were allowed to completely dry at room temperature. Images of liposome, EVs and vesicle fusions were captured using a FEI TECNAI F30 transmission electron microscope operating at 300 kV.
FRET analysis for liposome-EV fusion
EVs aliquots containing 2×10⁸ EVs purified from human plasma samples were resuspended in 1 mL PBS containing 5 μL Vybrant DiI (Molecular Probes, V-22885) and 5 μL DiD (Molecular Probes, V-22887) and incubated at room temperature for 20 min, then filtered three times with a 100 kDa centrifugal filter unit (UFC901008, Thermo Fisher Scientific) at 3000g for 20–30 minutes at room temperature to remove free dyes and concentrate EVs to a ~50 μL final volume. Liposome aliquots containing 2×10⁸ or 2×10⁹ liposomes in 50 μL PBS were mixed with EVs double-labeled with DiI and DiD, and liposome-EV fusion reactions were performed as described above. Fluorescent signal was excited with 480 nm laser and fluorescent emission spectrum was measured with SpectraMax iD5 (Molecular Device) microplate reader from 525 nm to 750 nm.
SARS-CoV-2 N gene expression vector and cell line
The SARS-CoV-2 N gene was PCR amplified using a 2019-nCoV_N_Positive Control (IDT 10006625) as the template, and then cloned into the pLenti-CMV-puro lentiviral vector (Addgene 17452) by Gibson assembly (NEB E1602L) (Supplementary Fig. 4a). Candidate expression vector subclones expected to carry the N gene target region were validated for full-length sequence identity by Sanger sequencing. 293F (Gibco R79007) cells (1 ×10⁶) suspended in 2 mL were co-transfected with 2 μg of pLenti-CMV-puro expression vector with or without the N-gene subclone and 1.5 μg of the psPAX2 (Addgene 12259) and 1 μg of the pMD2.G (Addgene 12259) vectors. After 48 hours, 1 mL of conditioned culture media containing lentivirus from the transfected 293F cells was added to culture wells containing 0.5×10⁶ 293F cells for 12 hours, after which cells were cultured with 1 μg/mL puromycin (Gibco A1113803) for 48 hours to select for transduced cells, which were collected and expanded in DMEM with 10% FBS to achieve cell cultures containing 3 × 10⁸ cells for EV isolation, as described above.
Clinical sample collection
Human nasal swab and plasma specimens analyzed in this study and demographic data were collected after obtaining prior written informed consent from adult patients or the legal guardians of pediatric patients, who also indicated their assent, in compliance with approved IRB protocols by Tulane University as previous report23. Samples analyzed in the adult cohort (Supplementary Table 4) were obtained from patients who had matching plasma and nasal swab samples analyzed by the Tulane Molecular Pathology Laboratory between May 1 to May 7, 2020, and whose COVID-19 status was determined based on clinical indications and current CDC guidance. Plasma samples corresponding to the described adult case studies were obtained from individual who were treated at Tulane Medical Center between April 27 and July 14, 2020, under an IRB protocol approved by Tulane University and released to our study team in same day. Nasal swab results and plasma samples from indicated cases was obtained from children who were screened for COVID-19 at Children’s Hospital New Orleans, Louisiana between March – July 2020 (Supplementary Table 7). Eligibility criteria included any child (⩽18 years) receiving care at the Children’s Hospital New Orleans. Clinical results for nasal swab were determined using the CDC 2019-nCoV real-time RT-PCR Diagnostic Panel.
CCP treatment of adult case studies:
Following written informed consent in accordance with the Declaration of Helsinki, ABO compatible CCP was infused over 1–2 hours following premedication with 650 mg of acetaminophen and 25 mg of diphenhydramine. One patient was treated after obtaining individual emergency Investigational New Drug (eIND) approval from the FDA (Figure 3d patient) were enrolled in the investigator initiated clinical trial Expanded Access to Convalescent Plasma to Treat and Prevent Pulmonary Complications Associated With COVID-19. This clinical trial is open to enrollment at Tulane University, IND: 020073, approved by the IRB of Tulane University (IRB ref: 2020- 595), and registered in clinicaltrials.gov website under Identifier: NCT04358211.
Plasma and swab collection and processing procedures:
Human and NHP blood samples were collected in EDTA tubes and rapidly processed to isolate plasma in same day. All isolated plasma samples were immediately stored at − 80°C till measurement. All identifying data was removed and samples were coded with a unique subject identification. Human and NHP nasal swab samples were collected in 200 μL of DNA/RNA Shield (R1200, Zymo Research) and stored at −80°C until processed for RNA. NHP and clinical specimens were processed in an enhanced BL2/BL3 space in accordance with a protocol approved by Tulane University Institutional Biosafety Committee. RNA samples were isolated from 100 μL of plasma or swab storage buffer using the Zymo Quick-DNA/RNA Viral Kit (D7020) following the assay protocol, and RNA was eluted in 50 μL and stored at − 80°C until analysis.
COVID-19 IgG test:
ELISA plate was coated with 0.5 μg/ml purified SARS CoV-2 spike protein (kindly provided by Kathryn Hastie at Scripps Research Institute) in 0.1 M NaHCO3 for 1 h at room temperature. ELISA plate was washed five times with PBS+EDTA and incubated with blocking buffer (PBS containing 0.5%Tween, 5% dry milk, 4% whey proteins, 10% FBS) for 30 min at 37 °C. In parallel, a set of wells not coated with antigen were incubated with blocking buffer. Plasma was heat inactivated, diluted 1:100 in blocking buffer, and 100 μL/well of diluted plasma was incubated 1 h at room temperature. Wells were then washed and incubated for 30 min at room temperature with peroxidase-conjugated goat anti-human IgG-Fc (Jackson ImmunoResearch 111-035-008) diluted 1:5,000 in blocking buffer, PBS washed, and incubated with 100 μL/well Tetramethylbenzidine (TMB)-H2O2. Color development was stopped by the addition of 1M phosphoric acid, and optical density was read at 450 nm in a 96 well plate reader. For each sample, OD values observed with control wells were subtracted from OD values observed with S protein to calculate net OD. Samples will OD >0.4 were considered positive, based on a cut-off OD value established by preliminary screening of >50 pre-COVID19 human sera in which no false positives were detected23.
Animal model
Ethics Statement:
The Institutional Animal Care and Use Committee of Tulane University reviewed and approved all the procedures for this experiment. The Tulane National Primate Research Center is fully accredited by the Association for Assessment and Accreditation of Laboratory Animal Care (AAALAC). All animals are cared for in accordance with the NIH guide to Laboratory Animal Care. The Tulane Institutional Biosafety Committee approved the procedures for sample handling, inactivation, and removal from BSL3 containment.
Virus Information:
SARS-CoV-2 isolate USA-WA1/2020 was acquired from BEI Resources, and the harvested stock determined to have a concentration of 1 × 10⁶ TCID50/ml. The virus was passaged in Vero E6 cells in DMEM media with 2% FBS sequence confirmed by PCR and/or Sanger sequencing. Plaque assays were performed in Vero E6 cells23.
Animals and Procedures:
Samples from a total of four nonhuman primates aged approximately 7.5 years (4 male Chlorocebus aethiops (African green monkeys)) were used for analysis in this in this study. For viral inoculation, animals were anesthetized and then acutely exposed by head-only inhalation to SARS-CoV-2 (WA12020) resulting in an individual inhaled dose of ~2.5×10³ TCID50. Animals were biosampled thereafter and observed for 28 days post-infection including twice-daily monitoring by veterinary staff.
Statistical analysis.
CRISPR-FDS and liposome fusion assay signal was expressed as the mean of ≥ 3 independent reactions ± SD. GraphPad Prism 8 was used to calculate one-way ANOVA to determine the optimized condition of RT-RPA-CRISPR. Multiple group comparisons were conducted using one-way ANOVA. Differences were considered statistically significant at P < 0.05.
Supplementary Material
Acknowledgments
This study was supported by grants R01AI113725, R01AI122932, 1R03AI140977-01 and R21Al126361 from the National Institute of Allergy and Infectious Diseases (NIAID), R01HD090927 from the National Institute of Child Health and Human Development, 1U01CA252965-01 from the National Cancer Institute and W8IXWH1910926 from the Department of Defense. The work at the Tulane National Primate Research Center (TNPRC) was supported in part by NIAID Contract No. HHSN272201700033I (C.J.R.) and grant OD011104 from the NIH Office of Research Infrastructure Programs. T.Y.H. also acknowledges the generous support of the Weatherhead Presidential Endowment fund.
Footnotes
Competing interests
No competing interests
Data Availability:
The data from this work can be obtained from the corresponding author upon reasonable request.
References
- 1.Udugama B et al. Diagnosing COVID-19: The Disease and Tools for Detection. ACS Nano, doi: 10.1021/acsnano.0c02624 (2020). [DOI] [PubMed] [Google Scholar]
- 2.Liu Y et al. Viral dynamics in mild and severe cases of COVID-19. The Lancet Infectious Diseases 20, 656–657, doi: 10.1016/S1473-3099(20)30232-2 (2020). [DOI] [PMC free article] [PubMed] [Google Scholar]
- 3.Wang W et al. Detection of SARS-CoV-2 in Different Types of Clinical Specimens. JAMA 323, 1843–1844, doi: 10.1001/jama.2020.3786 (2020). [DOI] [PMC free article] [PubMed] [Google Scholar]
- 4.Xu H et al. High expression of ACE2 receptor of 2019-nCoV on the epithelial cells of oral mucosa. International Journal of Oral Science 12, 8, doi: 10.1038/s41368-020-0074-x (2020). [DOI] [PMC free article] [PubMed] [Google Scholar]
- 5.Sungnak W et al. SARS-CoV-2 entry factors are highly expressed in nasal epithelial cells together with innate immune genes. Nature Medicine 26, 681–687, doi: 10.1038/s41591-020-0868-6 (2020). [DOI] [PMC free article] [PubMed] [Google Scholar]
- 6.Burgueño JF et al. Expression of SARS-CoV-2 Entry Molecules ACE2 and TMPRSS2 in the Gut of Patients With IBD. Inflammatory Bowel Diseases 26, 797–808, doi: 10.1093/ibd/izaa085 (2020). [DOI] [PMC free article] [PubMed] [Google Scholar]
- 7.Lin L, Lu L, Cao W & Li T Hypothesis for potential pathogenesis of SARS-CoV-2 infection-a review of immune changes in patients with viral pneumonia. Emerg Microbes Infect 9, 727–732, doi: 10.1080/22221751.2020.1746199 (2020). [DOI] [PMC free article] [PubMed] [Google Scholar]
- 8.Hogan CA et al. High Frequency of SARS-CoV-2 RNAemia and Association With Severe Disease. Clinical Infectious Diseases, doi: 10.1093/cid/ciaa1054 (2020). [DOI] [PMC free article] [PubMed] [Google Scholar]
- 9.Xu D et al. Relationship Between Serum Severe Acute Respiratory Syndrome Coronavirus 2 Nucleic Acid and Organ Damage in Coronavirus 2019 Patients: A Cohort Study. Clinical Infectious Diseases, doi: 10.1093/cid/ciaa1085 (2020). [DOI] [PMC free article] [PubMed] [Google Scholar]
- 10.Fajnzylber J et al. SARS-CoV-2 viral load is associated with increased disease severity and mortality. Nature Communications 11, 5493, doi: 10.1038/s41467-020-19057-5 (2020). [DOI] [PMC free article] [PubMed] [Google Scholar]
- 11.Azghandi M & Kerachian MA Detection of novel coronavirus (SARS-CoV-2) RNA in peripheral blood specimens. Journal of Translational Medicine 18, 412, doi: 10.1186/s12967-020-02589-1 (2020). [DOI] [PMC free article] [PubMed] [Google Scholar]
- 12.Kuipers ME, Hokke CH, Smits HH & Nolte-’t Hoen ENM Pathogen-Derived Extracellular Vesicle-Associated Molecules That Affect the Host Immune System: An Overview. Frontiers in Microbiology 9, 2182 (2018). [DOI] [PMC free article] [PubMed] [Google Scholar]
- 13.Rodrigues M, Fan J, Lyon C, Wan M & Hu Y Role of Extracellular Vesicles in Viral and Bacterial Infections: Pathogenesis, Diagnostics, and Therapeutics. Theranostics 8, 2709–2721, doi: 10.7150/thno.20576 (2018). [DOI] [PMC free article] [PubMed] [Google Scholar]
- 14.Yáñez-Mó M et al. Biological properties of extracellular vesicles and their physiological functions. Journal of Extracellular Vesicles 4, 27066, doi: 10.3402/jev.v4.27066 (2015). [DOI] [PMC free article] [PubMed] [Google Scholar]
- 15.Longatti A The Dual Role of Exosomes in Hepatitis A and C Virus Transmission and Viral Immune Activation. Viruses 7, doi: 10.3390/v7122967 (2015). [DOI] [PMC free article] [PubMed] [Google Scholar]
- 16.Lian T & Ho RJY Trends and Developments in Liposome Drug Delivery Systems. Journal of Pharmaceutical Sciences 90, 667–680, doi: 10.1002/jps.1023 (2001). [DOI] [PubMed] [Google Scholar]
- 17.Sato YT et al. Engineering hybrid exosomes by membrane fusion with liposomes. Scientific Reports 6, 21933, doi: 10.1038/srep21933 (2016). [DOI] [PMC free article] [PubMed] [Google Scholar]
- 18.Jumeaux C et al. MicroRNA Detection by DNA-Mediated Liposome Fusion. ChemBioChem 19, 434–438, doi: 10.1002/cbic.201700592 (2018). [DOI] [PMC free article] [PubMed] [Google Scholar]
- 19.Gao X et al. Rapid Detection of Exosomal MicroRNAs Using Virus-Mimicking Fusogenic Vesicles. Angewandte Chemie International Edition 58, 8719–8723, doi: 10.1002/anie.201901997 (2019). [DOI] [PubMed] [Google Scholar]
- 20.Lin Y et al. Exosome–Liposome Hybrid Nanoparticles Deliver CRISPR/Cas9 System in MSCs. Advanced Science 5, 1700611, doi: 10.1002/advs.201700611 (2018). [DOI] [PMC free article] [PubMed] [Google Scholar]
- 21.Huang Z et al. Ultra-sensitive and high-throughput CRISPR-Powered COVID-19 diagnosis. Biosensors and Bioelectronics, 112316 (2020). [DOI] [PMC free article] [PubMed] [Google Scholar]
- 22.Zou L et al. SARS-CoV-2 Viral Load in Upper Respiratory Specimens of Infected Patients. N Engl J Med 382, 1177–1179, doi: 10.1056/NEJMc2001737 (2020). [DOI] [PMC free article] [PubMed] [Google Scholar]
- 23.Huang Z et al. Sensitive tracking of circulating viral RNA through all stages of SARS-CoV-2 infection. The Journal of Clinical Investigation 131, doi: 10.1172/JCI146031 (2021). [DOI] [PMC free article] [PubMed] [Google Scholar]
- 24.Fozouni P et al. Amplification-free detection of SARS-CoV-2 with CRISPR-Cas13a and mobile phone microscopy. Cell 184, 323–333.e329, doi: 10.1016/j.cell.2020.12.001 (2021). [DOI] [PMC free article] [PubMed] [Google Scholar]
- 25.Bruce EA et al. Direct RT-qPCR detection of SARS-CoV-2 RNA from patient nasopharyngeal swabs without an RNA extraction step. PLOS Biology 18, e3000896, doi: 10.1371/journal.pbio.3000896 (2020). [DOI] [PMC free article] [PubMed] [Google Scholar]
- 26.Kaul DR et al. Donor To Recipient Transmission Of SARS-CoV-2 By Lung Transplantation Despite Negative Donor Upper Respiratory Tract Testing. American Journal of Transplantation 0, doi: 10.1111/ajt.16532 (2021). [DOI] [PMC free article] [PubMed] [Google Scholar]
- 27.Au - Jin L, Au - Engelhart AE, Au - Adamala KP & Au - Szostak JW Preparation, Purification, and Use of Fatty Acid-containing Liposomes. JoVE, e57324, doi:doi: 10.3791/57324 (2018). [DOI] [PMC free article] [PubMed] [Google Scholar]
- 28.Kim D, Garner OB, Ozcan A & Di Carlo D Homogeneous Entropy-Driven Amplified Detection of Biomolecular Interactions. ACS Nano 10, 7467–7475, doi: 10.1021/acsnano.6b02060 (2016). [DOI] [PubMed] [Google Scholar]
- 29.Fan J et al. Chemoresistance Transmission via Exosome-Mediated EphA2 Transfer in Pancreatic Cancer. Theranostics 8, 5986–5994, doi: 10.7150/thno.26650 (2018). [DOI] [PMC free article] [PubMed] [Google Scholar]
Associated Data
This section collects any data citations, data availability statements, or supplementary materials included in this article.