

Abstract
Raspberry ketone (RK), a major flavor compound in red raspberries, has been marketed as a popular weight-loss dietary supplement with high potential in accumulating fatty tissues. However, challenges in extracting and characterizing phenolic compounds in fatty tissues persist due to the excessively high lipid content and the vast concentration ranges of phenolic constituents accumulating in adipose tissues. In this work, we reported a high-throughput sample preparation method for RK and 25 related phenolic compounds in white adipose tissues using an improved micro-scale QuEChERS (quick, efficient, cheap, easy, rugged and safe) approach with enhanced matrix removal (EMR)-lipid cleanup in 96-well plates, followed by UHPLC-QqQ-MS/MS analysis. The absolute recovery at the extraction step was 73~105%, and achieved 71~96% at the EMR cleanup step. The EMR cleanup removed around 66% of total lipids in the acetonitrile extract as profiled by UHPLC-QTOF-MS/MS. The innovative introduction of a reversed-phase C18 sorbent into the extract significantly improved the analytes’ recovery during SpeedVac drying. The final accuracy achieved 80~120% for most analytes. Overall, this newly developed and validated method could serve as a powerful tool for analyzing RK and related phenolic compounds in fatty tissues.
Keywords: raspberry ketone, bioavailability, fatty tissue, lipid removal, solid phase extraction, UHPLC-QqQ-MS/MS
Graphical Abstract

1. Introduction
Accurate and efficient analyte determination in high-fat matrices has always been a challenging task. Analyte extraction is typically achieved using solid-liquid, semisolid-liquid or liquid-liquid extraction. Yet, the presence of excessive amount of lipids in the matrix can lead to low extraction recovery and repeatability due to various binding effects. Moreover, the undesired lipids co-extracted from the matrix may contribute significantly to the deterioration of the chromatographic column and the suppression of ionization in the mass spectrometer. High efficiency and consistency in both analyte extraction and sample cleanup procedures are crucial for successful downstream analysis particularly in fatty tissues. In the recent decade, the QuEChERS (quick, easy, cheap, effective, rugged and safe) methodology has become widely applied for analyzing a diverse range of analytes in different matrices (Table 1). The QuEChERS method was first published by Anastassiades et al. in 2001 for analysis of multi-residue pesticides in fruits and vegetables [1, 2], and later standardized as the official pesticide analysis method by the Association of Official Analytical Collaboration International (AOAC) [3] and European Committee for Standardization (CEN) [4] in 2007 and 2008, respectively. This approach typically involves extraction of analytes using acetonitrile (ACN) (occasionally with other organic solvents) from an aqueous matrix, and the ACN layer is then salted out from the aqueous base by extraction salt of magnesium sulfate and sodium chloride (also referred to as the polishing salt). The high ionic strength in the aqueous phase forces more analytes to enter the ACN phase resulting in high recovery. The ACN extract is then cleaned up with one or a mixture of different types of dispersive solid phase extraction (d-SPE) sorbents. The most used d-SPE sorbents include primary secondary amine (N-isopropylethylenediamine or PSA), graphitized carbon black (GCB), octadecyl (C18) silica, Z-Sep (zirconium oxide ZrO2 bonded to silica) and Z-Sep Plus (ZrO2 and C18 dual bonded to silica) [5–12]. Other reported sorbents include chitin derived from shrimp shell waste [13], multi-walled carbon nanotubes (MWCNT) [14], composite of MWCNT with amine-functionalized magnetic Fe3O4 nanoparticles [15], and amine modified graphene [16]. With particular regard to cleanup of extract from fatty and other complex matrices, many of these sorbents have been applied with success, such as for cleanup of high-fat fish and meat, oil-enriched plants and beeswax, as summarized in Table 1. The use of these dispersive sorbents has also been reported to provide better results than traditional cleanup methods. For example, mixed PSA and C18 were found more effective for coextractives removal from acetonitrile extract of flaxseed oil than gel permeation chromatography, and reduced the co-extractive weight ca. four times more than the traditional low-temperature fat precipitation method [5].
Table 1.
Representative QuEChERS and related methods in the literature for various analyte analyses in high-fat matrices.
| No. | Analytes | Matrix | Extraction solvent # | Extraction salt | Dispersive sorbent* | Instrument | Reference |
|---|---|---|---|---|---|---|---|
| 1 | 34 pesticides | Flaxseeds, peanuts and dough (11.4 ~ 42.2% lipid in sample) | ACN | MgSO4 & NaCl (4:1) | PSA & C18 (3:1) | GC-TOF MS | Thailand & USA [5] |
| 2 | 33 polycyclic aromatic hydrocarbons | High-fat smoked salmon (3~11% fat in sample) | Acetone, ethyl acetate & isooctane (2:1:1) | MgSO4 & NaCl (4:1); or MgSO4, NaCl, TC & DH (4:1:1:0.5) | PSA, C18 & MgSO4 (1:1:3) | GC-MS (SIM) | USA [6] |
| 3 | 3 pesticides | Meat and bovine fat | ACN | MgSO4 & NaCl (4:1) | PSA & C18 (1:1) for meat; PSA alone for bovine fat (following hexane defatting) | GC-MS(SIM) | Brazil [7] |
| 4 | 136 pesticides | Avocado | ACN with 1% AA | MgSO4 & NaOAc (4:1) | PSA, C18 & MgSO4 (1:1:3) § | LC-MS (79 analytes) & GC-MS (57 analytes) | USA [8] |
| 5 | 28 pesticides | Rapeseed, soybean, peanut & sesame seeds | ACN | NaCl | Amine-modified graphene | UHPLC-MS/MS | China [16] |
| 6 | 15 polycyclic aromatic hydrocarbons | Salmon | ACN | MgSO4 & NaCl (4:1) | EMR-lipid ₡ | GC-MS | USA [17] |
| 7 | 7 neonicotinoid insecticides | Cocoa beans and shells | ACN | MgSO4 & NaOAc (4:1) | PSA, C18 & GCB (1:1:1) | HPLC-MS/MS | Ghana & Denmark [28] |
| 8 | 67 pesticides | Olive, olive oil and avocado | ACN | MgSO4 & NaCl (4:1) | EMR-lipid | UHPLC-MS/MS | Spain [19] |
| 9 | 28 carbamates | High-fat cheese | ACN with 1% AA | MgSO4 & NaCl (4:1) | Z-Sep plus (ZrO2 and C18 dual bonded to silica) | UHPLC-MS/MS | Spain [10] |
| 10 | 205 pesticides | Spices | ACN | MgSO4 NaCl, TC & DH (4:1:1:0.5) | EMR-lipid | GC-MS/MS | Spain [20] |
| 11 | 7 neonicotinoid insecticides | Beeswax | Methanol and ethyl acetate (7:3) | No salt used (no liquid-liquid partition) | EMR-lipid | UHPLC-QTOF | Spain [29] |
| 12 | 39 veterinary drugs | Pork and bovine muscle, porcine and chicken liver and kidney, etc. | EDTA solution. ACN with 2% FMA and 2% DMSO | No salt used (no liquid-liquid partition) | EMR-lipid (cartridge format) | UHPLC-MS/MS | USA [18] |
| 13 | methyldibromo glutaronitrile (a now-prohibited preservative) | Creamy cosmetic products | ACN | No salt used (no liquid-liquid partition) | EMR-lipid | GC-MS | Italy [30] |
| 14 | Cholesterol and its 7 oxidative products | Meat from pork, chicken & fish; fat of tallow, lard and butter | Acetone | MgSO4 & NaOAc (4:1) | PSA, C18 & MgSO4 (1:1:3) | GC-MS | China [9] |
| 15 | 5 heterocyclic amines | Cooked beef, chicken and bacon (3~43% fat in samples) | ACN with 1% FMA (for beef) or 2% FMA (for chicken and bacon) | MgSO4 & NaCl (4:1) | EMR-lipid ₡ | UHPLC-MS/MS | USA [31] |
| 16 | flubendiamide (a pesticide) | bee pollen | ACN | NaCl | EMR-lipid (4 min dry ice chill before clean up) | HPLC-MS | Spain [32] |
| 17 | 21 polycyclic aromatic hydrocarbons | Smoked mackerel fish | ACN | MgSO4 & NaCl (4:1) | EMR-lipid | GC-MS | Czech & Poland [33] |
| 18 | 26 phenolic compounds | Mouse white adipose tissue | ACN | MgSO4 & NaCl (4:1) | EMR-lipid (96-well plate) | UHPLC-MS/MS | Our method |
Abbreviations: PSA, primary secondary amine (N-isopropylethylenediamine); GCB, graphitized carbon black; EMR, enhanced matrix removal; NaOAc, sodium acetate; TC, trisodium citrate dihydrate; DH, disodium hydrogencitrate sesquihydrate; AA, acetic acid. SIM, selected ion monitoring.
, mixed extraction solvent is noted by the volume ratio in the parenthesis.
, the sorbents are in dispersive format unless otherwise specified. Mixed sorbents of different types are noted by the mass ratio in the parenthesis. The MgSO4 of this table all refers to the anhydrous format.
, for analytes using LC-MS, the ACN extract was directly injected into LC-MS after extraction without sorbent cleanup.
, sample preparation involved EMR cleanup, followed by salting-out of the ACN layer, a reverse order of the typical QuEChERS procedure where salting-out precedes sorbent cleanup.
Among the various d-SPE sorbents, EMR-lipid stands out as a next-generation sorbent introduced in recent years and is especially designed for removing lipids from sample matrices for improved recovery [17]. Based on the principles of size-exclusion and hydrophobic interaction chromatography, it selectively traps major classes of lipids from bio-matrices while leaving the analytes in the eluent [18]. EMR-lipid has been applied for cleanup of the extract from various matrices such as fish, meat, oil crops, beeswax and cosmetics (see Table 1). Compared with mixed C18 and PSA, Z-Sep and Z-Sep plus, EMR has been shown to give the highest analyte recovery and the lowest matrix effect when dealing with lipid-rich materials, such as olive, olive oil and avocado for pesticide analysis [19]. In a separate study on the analysis of pesticides in spices, EMR sorbent better clarifies sample extracts than PSA, Z-Sep, Oasis®Prime HLB, and Supelclean™Ultra cartridges respectively comprising a top bed of PSA, C18 and GrashsphereTM2031 and a bottom bed of Z-Sep [20].
Raspberry ketone (RK; 4-(4-hydroxyphenyl)-butan-2-one) is a key phenolic aroma compound naturally present in red raspberries (Rubus idaeus), and it is generally recognized as safe (GRAS) as a flavoring agent added to cosmetics and food products [21]. In recent years, RK has been marketed in the US as a dietary supplement for weight control given its efficacy in limiting fat accumulation in white adipose tissue in rodents [22–24]. Our previous bioavailability studies on RK and its structurally associated phenolic metabolites in mice provide important insight into its metabolism and pharmacokinetic behaviors [25]. Notably, we found that adipose tissues tend to take up higher amount of RK and its structurally related metabolites with longer half-life in obese mice than the normal-weight ones. Although we have reported a validated UHPLC-MS/MS method for RK and 25 associated phenolic compounds in mouse plasma and brain samples [26], this sample preparation method involving ethyl acetate extraction was inappropriate for processing adipose and other fatty tissues due to the excessive amount of lipids extractable into ethyl acetate. Thus, an improved sample preparation and cleanup method was still needed. In this current work, we reported a novel sample preparation method for analysis of RK and 25 other phenolic compounds in white adipose tissues. To address problems with the complex lipid-rich matrices, we newly developed and validated a high-throughput analyte extraction and sample cleanup method by applying the QuEChERS methodology and the next-generation EMR sorbent in a 96-well plate form. In addition, we also reported the use of silica gel and reversed-phase C18 sorbent for their protective effects against analytes loss during SpeedVac concentration and reconstitution.
2. Experiment
2.1. Chemicals and reagents
Twenty-six phenolic compounds were investigated [25, 26], including phenolic aldehyde and derivatives: 4-(4-hydroxyphenyl)-butan-2-one (RK) (1), 4-(4-methoxyphenyl)-2-butanone (RK-Me) or anisylacetone (2), benzylideneacetone (PhLiAce) (3), 3, 4-dihydroxybenzylideneacetone (3, 4-DHPhLiAce) (4), vanillylacetone (VLAce) (5), vanillylidenacetone (VLiAce) (6); phenolic alcohol derivatives: 4-(4-hydroxyphenyl)-2-butanol (ROH) or rhododendrol (7), 2-(4-hydroxyphenyl) ethanol or tyrosol (4-HPE) (8), 2-(3, 4-dihydroxyphenyl) ethanol (3, 4-DHPE) or 3-hydroxytyrosol (9), 4-hydroxybenzyl alcohol (4-HBOH) (10); phenylpropionic derivatives: 3-(3-hydroxyphenyl) propionic acid (3-HPPA) (11), 3-(4-hydroxyphenyl) propionic acid (4-HPPA) (12), 3-(3, 4-dihydroxyphenyl) propionic acid (3, 4-DHPPA) (13), 3-(3-methoxy, 4-hydroxyphenyl) propionic acid or dihydroferulic acid (DFA) (14), cinnamic acid derivatives: 4-hydroxycinnamic acid (4-HCA) or p-coumaric acid (15), ferulic acid (FA) (16), caffeic acid (CA) (17); phenyl acetic derivatives: 3-hydroxyphenylacetic acid (3-HPAA) (18), 4-hydroxyphenylacetic acid (4-HPAA) (19), 3, 4-dihydroxyphenylacetic acid (3, 4-DHPAA) (20); benzoic acid derivatives: 3-hydroxybenzoic acid (3-HBA) (21), 4-hydroxybenzoic acid (4-HBA) (22), 3, 4-dihydroxybenzoic acid (3, 4-DHBA) or protocatechuic (23), vanillic acid (VA) (24), homovanillic acid (HYA) (25), and hippuric acid (HA) (26). 4-Hydroxybenzoic-d4 acid (27) and trans-cinnamic acid-d7 (28) were used as internal standards (IS). The chemical structures and association of analytes with IS have been presented in our previous report [26]. The reference standards for all analytes and β-glucuronidase (from limpets (Patella vulgate), ≥85,000 units/mL, in contamination with sulfatase) were purchased from Sigma-Aldrich (St. Louis, MO, USA), except that standards of 4 and 14 were acquired from Alfa Aesar (Tewksbury, MA, USA), 7 from USP (Rockville, MD, USA), and 16 and 23 from ChromaDex (Irvine, CA, USA). Other reagents including LC/MS grade formic acid, water, acetonitrile, isopropanol and ammonium formate, and ACS grade anhydrous magnesium sulfate and sodium chloride were obtained from Fisher Scientific (Waltham, MA, USA). The sorbents investigated were silica gel, 28~200 mesh (640~74 μm), from Sigma-Aldrich; thin layer chromatography (TLC) silica gel 60 H, 15 μm, from Millipore (Burlington, MA, USA); and Partisil octadecyl C18 silica gel (ODS), 40 μm, from Whatman (Maidstone, United Kingdom).
2.2. Analytical instruments and equipment
Analysis of phenolic compounds was performed using Agilent 1290 Infinity II UHPLC interfaced with 6470 triple quadrupole mass spectrometry (QqQ-MS/MS) with an electrospray ionization (ESI) source with jet stream (Santa Clara, CA). Nitrogen supplied from Parker Balston NitroFlow 60 NA nitrogen generator (Lancaster, NY) was used as the ESI gas and collision gas. The column used was Waters Acquity UPLC BEH C18 column (50 × 2.1 mm, 1.7 μm) with a VanGuard Acquity C18 guard column (5 × 2.1 mm, 1.7 μm) (Milford, MA). The software was MassHunter Workstation Data Acquisition B.08.00, Qualitative Analysis B.07.00 and Quantitative Analysis B.07.01. Sample cleanup was achieved using Agilent Captiva EMR-lipid in 96-well plate (40 mg) and the associated collection plate (Santa Clara, CA), and a Waters 96-well extraction plate vacuum manifold (Milford, MA). The vacuum pump used was a Brinkmann water-recirculating vacuum aspirator, with aspiration hose connected with valves for fine-control of the vacuum. Solvent evaporation and removal were conducted using Thermo Scientific Savant SpeedVac concentrator AES2010 (Waltham, MA).
Analysis of lipids in the extract prior to and after EMR cleanup was conducted using Agilent 1290 Infinity II UHPLC interfaced with 6546 quadrupole time-of-flight mass spectrometry (QTOF). An Agilent Zorbax SB-C18 (100 × 2.1 mm, 3.5 μm) column was used for chromatographic separation with the installation of an SB-C18 guard column (5 × 2.1mm, 1.8 μm).
2.3. Adipose tissue collection
Seven-week-old male C57BL/6J mice (Jackson Laboratory, Bar Harbor, ME) were fed a polyphenol-free diet (D12450H; Research Diets, Inc., New Brunswick, NJ; 10% fat, 20% protein, 70% carbohydrate; 3.85 kcal/g) for 14 days before euthanasia for sample collection. The mice were deeply anesthetized with isoflurane and euthanized for collection of the epididymal white adipose depot. The adipose tissue was mixed with 0.2% formic acid at 1:2 w/v, homogenized into a fine creamy slurry and snap frozen in liquid nitrogen and stored at −80 °C till analysis. All protocols involving animals were approved by the Institutional animal Care and Use Committee of Rutgers University (OLAW #A3262-01).
2.4. Sample extraction (micro QuEChERS approach) and clean-up
The samples were thawed on ice before analysis. An aliquot of 200 μL of thawed adipose slurry was mixed with 260 μL NaH2PO4 buffer solution (pH 5.4) and 80 μL beta-glucuronidase (2000 U, prepared in NaH2PO4 buffer, in contamination with sulfatase), and incubated under 37 °C for 45 min . After enzymatic digestion, an aliquot of 600 μL acetonitrile (ACN) with 4% formic acid (FMA) was added and vortexed for 20 seconds to extract the analytes. Approximately, 240 mg (220~250 mg weighed in practice) of premixed extraction salt of anhydrous magnesium sulfate and sodium chloride at a mass ratio of 4:1 was added into the sample, vigorously vortexed and manually shaken for 1 min. The sample was centrifuged at 10,000 rpm for 10 min. After centrifuge, the fat matrix appeared to be tightly sandwiched between the upper ACN layer (slightly over 600 μL) and the bottom salt-containing aqueous layer. To avoid disturbing the fat matrix, an aliquot of 600 μL of the ACN layer was taken and transferred to an EMR-lipid 96-well plate, and carefully mixed in-well with the pre-added 100 μL water containing 4% FMA. The EMR sorbents were activated with 400 μL 80% ACN containing 4% FMA before the addition of water and ACN. To accommodate the different elution rate in wells of different positions in the plate, elution was conducted under progressively increased vacuum from 1 to 5 inch mercury (in.Hg) at an increment rate of 0.5 in.Hg, and each step was held for 1 min. The plate was covered with a rubber seal to maintain a vacuum environment. A second wash was applied using 200 μL 80% ACN with 4% FMA and eluted under gradually increased vacuum condition in like manner, and finally purged under higher vacuum at 10 in.Hg for 5 seconds to ensure complete elution. The eluent was transferred to 1.5 mL Eppendorf tubes pre-loaded with 2~5 mg reversed-phase C18 sorbent powder, and subjected to dryness using the SpeedVac concentrator under high drying rate. The dried residue was then reconstituted in 200 μL 60% methanol with 0.1% FMA, vigorously vortexed and then centrifuged at 10,000 rpm for 10 min. An aliquot of 50 μL of the supernatant was transferred to an HPLC vial with insert and was ready for UHPLC-QqQ-MS/MS analysis (Section 2.5). The sample preparation procedure is summarized in Fig. 1.
Fig. 1.
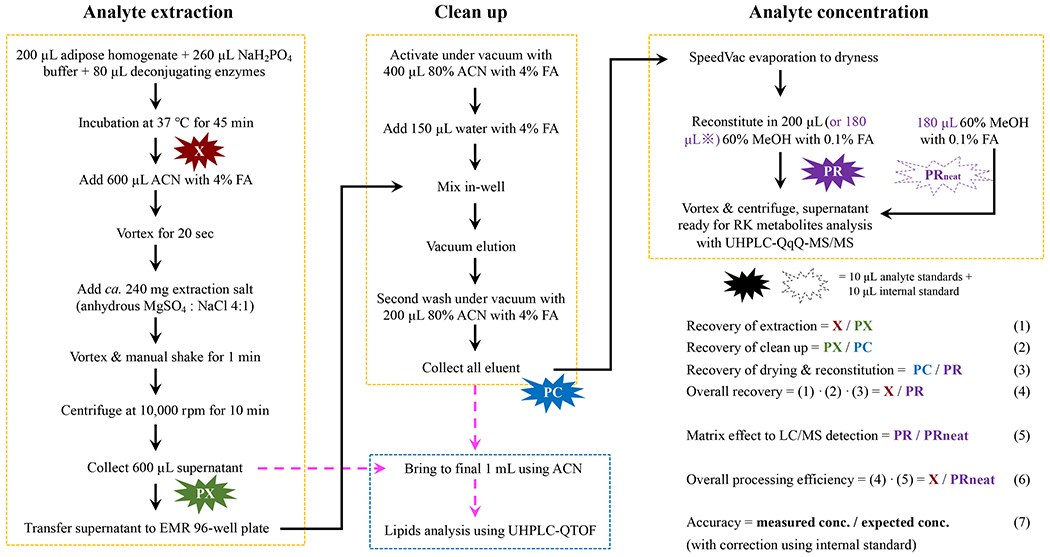
Sample preparation and validation workflow for analysis of raspberry ketone (RK)-related phenolic metabolites in mouse adipose tissue using QuEChERS (quick, easy, cheap, efficient, rugged and safe) and EMR (enhanced matrix removal)-lipid 96-well plate. Abbreviations: ACN, acetonitrile; FMA, formic acid. The black solid lines indicate the workflow for analysis of phenolic metabolites, and the magenta dashed lines indicate the workflow for assessment of lipid removal efficiency through comparison of lipid content in the ACN extract before and after EMR cleanup. The peak area of analytes and internal standard spiked at various steps are noted as: X, prior to extraction; PX, post-extraction and prior to EMR clean up; PC, post-clean up and prior to SpeedVac drying; PR, post-reconstitution in solvent. ※, this PR step involves reconstitution of the dried residue in 180 μL solvent, followed with the addition of 26-analytes standard mixture (10 μL) and internal standard (10 μL) to make a total of 200 μL. PRneat involves spiking directly in neat solvent without biomatrices.
2.5. UHPLC-QqQ-MS/MS method for phenolic compound analysis
The method was based on our earlier report with modifications [26]. For chromatographic separation, mobile phase A was water with 0.05% FMA and mobile phase B was ACN with 0.05% FMA. The flow rate was 0.45 mL/min. The gradient elution (noted as B%) was 5% at 0 min, 10% at 0.5 min, 28% at 3.8 min, 40% at 3.9 min, 55% at 5.5 min, 80% at 5.6 min and then kept isocratically until 7 min. The column was equilibrated for 2 min before the next injection. The column was thermostatted at 30 °C and the autosampler was maintained at 4°C. The injection volume was 3 μL. For the MS part, the drying gas temperature was at 250°C with a flow rate of 12 L/min, sheath gas at 250 °C and 8 L/min, nebulizer pressure at 30 psi, capillary voltage at +3000 V/ −2500 V, and nozzle voltage of+1500 / −1000 V. The MS was operated in dynamic multiple reaction monitoring (dMRM) mode with switching polarities, at a cycle time of 600 ms. The precursor-to-product ion transitions were the same as previously reported [26]. Representative chromatograms are shown in Figs. 2 and S1.
Fig. 2.

Representative multiple reaction monitoring (MRM) chromatograms of individual analytes. The quantifier and qualifier peak is solid black and blue colors, respectively. All standards were spiked into adipose tissue at an injection concentration of ca. 100 ng/mL.
2.6. Micro QuEChERS-EMR-lipid method validation
The sample preparation method was validated for recovery, matrix effect and accuracy in a stepwise manner. A mixture of 200 μL of adipose homogenate was digested with the deconjugating enzyme solution and further processed using the QuEChERS and EMR method as described in Section 2.4 and Fig. 1. The blank samples (unprocessed tissue homogenate) were spiked with 10 μL analyte standards and 10 μL of IS. To investigate the stepwise recoveries along the sample processing procedure, spiking was conducted at different steps: 1) before ACN extraction (noted as the step X), 2) post-extraction and prior to EMR cleanup (PX), 3) post-cleanup and prior to SpeedVac concentration (PC), and 4) after SpeedVac drying and reconstitution and prior to QqQ-MS/MS analysis (PR). Samples spiked at steps of X, PX and PC were eventually recovered in 200 μL reconstitution solvent of 60% methanol with 0.1% FMA, and samples spiked at PR were recovered in 180 μL solvent (plus the spiked 10 μL analyte standards and 10 μL IS to make a total of 200 μL). The analyte recovery at different processing steps, i.e., extraction, EMR-cleanup, and SpeedVac drying and reconstitution, was computed and respectively denoted as X/PX, PX/PC, and PC/PR, with each term here referring to the peak area of analytes spiked at the corresponding step. In addition, 10 μL of analyte standard and 10 μL of IS were spiked into 180 μL of the reconstitution solvent (note as PRneat) in the absence of biomatrices, and the matrix effect was calculated as PR/PRneat. The IS-corrected recovery and matrix effect was calculated using the same formula, but with each term divided by the peak area of the respective IS (selection of the IS refers to our earlier work [26]). Accuracy was determined as the calculated concentration divided by the theoretical value. Accuracy was validated at four concentration levels noted as A, B, C and D, corresponding to respectively ca. 1000, 500, 100 and 20 ng/mL in the final reconstituted sample extract before UHPLC-MS/MS analysis. Stepwise and overall recoveries, matrix effect, and overall processing efficiency were validated at level B.
2.7. Assessment of lipid removal efficiency
To evaluate the removal efficiency of lipids and other matrix following EMR filtration, 600 μL of the ACN supernatant acquired after extraction, and the total eluent collected after EMR cleanup (ca. 800 μL) were each brought to a final volume of 1 mL with ACN. The samples were centrifuged at 10,000 rpm for 10 min, and then the supernatant was ready for analysis of lipids in the ACN extract using UHPLC-QTOF/MS (Section 2.8). The workflow is depicted as the magenta line in Fig. 1. The lipid removal efficiency was calculated as the total lipid peak area after EMR cleanup divided by the peak area before cleanup.
2.8. UHPLC-QTOF/MS for lipid analysis
For the chromatographic part, the mobile phase A was 60% ACN in water, and mobile phase B was 9.5% ACN and 0.5% water in isopropanol (IPA), both mobile phases modified with 10 mM ammonium formate with 0.1% FMA. The flow rate was 1.2 mL/min. The linearly programmed gradient was 15% B at 0 min, 45% B at 2 min, 60% B at 3 min and held till 10 min, 99% B at 15 min and held till 20 min, then back to 15% B at 20.5 min. The column was equilibrated with 15% B for 1 min between injections. The column was thermostatted at 60°C. The autosampler was set to 4°C. The injection volume was 1 μL. Needle wash was conducted using IPA for 10 seconds. For the MS part, the nebulizer was set at 35 psi and the nozzle voltage at 1 kV. The drying gas was 200 °C with a flow rate of 13 L/min. The sheath gas was 350 °C with a flow rate of 11 L/min. The scan was performed in positive mode from 399 to 1700 m/z with an acquisition speed at 6 spectra per second. Qualitative Analysis B.10.00, Profinder B.10.00 and PCDL manager B.08.00 were used for data processing. Detailed data processing procedure is provided in the supplementary material.
2.9. Statistics analysis
Data analyses were conducted using R and the script refers to https://yuanbofaith.github.io/RK_adipose_QuEChERS_EMR/.
3. Results and discussion
3.1. Micro QuEChERS EMR-method development
This work reported for the first time the application of a micro-scale QuEChERS method in conjunction with a next-generation EMR sorbent in a 96-well plate system for extraction and cleanup of RK and 25 related phenolic compounds in mouse white adipose tissues. While most published QuEChERS methods involve grams of material to extract from and the extraction is usually performed in a 50 mL tube, in this work, given the limited amount of adipose tissues available from each mouse, a newly-developed micro QuEChERS extraction method was scaled down to perform in 2.0 mL eppendorf tubes. Formic acid was added to ACN at 4% to bring down the pH of NaH2PO4 buffer from 5 to ca. 2.5 for enhanced stability of most phenolic compounds. The ratio used among the quantities of biomatrix (including buffer and enzyme), extraction solvent and extraction salt followed the AOAC standard protocol [3] and those practices commonly cited in literature (Table 1).
The QuEChERS method typically involves the use of dispersive SPE (d-SPE) for sample cleanup, and the dispersive format of SPE allows for “on-line” cleanup that is more streamlined than traditional cartridge-based SPE method. When handling a large number of samples, however, d-SPE processing could still be time-consuming. In this work, we report the use of SPE in the 96-well plate format for further improved throughput. In addition, to achieve selective lipid removal, the novel sorbent of EMR was used. While EMR sorbent activation and conditioning (column wetting with solvent before sample loading) was not applied in earlier reports [18, 27], we found that activation and conditioning with 200 ~ 400 μL of 80% ACN resulted in higher recovery and reproducibility. Analyte elution was conducted with 80~85% of ACN (with 4% FMA to be consistent with the extraction solvent) as previously reported [18], which was sufficient to recover the majority of the analytes while meantime trapping undesired lipids in the sorbent. A second wash with 200 μL of 80% ACN with 4% FMA further improved the recovery for most of the analytes by 5~25%. A volume of second wash beyond 200 μL did not significantly increase the recovery. Another critical parameter to be controlled during EMR cleanup is the elution rate that should be slow enough to allow the lipids to have sufficient time to interact with the sorbent for effective trapping. Wells in different plate positions presented noted difference in elution rate. To accommodate such variance, vacuum pressure was applied incrementally to ensure consistent result across wells.
3.2. Reducing analyte loss during SpeedVac drying via sorbent addition
While SpeedVac drying before the subsequent reconstitution with a small volume of solvent is a widely applied sample concentration procedure for phenolic compounds and their derivatives, this step alone was found to be a major source of analyte loss in this work. Among all analytes investigated, the recovery of some early to midtime-eluted compounds, particularly 4-HBOH, CA, 3, 4-DHPPA and 3, 4-DHPAA, was only ca. 10~20%, and recovery of the later eluted RK-Me and PhLiAce was less than 1% (in the absence of biomatrical coextractives), as shown in Fig. 3A. The cause of analyte loss remains elusive.
Fig. 3.
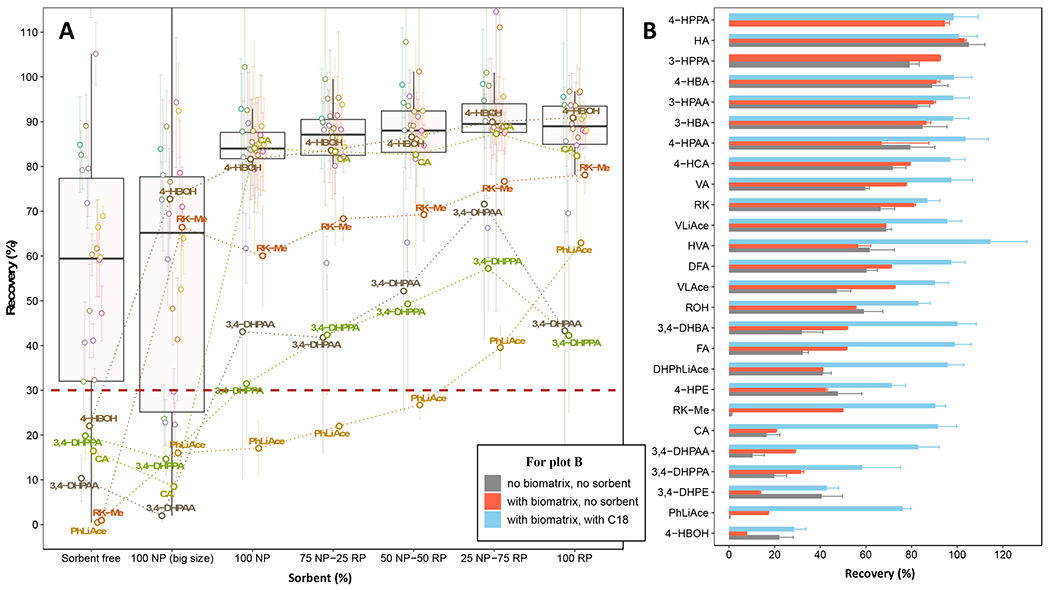
Effect of sorbent and biomatrical coextractives on the recovery of analytes during SpeedVac drying and reconstitution. (A), Effect of sorbent formulation on the recovery of analytes during SpeedVac drying in the absence of biomatrical coextractives. NP (big size), NP and RP refer to the corresponding normal phase (NP) or reversed phase (RP) sorbents with particle size or diameter of 74~640 μm, 15 μm and 40 μm, respectively. About 10 mg sorbent was applied per 600 μL ACN with 4% FMA during drying. (B), effect of biomatrical coextractives and RP C18 sorbent (40 μm) on the recovery of analytes. 2~5 mg sorbent was used per 700~800 μL ACN extract with 4% FMA.
Interestingly, the addition of silica gel or reversed-phase C18 sorbent to the analyte extract (ca. 2~10 mg per 600 μL ACN extract) before SpeedVac drying, i.e., drying and reconstitution with the sorbent, remarkably protected against analyte loss and therefore significantly improved the recovery. For example, in the presence of the normal phase silica gel (74~640 μm), the recovery of 4-HBOH was improved from 22% to 73%, RK-Me from 0.9% to 66%, and PhLiAce from 0.4% to 16%. Using silica gel of smaller particle diameter (15 μm) led to further improvement in the majority of the 26 analytes with recovery mostly above 80%, including CA and 4-HBOH. This was probably a result of the increased surface area provided by the smaller sized sorbent and thus better protective adsorption effect during the drying step. In addition, sorbent with smaller particle size was also found to significantly reduce the required drying time by ca. one hour than using those with larger particle sizes. Blending with reversed-phase C18 sorbent (40 μm) appeared to further improve the analyte recovery by providing an opposite adsorptive affinity. Such improvement was particularly efficient for certain analytes while marginal to moderate for most others. For example, 3,4-DHPAA and 3,4-DHPPA showed the highest recovery of ca. 55~70% at a 25:75 blending ratio of the normal and C18 sorbent, while PhLiAce showed the most improved recovery up to 62.9% when using the C18 sorbent alone (Fig. 3A, without the presence of biomatrical coextractives). Based on our optimization results, the reversed-phase C18 sorbent was applied in the final method.
While the presence of the coextracted biomatrical substance in the extract is generally considered unfavorable to analyte recovery, the adipose coextractives investigated in this work appeared to be protective against analyte loss during SpeedVac drying and reconstitution, resulting in comparable or higher recovery for most compounds than without the coextractives (Fig. 3B, red vs. grey bars). In particular, PhLiAce and RK-Me, which were less than 1% recovered in pure solvent after SpeedVac drying as aforementioned, showed much improved recovery (up to 17% and 48%, respectively) in the presence of coextractives. This observation indeed lead us to use sorbents to achieve enhanced adsorptive protection, which provided an efficient solution for analyte loss during sample concentration. In the presence of coextractives and the addition of C18 sorbents (2~5 mg per ca. 700 μL ACN extract), the recovery of all compounds was further improved by 3~71%, with the final recovery of PhLiAce and RK-Me respectively elevated to 78% and 90% (Fig. 3B, blue vs. red bars; also see Fig. S1).
3.3. QuEChERS-EMR and UHPLC-MS/MS method validation
The developed QuEChERS-EMR and UHPLC-MS/MS method was validated for its stepwise recovery, matrix effect and accuracy (refer to Fig. 1 for individual steps). The absolute recovery (AR) reflects the analyte loss during sample preparation, and mirrors the decreases in signal response and detection sensitivity. The AR, however, does not account for the loss adjusted by IS, and is not directly associated with the final method’s accuracy. The IS-corrected recovery (CR) is calculated similarly as AR, except that the analytes peak area is divided by the peak area of the respective IS. Therefore, CR reflects the final recovery after loss-adjustment. It is not informative of analyte loss that occurred during sample preparation, but is directly relevant to the method’s final accuracy. The AR at the extraction step for all 26 analytes ranged from 73 to 105%, showing ideal extraction efficiency. The IS adjusted for such loss and allowed CR to reach 79~125%. The AR at the sample cleanup step using EMR was 71~96%, and the CR for all analytes at this step was 79~99%. The AR and CR at the step of SpeedVac drying and reconstitution was 80~120% for most analytes, but for some analytes the loss was significant, such as 4-HBOH and 3, 4-DHPE with AR and CR of only 28~61% (even with the use of C18 sorbent). For the significantly lost analytes, since the loss of IS at this step was much less, IS did not provide sufficient correction effect on recovery. The overall AR for the entire sample preparation process, from extraction to final reconstitution, was mostly 50~90%, and the CR was 60~110% (Fig. 4A).
Fig. 4.

Validation parameters of the entire protocol (QuEChERS + EMR-lipid cleanup + UHPLC-MS/MS analysis). (A), absolute and IS-corrected recovery at each processing step: extraction (1), EMR sample cleanup (2), SpeedVac drying and reconstitution (3), and matrix effect (ME) at the electrospray ionization (ESI) (4). (B), streamlined flow chart of the absolute (red) and IS-corrected (blue) recovery for RK and one of its major metabolite rhododendrol (ROH). Numbers in empty rectangles along the vertical lines indicate the analytes’ loss at each the given processing step, and numbers in filled rectangles along the horizontal lines indicate the accumulated recovery at the given step since start. (D), correlations between validated accuracy variance with spike level and background content.
The matrix effect (ME) in the ESI chamber reflects ionization suppression of the analytes caused by coeluted biomatrical substances in the injected sample, and IS can be used for correction of such effects in like manner as for recovery. While EMR was an efficient method for removal of lipids and other matrices (Section 3.4, Fig. 5), a noticeable ME still existed in the range of 60~91% for most analytes. The use of IS corrected for such effect and gave the corrected ME (CME) at 75~119%. While the biomatrical coextractives usually suppress ionization in the ESI chamber, it is interesting to note in this work that the coextractives generated remarkable signal boosting effects for CA, 4-HBA and 3,4-DHBA, with their ME calculated to be 119~128%, and the CME reached 147~158%.
Fig. 5.

Assessment of matrix removal efficiency using the EMR 96-well plate. (A), total ion chromatogram (TIC) of the lipophilic coextractives in the acetonitrile extract before (red trace) and after (black trace) the EMR cleanup; (B) identities of major peaks; (C) comparison of total peak area of identified compounds. Abbreviations: PC, glycerophosphocholine; PS, glycerophosphoserine; PE, glycerophosphoethanolamines; PS, glycoerophosphoserines; SM, sphingomyelins; DG, diradylglycerolipids; TG, triradylglycerolipids.
The processing efficiency (PE) manifests the collective effect of overall AR and ME, and reflects the analyte and signal loss or gain end-to-end from sample preparation to instrumental data acquisition. The PE for most analytes were 33~66%, and the IS-corrected PE (CPE) were 51~105%. Analytes of 4-HBOH and 3, 4-DHPE, however, had low PE of 12~15% and CPE of 18~23% due to significant loss during the drying step. For CA, 4-HBA and 3, 4-DHBA, though having a good PE of 94~101%, gave much elevated CPE (144~163%) after IS-correction due to the excessive ionization enhancement exerted by the ME.
A stepwise dissection of the recovery and matrix effect with or without the IS correction as aforementioned is of great value for validation analysis. In this work, we visualized such analytes / signal loss and gain as a streamlined flow chart throughout the processing procedure (see Fig. 4B for RK and ROH; for all the other phenolic compounds, refer to https://yuanbofaith.github.io/RK_adipose_QuEChERS_EMR/Stepwise_Recovery_linePlot.html). As clearly shown from the streamlined plot analysis, although the analyte loss (except those special cases with positive ME effects) at each processing step may not constitute a concern, the accumulated loss across all steps can be very significant. The inclusion of IS was of vital importance to compensate for such loss, with overall correction efficacy (i.e., regarding the CPE) for most analytes by 20~40%.
The validated accuracy was calculated taking the entire dynamic linear range into consideration. The accuracy assessed at four spike levels (ca. 2000, 500, 100 and 20 ng/mL in injected samples) for the analytes was mostly 80~120% (Fig. 4B), though for analytes such as CA and 3, 4-DHBA exhibiting signal-enhancing ME, the recovery was much higher (up to 160%), and for analytes with considerable loss during the drying step, such as 4-HBOH and 3, 4-DHPE, the accuracy was undesirably below 40%, as in similar cases of CPE. It is worth mentioning that the accuracy variance was closely and negatively associated with the spike amount, and the lower spike amount led to higher variance (Fig. 4C). A major contributor to such effects arose from the error associated with measurement of the background, i.e., endogenous compounds in the blank adipose samples and those introduced via adding the deconjugating enzymes from limpets, which needs to be subtracted in calculation.
3.4. Assessment of lipid removal efficiency following EMR cleanup
While the QuEChERS method allowed for easy removal of the majority of lipids from adipose tissues, a moderate amount of undesired lipids can still partition into the ACN layer. As analyzed by UPLC-Q-TOF/MS, the major lipids coextracted into the ACN layer included phospholipids conjugated with choline, ethanolamines and serines, sphingolipids, and di- and triacylglycerols. The lipid molecules were found to have acyl groups with 14 to 24 carbons and up to five double bonds (Fig. 5A and B). After EMR clean-up, the early eluted lipids (peaks 1-6) were significantly reduced, and the later eluted lipids (peaks 7-10) were no longer detectable. The lipids removal efficiency was ca. 66% calculated by comparing the total integrated peak area (1-10) before and after EMR clean-up. Meanwhile, the baseline intensity was also much decreased, showing the removal of a wide range of lipids as well as other matrical substances after EMR cleanup.
4. Conclusion
In the present work, a high-throughput sample preparation method employing micro QuEChERS and enhanced matrix removal (EMR)-lipid cleanup in 96-well plate was developed and validated for 26 phenolic compounds in mouse adipose tissues. In particular, sample cleanup using EMR sorbent successfully removed 66% of total lipids, and the application of reversed-phase C18 silica gel sorbent significantly reduced analyte loss during the SpeedVac drying and reconstitution procedures. The accuracy validated at four spike levels showed 80~120% accuracy for most analytes. Our results demonstrated that the newly developed method can be applied for efficient extraction and accurate quantitation of RK and related phenolic compounds in fatty tissues. The application of our method could be further expanded to other phenolic compounds with similar structures as the 26 analytes studied in this work.
One limitation of this work is the analyte loss during SpeedVac drying despite the protective effect from the use of reversed-phase C18 silica gel sorbent. Future research could involve a thorough investigation of the issue with analyte loss by comparing different drying apparatus and methods. In addition, for phase II metabolite deconjugation, the excessive enzymes used in this work, while allowing for efficient metabolites hydrolysis, introduced substantial background interference and resulted in significant measurement variability for trace analysis. As such, future work is needed to investigate ways to reduce such background interference.
Supplementary Material
Highlight.
Method developed to quantify raspberry ketone (RK) metabolites in adipose tissue.
Enhanced-matrix-removal in 96-well plate applied for efficient sample cleanup.
Reversed-phase C18 sorbent exploited for improved recovery from SpeedVac drying
Stepwise recovery monitoring technique developed for validation.
Acknowledgements
This work was supported by the NUT-NCCIH R01AT008933, the associated Administrative Supplement grant 3 R01 AT008933-03S1 and USDA-NIFA NJ06280. Additional funds were provided by the New Jersey Agriculture Experiment Station, Hatch Projects NJ12131 and NJ12170.
Footnotes
Publisher's Disclaimer: This is a PDF file of an unedited manuscript that has been accepted for publication. As a service to our customers we are providing this early version of the manuscript. The manuscript will undergo copyediting, typesetting, and review of the resulting proof before it is published in its final form. Please note that during the production process errors may be discovered which could affect the content, and all legal disclaimers that apply to the journal pertain.
Declaration of interests
The authors declare that they have no known competing financial interests or personal relationships that could have appeared to influence the work reported in this paper.
5 Reference
- 1.Anastassiades M, et al. , Fast and easy multiresidue method employing acetonitrile extraction/partitioning and “dispersive solid-phase extraction” for the determination of pesticide residues in produce. Journal of AOAC international, 2003. 86(2): p. 412–431. [PubMed] [Google Scholar]
- 2.Anastassiades M, Scherbaum E, and Bertsch D. Validation of a simple and rapid multiresidue method (QuEChERS) and its implementation in routine pesticide analysis, in MGPR Symposium: Aix en Provence, France. 2003. [Google Scholar]
- 3.Lehotay SJ, et al. , Determination of pesticide residues in foods by acetonitrile extraction and partitioning with magnesium sulfate: collaborative study. Journal of AOAC International, 2007. 90(2): p. 485–520. [PubMed] [Google Scholar]
- 4.CEN, Foods of plant origin-Determination of pesticide residues using GC-MS and/or LC-MS/MS following acetonitrile extraction/partitioning and clean -up by dispersive SPE. QuEChERS-method. EN, 2008. 15662: p. 2008. [Google Scholar]
- 5.Koesukwiwat U, et al. , Extension of the QuEChERS method for pesticide residues in cereals to flaxseeds, peanuts, and doughs. J Agric Food Chem, 2010. 58(10): p. 5950–8. [DOI] [PubMed] [Google Scholar]
- 6.Forsberg ND, Wilson GR, and Anderson KA, Determination of parent and substituted polycyclic aromatic hydrocarbons in high-fat salmon using a modified QuEChERS extraction, dispersive SPE and GC-MS. J Agric Food Chem, 2011. 59(15): p. 8108–16. [DOI] [PMC free article] [PubMed] [Google Scholar]
- 7.Sartarelli NC, et al. , Determination of Chlorfenvinphos, Fipronil, and Cypermethrin Residues in Meat and Bovine Fat Using Quechers Method and Gas Chromatography-Mass Spectrometry. Journal of Liquid Chromatography & Related Technologies, 2012. 35(13): p. 1895–1908. [Google Scholar]
- 8.Chamkasem N, et al. , Analysis of 136 pesticides in avocado using a modified QuEChERS method with LC-MS/MS and GC-MS/MS. Journal of agricultural and food chemistry, 2013. 61(10): p. 2315–2329. [DOI] [PubMed] [Google Scholar]
- 9.Chiu CW, Kao TH, and Chen BH, Improved Analytical Method for Determination of Cholesterol-Oxidation Products in Meat and Animal Fat by QuEChERS Coupled with Gas Chromatography-Mass Spectrometry. J Agric Food Chem, 2018. 66(13): p. 3561–3571. [DOI] [PubMed] [Google Scholar]
- 10.Hamed AM, et al. , Evaluation of a new modified QuEChERS method for the monitoring of carbamate residues in high-fat cheeses by using UHPLC-MS/MS. J Sep Sci, 2017. 40(2): p. 488–496. [DOI] [PubMed] [Google Scholar]
- 11.Kim L, et al. , Review of the QuEChERS method for the analysis of organic pollutants: Persistent organic pollutants, polycyclic aromatic hydrocarbons, and pharmaceuticals. Trends in Environmental Analytical Chemistry, 2019. 22. [Google Scholar]
- 12.Rejczak T and Tuzimski T, A review of recent developments and trends in the QuEChERS sample preparation approach. Open Chemistry, 2015. 13(1). [Google Scholar]
- 13.Cerqueira MB, Caldas SS, and Primel EG, New sorbent in the dispersive solid phase extraction step of quick, easy, cheap, effective, rugged, and safe for the extraction of organic contaminants in drinking water treatment sludge. J Chromatogr A, 2014. 1336: p. 10–22. [DOI] [PubMed] [Google Scholar]
- 14.Hou X, et al. , A multi-residue method for the determination of pesticides in tea using multi-walled carbon nanotubes as a dispersive solid phase extraction absorbent. Food Chem, 2014. 153: p. 121–9. [DOI] [PubMed] [Google Scholar]
- 15.Deng X, et al. , Rapid and effective sample clean-up based on magnetic multiwalled carbon nanotubes for the determination of pesticide residues in tea by gas chromatography-mass spectrometry. Food Chem, 2014. 145: p. 853–8. [DOI] [PubMed] [Google Scholar]
- 16.Guan W, et al. , Amine modified graphene as reversed-dispersive solid phase extraction materials combined with liquid chromatography-tandem mass spectrometry for pesticide multi-residue analysis in oil crops. J Chromatogr A, 2013. 1286: p. 1–8. [DOI] [PubMed] [Google Scholar]
- 17.Lucas D and Zhao L, PAH analysis in salmon with enhanced matrix removal. Agilent Technologies Application Note; 2015. Publication Part Number: 5991-6088EN. [Google Scholar]
- 18.Zhao L, et al. , Multi-class multi-residue analysis of veterinary drugs in meat using enhanced matrix removal lipid cleanup and liquid chromatography-tandem mass spectrometry. J Chromatogr A, 2018. 1549: p. 14–24. [DOI] [PubMed] [Google Scholar]
- 19.Lopez-Bianco R, et al. , Evaluation of different cleanup sorbents for multiresidue pesticide analysis in fatty vegetable matrices by liquid chromatography tandem mass spectrometry. J Chromatogr A, 2016. 1456: p. 89–104. [DOI] [PubMed] [Google Scholar]
- 20.Hakme E, et al. , High-throughput gas chromatography-mass spectrometry analysis of pesticide residues in spices by using the enhanced matrix removal-lipid and the sample dilution approach. J Chromatogr A, 2018. 1573: p. 28–41. [DOI] [PubMed] [Google Scholar]
- 21.Yuan B, et al. , A highly sensitive ultra-high performance liquid chromatography/tandem mass spectrometry method with in-source fragmentation for rapid quantification of raspberry ketone. J Food Drug Anal, 2019. 27(3): p. 778–785. [DOI] [PMC free article] [PubMed] [Google Scholar]
- 22.Morimoto C, et al. , Anti-obese action of raspberry ketone. Life Sci, 2005. 77(2): p. 194–204. [DOI] [PubMed] [Google Scholar]
- 23.Park KS, Raspberry ketone, a naturally occurring phenolic compound, inhibits adipogenic and lipogenic gene expression in 3T3-L1 adipocytes. Pharm Biol, 2015. 53(6): p. 870–5. [DOI] [PubMed] [Google Scholar]
- 24.Kshatriya D, et al. , Phenolic-enriched raspberry fruit extract (Rubus idaeus) resulted in lower weight gain, increased ambulatory activity, and elevated hepatic lipoprotein lipase and heme oxygenase-1 expression in male mice fed a high-fat diet. Nutr Res, 2019. 68: p. 19–33. [DOI] [PMC free article] [PubMed] [Google Scholar]
- 25.Zhao D, et al. , Influence of Diet-Induced Obesity on the Bioavailability and Metabolism of Raspberry Ketone (4-(4-Hydroxyphenyl)-2-Butanone) in Mice. Mol Nutr Food Res, 2020: p. e1900907. [DOI] [PMC free article] [PubMed] [Google Scholar]
- 26.Yuan B, et al. , UHPLC-QqQ-MS/MS method development and validation with statistical analysis: Determination of raspberry ketone metabolites in mice plasma and brain. J Chromatogr B Analyt Technol Biomed Life Sci, 2020. 1149: p. 122146. [DOI] [PMC free article] [PubMed] [Google Scholar]
- 27.Juck M and Zhao L, Protein Precipitation for Biological Fluid Samples Using Captiva EMR-Lipid 96-Well Plates. Agilent Technologies Application Note; 2018. Publication Part Number: 5991-9222EN. [Google Scholar]
- 28.Dankyi E, et al. , Application of the QuEChERS procedure and LC–MS/MS for the assessment of neonicotinoid insecticide residues in cocoa beans and shells. Journal of Food Composition and Analysis, 2015. 44: p. 149–157. [Google Scholar]
- 29.Valverde S, et al. , Fast determination of neonicotinoid insecticides in beeswax by ultra-high performance liquid chromatography-tandem mass spectrometry using an enhanced matrix removal-lipid sorbent for clean-up. Microchemical Journal, 2018. 142: p. 70–77. [Google Scholar]
- 30.Farè F, et al. , Determination of Methyldibromoglutaronitrile (MDBGN) in Skin Care Products by Gaschromatography-Mass Spectrometry Employing an Enhanced Matrix Removal (EMR) Lipid Clean-Up. European Journal of Lipid Science and Technology, 2018. 120(4). [Google Scholar]
- 31.Linghu Z, et al. , Determination of Heterocyclic Amines in Meat Matrices Using Enhanced Matrix Removal-Lipid Extraction and Liquid Chromatography-Tandem Mass Spectrometry. J Food Sci, 2019. 84(7): p. 1992–2002. [DOI] [PubMed] [Google Scholar]
- 32.Bernal J, et al. , Trace analysis of flubendiamide in bee pollen using enhanced matrix removal-lipid sorbent clean-up and liquid chromatography-electrospray ionization mass spectrometry. Microchemical Journal, 2019. 148: p. 541–547. [Google Scholar]
- 33.Slámová T, et al. , Application of QuEChERS-EMR-Lipid-DLLME method for the determination of polycyclic aromatic hydrocarbons in smoked food of animal origin. Journal of Food Composition and Analysis, 2020. 87. [Google Scholar]
Associated Data
This section collects any data citations, data availability statements, or supplementary materials included in this article.