

Abstract
During tumor growth—when nutrient and anabolic demands are high—autophagy supports tumor metabolism and growth through lysosomal organelle turnover and nutrient recycling. Ras‐driven tumors additionally invoke non‐autonomous autophagy in the microenvironment to support tumor growth, in part through transfer of amino acids. Here we uncover a third critical role of autophagy in mediating systemic organ wasting and nutrient mobilization for tumor growth using a well‐characterized malignant tumor model in Drosophila melanogaster. Micro‐computed X‐ray tomography and metabolic profiling reveal that RasV12; scrib −/− tumors grow 10‐fold in volume, while systemic organ wasting unfolds with progressive muscle atrophy, loss of body mass, ‐motility, ‐feeding, and eventually death. Tissue wasting is found to be mediated by autophagy and results in host mobilization of amino acids and sugars into circulation. Natural abundance Carbon 13 tracing demonstrates that tumor biomass is increasingly derived from host tissues as a nutrient source as wasting progresses. We conclude that host autophagy mediates organ wasting and nutrient mobilization that is utilized for tumor growth.
Keywords: autophagy, cancer cachexia, Drosophila, muscle, tumor, wasting
Subject Categories: Autophagy & Cell Death, Cancer, Metabolism
X‐ray tomography, metabolomics and carbon tracing reveal that autophagy‐mediated wasting of distal tissues provides amino acids and sugars that increase eye tumor biomass in Drosophila melanogaster.
Introduction
Macroautophagy (referred to as autophagy herein) encapsulates cytoplasm in a double membrane vesicle that is subsequently degraded upon fusion with the lysosome. Through autophagy, cytoplasmic cargo, including glycogen, protein aggregates, and organelles such as mitochondria, are broken down and reused for energy production or as macromolecular building blocks (Galluzzi et al, 2015). Physiologically, autophagy is necessary to survive starvation in both unicellular organisms and animal models. Genetic studies have revealed that autophagy is required to sustain circulating amino acid levels in autophagy‐deficient newborn mice (Kuma et al, 2004) and glucose during fasting in adult mice (Karsli‐Uzunbas et al, 2014). As autophagy is essential for cellular metabolism and control systemic nutrient levels, a focused effort has been on understanding the relevance for autophagy during carcinogenesis (Kimmelman & White, 2017; Poillet‐Perez & White, 2019). Indeed, during tumor growth, when nutrient and anabolic demands are high, findings in several genetically engineered mouse models have uncovered a tumor‐supportive role of autophagy (Poillet‐Perez & White, 2019). Autophagy deficiency in KrasG12D or BrafV600E lung cancer, or BrafV600E;PTEN−/− or KrasG12D, pancreatic cancer (PDAC) models decreased tumor progression (Guo et al, 2013; Rosenfeldt et al, 2013; Strohecker et al, 2013; Karsli‐Uzunbas et al, 2014; Yang et al, 2014; Xie et al, 2015). Metabolic analyses in RAS‐driven tumor cells and a KrasV12D; LKB1−/− lung cancer model showed that autophagy is required cell‐autonomously to provide substrates to the TCA cycle for maintaining nucleotide pools and prevent energy crisis (Bhatt et al, 2019). Thus, autophagy is required to sustain metabolic functions in tumor cells in order to promote tumor progression.
Autophagy is not however required to support tumor growth only from within the tumor cell itself. In flies and mice, Ras‐driven tumors additionally invoke non‐autonomous autophagy in cells of the microenvironment to support tumor growth, in part through transfer of amino acids from neighboring cells (Sousa et al, 2016; Katheder et al, 2017; Yang et al, 2018). In Drosophila, RasV12, scrib−/− tumors also induced a systemic autophagy stress response in muscle and adipose tissue, an observation akin to systemic effects in late‐stage cancer patients suffering from cancer cachexia metabolic syndrome (Katheder et al, 2017). Cancer cachexia is a tumor‐induced systemic cascade of events that leads to systemic inflammation, metabolic reprogramming, and organ degeneration, particularly of fat and skeletal and heart muscle whereas the liver increases in size (Baracos et al, 2018). Muscle samples from cancer patients suffering from cachexia (Tardif et al, 2013; Aversa et al, 2016) and cancer cachexia Xenograft models in mice (Penna et al, 2013) show increased levels of molecular markers of autophagy. This has led to the idea that organ wasting may be in part executed by increased turnover of intracellular material by simultaneous elevated proteasomal and autophagic activity (Penna et al, 2014). Genetic experiments for whether autophagy is rate‐limiting for organ wasting and how this may affect tumor growth in vivo remain limited. In a recent study, knockdown of the endocytosis and autophagy regulator BECN1 moderately reduced muscle wasting but not muscle morphological changes (Penna et al, 2019). Here we uncover that autophagy mediates systemic organ wasting and nutrient mobilization for tumor growth in a malignant tumor model in Drosophila melanogaster.
Results
Gradual organ atrophy and weight loss ensues during malignant tumor growth
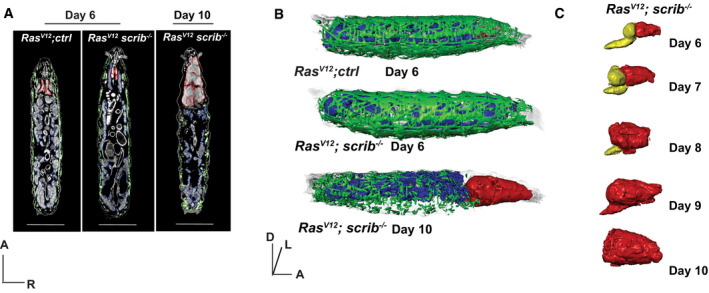
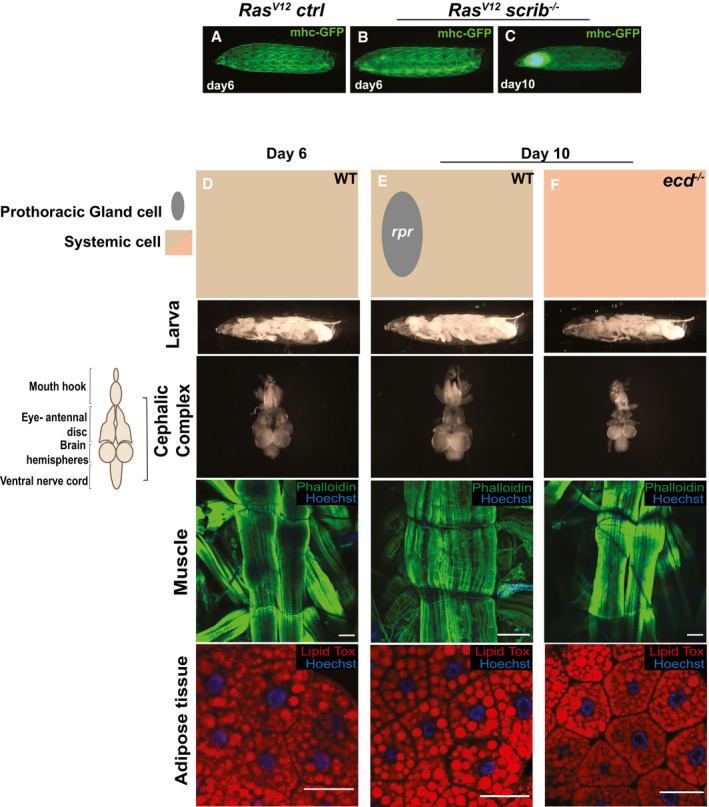
To assess the dynamics of organ atrophy at the whole‐animal level, we adopted computed tomography (CT), the gold standard for evaluating adipose and muscle atrophy in cancer patients. Genetically induced GFP‐labeled malignant RasV12; scrib −/− eye tumors grow and invade the neighboring central nervous system (CNS), extend the larval stage and kill the host by day 10–12 (Brumby & Richardson, 2003; Pagliarini & Xu, 2003). We optimized a fixation and staining protocol for high‐resolution micro‐CT (μ‐CT) imaging of developmentally staged larvae (Schoborg et al, 2019). This enabled ready identification, segmentation, and calculation of tumor and organ volumes (Fig 1A–C; Movie EV1–7) (Schoborg et al, 2019) RasV12; scrib −/− tumors grow 10‐fold in volume while invading and enveloping the brain from day 6 to 10 (Fig 1C, Movie EV7, quantified in 2A). Conversely, total larval muscle volume is initially similar to control animals carrying benign RasV12 tumors, and progressively shrink by approximately 50% from day 6 to day 10 (Fig 1B, quantified in 2B). The fat body, which perform adipose and liver functions, displayed a striking increase in translucency and lipid droplet size (Figs 2E and 3C) in Ras; scrib −/− tumor‐carrying animals from day 8 (Figueroa‐Clarevega & Bilder, 2015), although fat body volume remained unaltered (Fig 2D). Organ wasting and tumor growth were accompanied by approximately 35% dry weight loss and a progressive loss of motility and feeding from day 8 (Fig 2F–H). We established that muscle and fat body changes can be imaged and quantified in intact heat‐killed whole larvae using a myosin heavy chain‐GFP muscle reporter and backlight microscopy (Figs 3A–C and EV1A–C). RasV12; scrib −/− tumors inhibit ecdysone synthesis and offset the normal pupation at day 6 due to dilp8 secretion from tumor tissue (Colombani et al, 2012; Garelli et al, 2012). No muscle or adipose tissue atrophy was observed in day 10 animals where secretion of the molting hormone ecdysone was specifically obliterated in ecdysoneless (ecd1 −/−) mutants, or by genetic elimination of the ecdysone‐producing prothoracic gland cells (Fig EV1, EV2, EV3, EV4). Thus, the onset of muscle and adipose tissue wasting RasV12, scrib −/− larvae precede the reduction of feeding and reduced motility, arguing together that the wasting responses are not a simple function of reduced food intake or extended larval stage.
Figure 1. Tumor‐induced organ wasting.
-
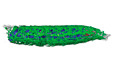
ARepresentative 2D μ‐CT scans of RasV12; ctrl at day 6, RasV12; scrib −/− larvae at day 6 and day 10. Muscle (green), fat body (blue) and eye‐antennal discs/tumor (red) are outlined. Scale bar: 1 mm. Anterior (A), Right (R).
-
BRepresentative 3D rendering of genotypes indicated in (A). Anterior (A), Dorsal (D), Left (L).
-
CRepresentative 3D rendering of RasV12; scrib −/− tumors (red) and central nervous system (yellow), over time.
Figure 2. Tumor‐induced organ wasting.
-
AQuantification of tumor growth of RasV12; ctrl day 6 (n = 15) RasV12; scrib −/− tumors, day 6 (n = 15), day 7 (n = 5), day 8 (n = 4), day 9 (n = 5), and day 10 (n = 5).
-
BQuantifications of muscle volume, of larvae carrying tumors of RasV12; ctrl (n = 15), and RasV12; scrib −/− at day 6(n = 15), day 7 (n = 5), day 8 (n = 5), day 9 (n = 5), and dat 10 (n = 5).
-
CQuantification of width of Dorsal Oblique 3 (DO3) muscle in larvae carrying tumors of RasV12; ctrl at day 6 (n = 29) and RasV12; scrib −/−at days 6 (n = 29) and day 10 (n = 31).
-
DQuantification of adipose tissue volume in larvae carrying tumors of RasV12; ctrl at day 6 and RasV12; scrib −/− at days 6 and day 10.
-
ERepresentative confocal images of adipose tissue in RasV12; ctrl and RasV12; scrib −/− tumors bearing animals at indicated ages. Lipid droplets are highlighted with Lipid Tox staining. Scale bar: 50 μm.
-
FQuantification of dry weight of RasV12; ctrl (n = 9), RasV12; scrib −/− day 6 (n = 15) and day 10 (n = 18) tumor‐bearing larvae excluding the tumor weight.
-
GQuantification of larval motility measure by crawling distance and crawling pattern in RasV12; ctrl (n = 14), RasV12; scrib −/− day 6 (n = 15), day 8 (n = 16), and day 10 (n = 14), each colored line represents a single larva.
-
HCoomassie feeding assay to asses food intake of RasV12; scrib −/− over time, three repeated measurements of an average food intake of 20 larvae.
Data information: Values depict mean ± s.e.m. of minimum three independent pooled experiments. ns, not significant, *P ≤ 0.05, **P ≤ 0.01, ***P ≤ 0.0001 and ****P < 0.0001, from unpaired, two‐tailed test.
Source data are available online for this figure.
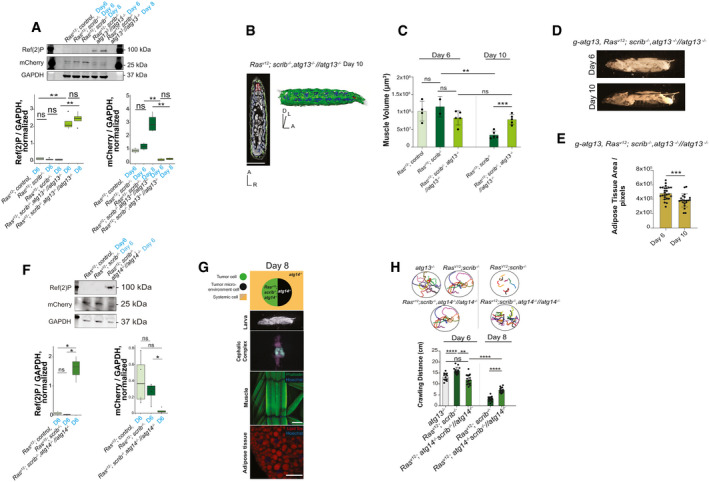
Figure 3. Autophagy is required for systemic wasting.
-
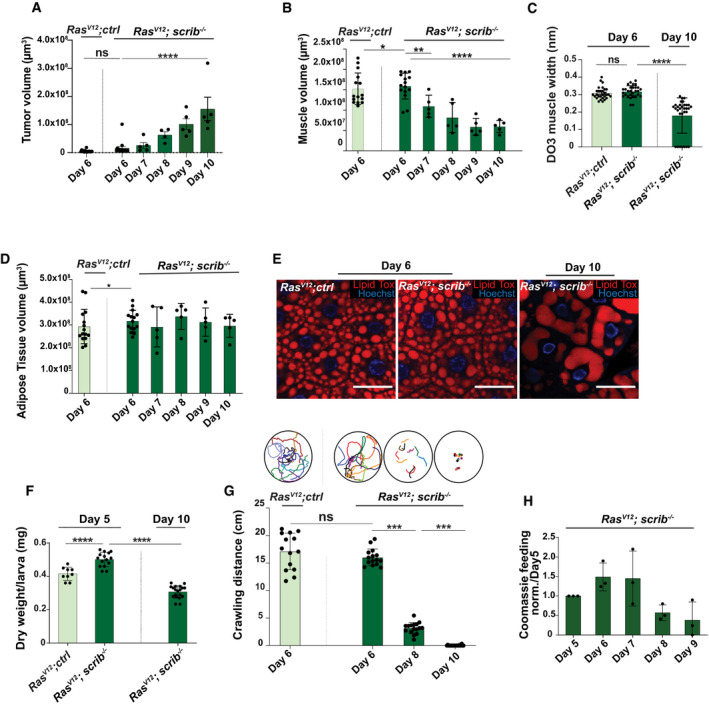
A–ECartoon (top) illustrates the genotypes of the larvae, eye‐antennal disc (EAD, circle: tumor cells in green and microenvironment cell in black), systemic cells are illustrated as a square (wild‐type cells in light brown and atg13‐mutant cells in light orange) at indicated ages. Cartoon (left) illustrates the structure of cephalic complex attached to mouth hook. Representative images of Larva (image of larva using the backlight of microscope), cephalic complex (green highlights the GFP‐labeled tumor clones), muscle (Phalloidin in green stains actin and Hoechst in blue stains nucleus), and adipose tissue (Lipid Tox in red stains for lipid droplets, Hoechst stains nucleus) from top to bottom. (A) RasV12; ctrl tumor‐bearing animal at day 6. (B) RasV12; scrib −/− tumor‐bearing animal at day 6. (C) RasV12; scrib −/− tumor‐bearing animal at day 8. (D) RasV12, scrib −/− , atg13 −/− //atg13 −/− at day 8. (E) ey3.5‐atg13; RasV12; scrib −/−, atg13 −/− //atg13 −/− animal complemented with eye‐specific transgenic atg13 expression, rescuing the tumor growth, at day 8.
-
FQuantification of area of space occupied with lobes of fat body within larval segments 4 to 8 (shown in yellow dashed line in 2A), of animals bearing tumors at day 6 RasV12; ctrl (n = 45), RasV12; scrib −/− (n = 30), RasV12, scrib −/− , atg13 −/− //atg13 −/− (n = 30) and ey3.5‐atg13; RasV12, scrib −/− , atg13 −/− //atg13 −/− (n = 29) and at day 10 RasV12; scrib −/− (n = 40), RasV12, scrib −/− , atg13 −/− //atg13 −/− (n = 25) and ey3.5‐atg13; RasV12, scrib −/− , atg13 −/− //atg13 −/− (n = 28).
-
GQuantification of tumor volumes day 6 RasV12; ctrl (n = 7), RasV12; scrib −/− (n = 11) and day 8 RasV12; scrib −/− (n = 13), RasV12, scrib −/− , atg13 −/− //atg13 −/− (n = 9) and ey3.5‐atg13; RasV12, scrib −/− , atg13 −/− //atg13 −/− (n = 9).
-
HQuantification of Ventral Longitudinal muscle 4 (VL4) (shown in yellow dashed line in 2A) of third segment of larvae carrying at day 6 RasV12; ctrl (n = 15), RasV12; scrib −/− (n = 14), and at day8 RasV12; scrib −/− (n = 11), RasV12, scrib −/− , atg13 −/− //atg13 −/− (n = 12) and ey3.5‐atg13; RasV12; scrib −/− , atg13 −/− //atg13 −/− (n = 14).
-
IQuantification of dry weight excluding tumor of RasV12; scrib −/− , atg13 −/− //atg13 −/−at day 6 (n = 8) and day 10 (n = 7).
-
JQuantification of larval motility measured by crawling distance and crawling pattern for RasV12; scrib −/− , atg13 −/− //atg13 −/− at day 6 (n = 15) and at day 8 (n = 15), each colored line represents a single larva.
Data information: Values depict mean±s.e.m. of minimum three independent pooled experiments. ns, not significant, *P ≤ 0.05, **P ≤ 0.01, ***P ≤ 0.0001 and ****P < 0.0001, from unpaired, two‐tailed test. Scale bar: muscles 100 μm and adipose tissue 50 μm.
Source data are available online for this figure.
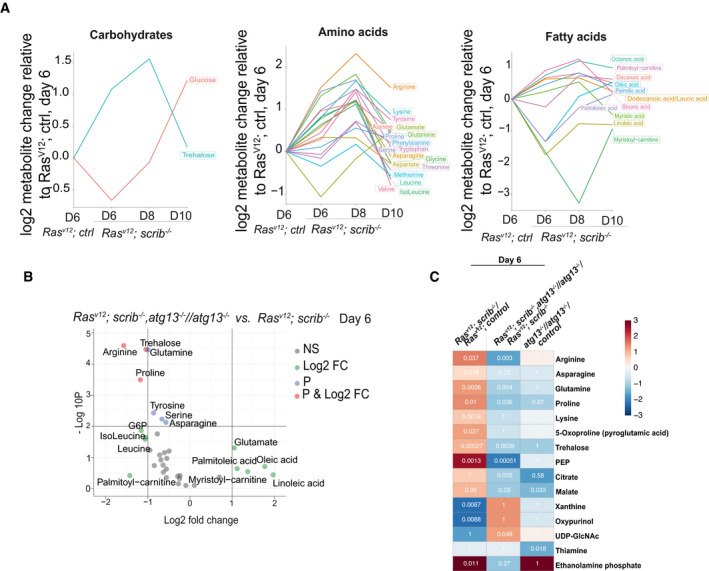
Figure 4. Autophagy‐driven wasting releases metabolites into circulation.
-
AChanges in groups (carbohydrates, amino acids, and fatty acids) of storage metabolites measured in circulating hemolymph with progressing wasting, shown as log2 changes measured by LC‐MS and calculated per larvae relative to RasV12; ctrl at day 6.
-
BVolcano plot showing autophagy‐dependent changes to amounts of circulating metabolites at day 6. X‐axis shows the log2 of fold change of RasV12; atg13 −/− scrib −/− // atg13 −/− vs. RasV12; scrib −/−, y‐axis shows −log10 P‐value, calculated by t‐test. Metabolite names are shown for metabolites with log2 (FC) >± 1 and/or –log10(P) < 2. Green points indicate log2 (FC) >± 1, blue indicates −log10(P) < 2, and red indicates for above both thresholds.
-
CAutophagy‐driven wasting releases metabolites into circulation of 113 reliably detected metabolites, those showing significant differences in any of the three comparisons are shown. Color indicates the log2 (fold change) difference and the numbers show the P‐value of the comparison. The statistical test to define significance was FDR‐adjusted t‐test P‐value < 0.05.
Figure EV1. Tumor‐induced organ wasting.
-
A–CRepresentative images of larvae with GFP‐labeled muscles at day 6 and 10.
-
D–FCartoon (top) illustrates the genotypes of the larvae, prothoracic gland (gray oval), systemic cells are illustrated as a square (wild‐type cells in light brown and ecdysone mutant cells in light red) at day 6 and day 10. Cartoon (left) illustrates the structure of cephalic complex attached to mouth hook. Larva (image of larva using the backlight of microscope), cephalic complex (no tumors), muscle (Phalloidin in green stains actin and Hoechst in blue stains muscle nuclei), and adipose tissue (Lipid Tox in red stains for lipid droplets, Hoechst stains cell nuclei) from top to bottom. (D) Wild type larva (w1118) control, (E) spok‐Gal4,UAS‐Dcr2.D;UAS‐rpr larva that linger due to lack of cells expressing ecdysone hormone and (F) ecd1ts (ecdysoneless), larva that lingers due to ecdysone deficiency. Scale bar: muscle, 100 μm and adipose tissue, 50 μm.
Figure EV2. Autophagy is required for systemic wasting.
-
AWestern blot analysis and quantification of Cherry‐Atg8a processing and Ref(2)P accumulation in larval body wall muscles, representative of four independent experiments. Quantifications are normalized to the mean of signals for a given band in each independent experiment. Boxplot used with default settings for geom_boxplot in R; line shows the median, boxes extending 25th percentile to 75th percentile and whiskers 1.5× of inter‐quartile range.
-
BRepresentative 2D μ‐CT scan and representative 3D rendering of RasV12 ; scrib −/−, atg13 −/− //atg13 −/−larva at day 10. Muscle (green), fat body (blue), and eye‐antennal discs/tumor (red), Anterior (A), Dorsal (D), Left (L), Right (R). Scale bar: 1 mm.
-
CQuantifications of muscle volumes larvae carrying at day 6 RasV12 ; ctrl (n = 4), RasV12 ; scrib −/− (n = 2), RasV12 ; scrib −/−, atg13 −/− //atg13 −/− (n = 5) and at day 10 RasV12 ; scrib −/− (n = 5), RasV12 ; scrib −/−, atg13 −/− //atg13 −/− (n = 5).
-
DRepresentative images of whole larva at days 6 and 10 of g‐atg13, RasV12; scrib −/− , atg13 −/− //atg13 −/−.
-
EQuantification of space within segments 4–8 occupied by white adipose tissue in a whole/intact larva, shown in pixels. g‐atg13, RasV12; scrib −/− , atg13 −/− //atg13 −/−, at day 6 (n = 25) and at day 10 (n = 21).
-
FWestern blot analysis and quantification of Cherry‐Atg8a processing and Ref(2)P accumulation in larval carcass, representative of four independent experiments. Quantifications are normalized to the mean of signals for a given band in each independent experiment. Boxplot used with default settings for geom_boxplot in R; line shows the median, boxes extending 25th percentile to 75th percentile and whiskers 1.5× of inter‐quartile range.
-
GCartoon (top) illustrates the genotypes of the larva, eye‐antennal disc (EAD, circle: tumor cells in green and microenvironment cell in black), systemic cells are illustrated as a square. Representative images of RasV12; scrib −/− , atg14 −/− //atg14 −/−larva (image of larva using the backlight of microscope), cephalic complex (green highlights the GFP‐labeled tumor clones), muscle (Phalloidin in green stains actin and Hoechst in blue stains nucleus), and adipose tissue (Lipid Tox in red stains for lipid droplets, Hoechst stains nucleus) from top to bottom. Scale bar: muscles 100 μm and adipose tissue 50 μm.
-
HQuantification of larval motility measured by crawling distance and crawling pattern for atg13 −/− larvae (n = 12), RasV12; scrib −/− (same data that shown in Fig 2). RasV12; scrib −/− , atg14 −/− //atg14 −/− at day 6 (n = 15) and at day 8 (n = 16), each colored line represents a single larva.
Data information: Values depict mean ± s.e.m. of minimum three independent pooled experiments (except for panel C, RasV12; scrib −/− at day 6) ns, not significant, *P ≤ 0.05, **P ≤ 0.01, ***P ≤ 0.0001 and ****P < 0.0001 or as indicated in the figure, from unpaired, two‐tailed test. Source data are available online for this figure.
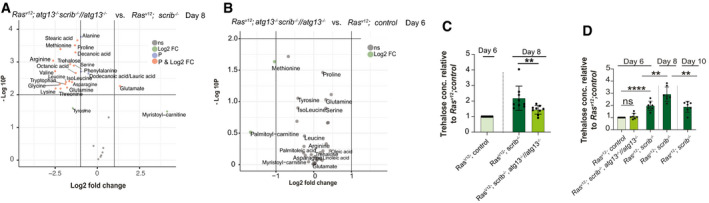
Figure EV3. Autophagy‐driven wasting releases metabolites into circulation.
-
AVolcano plot showing autophagy‐dependent changes to amounts of circulating metabolites in wasting larvae at day 8. X‐axis shows the log2 of fold change of RasV12; scrib −/− , atg13 −/− //atg13 −/− vs. RasV12; scrib −/−, y‐axis shows −log10 P‐value, calculated by t‐test. Metabolite names are shown for metabolites with log2(FC) >± 1 and/or −log10(P) < 2. Green points indicate log2(FC) >± 1, blue indicate −log10(P) < 2, and red indicates for above both thresholds.
-
BVolcano plot showing the amounts of circulating metabolites in RasV12; scrib −/− , atg13 −/− //atg13 −/− vs. RasV12; ctrl at day 6.
-
CThe amount of trehalose measured by biochemical assay in whole larvae (n = 9) in RasV12; scrib −/− and RasV12; scrib −/− , atg13 −/− //atg13 −/− at day 8, normalized to RasV12; ctrl at day 6, and per number of larvae.
-
DThe amount of trehalose measured by biochemical assay of the whole larvae (n = 7), in RasV12; scrib −/− , atg13 −/− //atg13 −/− at day 6 and RasV12; scrib −/− at days 6, 8, and 10 normalized to RasV12; ctrl at day 6, and per number of larvae.
Data information: Values depict mean ± s.e.m. of minimum three independent pooled experiments; ns, not significant, **P ≤ 0.01 and ****P < 0.0001, from unpaired, two‐tailed test.
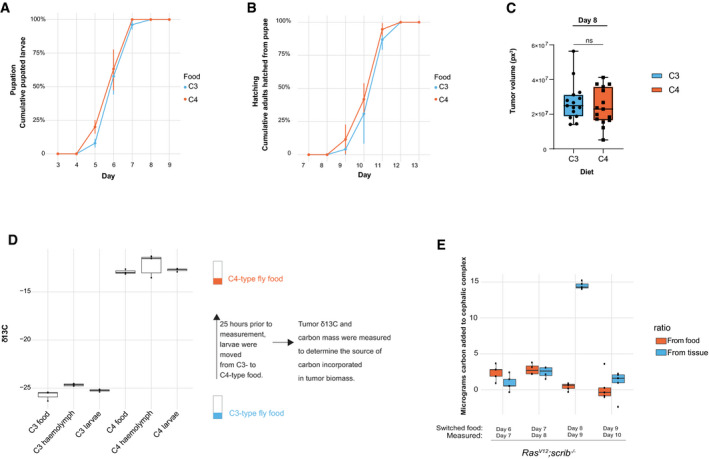
Figure EV4. Tumor incorporation of carbon isotopes.
-
A–C(A, B) Animals raised on C3 (n = 74) or C4 (n = 85) type food were scored for cumulative pupation and hatching rate and (C) Day 8 tumor volume of rasV12; scrib −/− larvae (C3: n = 15, C4; n = 15). Boxes extending 25th percentile to 75th percentile and whiskers represents total range, band equals median. ns, not significant, from unpaired, two‐tailed test.
-
Dδ13C (representing 13C/12C) measurements of two different food types, either with C3‐ or C4‐type plant‐derived nutrients. Measurements of whole larvae or hemolymph growing on these food types for are also shown along with a brief description of the methodology to determine the source of carbon used for tumor growth. Two measurements are shown for all samples. Boxplot used with default settings for geom_boxplot in R; line shows the median, boxes extending 25th percentile to 75th percentile and whiskers 1.5× of inter‐quartile range.
-
ECarbon incorporated into the cephalic complex biomass from food or host tissues were determined by moving rasV12; scrib −/− larvae at indicated stages tumor development from C3‐ to C4‐type food and then measuring the carbon composition as well as carbon mass 25 h later. Each time point measurement has four biological replicates. Box plot used with default settings for geom_boxplot in R; line shows the median, boxes extending 25th percentile to 75th percentile and whiskers 1.5× of inter‐quartile range.
Systemic autophagy mediates organ wasting
Earlier work showed that larvae carrying RasV12; scrib −/− malignant tumors, but not RasV12 benign tumors display a systemic autophagy stress response in muscle, gut, and fat body (Katheder et al, 2017). To validate these finding, we assessed autophagic activity using the autophagy flux reporter mCherry‐Atg8a. Increased lysosomal processing of mCherry‐Atg8a was observed in host tissues of larvae carrying RasV12; scrib −/− tumors from day 6 to 8 (Fig EV2A) indicating an escalation in systemic tissue autophagy in this model as tumor growth proceeds. Muscle samples from cancer patients suffering from cachexia (Tardif et al, 2013; Aversa et al, 2016) and cancer cachexia models in mouse (Penna et al, 2013) show increased levels of molecular markers of autophagy. This has led to the idea that increased intracellular protein turnover by elevated proteasomal and autophagic activity in part contribute to organ wasting in cancer cachexia (Penna et al, 2014). Knockdown of the endocytosis and autophagy regulator BECN1, moderately reduced muscle wasting but not muscle morphological changes in a mouse cachexia model while autophagy stimulation augmented wasting (Penna et al, 2019). We therefore asked whether autophagy is involved in organ wasting. The autophagy initiation complex Atg13/Atg1/FIP200 and Atg14‐containing PIK3‐C3 lipid kinase complex (Atg14/Vps15/Vps34/Atg6 (Beclin1)), act sequentially during autophagy initiation. As expected, fully mutant atg13 animals carrying RasV12, scrib −/− tumors, did not display autophagy flux and instead accumulated the autophagy cargo protein Ref (2)P/p62 (Fig EV2A). Strikingly, RasV12; scrib −/− , atg13 −/− //atg13 −/− animals displayed a complete reversal of muscle atrophy, weight and motility loss, as well as fat body alterations (Fig 3A–D, F–J, and EV2B and C, Movies EV8 and EV9). Genomic rescue of atg13 (g‐atg13) in RasV12; scrib −/− , atg13 −/− //atg13 −/− animals reinstated organ wasting, showing that the failure of organ wasting was indeed due to atg13 loss (Fig EV2D and E). RasV12; scrib −/− , atg14 −/− //atg14 −/− animals also blocked organ wasting and loss of motility, demonstrating that failure of organ wasting is not limited to the autophagy initiation complex (Fig EV2, EV3, EV4). Importantly, as RasV12; scrib −/− , atg13 −/− //atg13 −/− also show reduced tumor growth, we rescued tumor growth by local atg13 expression in the tumor and microenvironment of the eye‐antennal disc only. This led to rescue of tumor growth to 60% as previously reported, but failed to cause systemic atrophy (Fig 3E, F–H). Thus, systemic autophagy drives organ wasting and tumor growth is dependent upon local and systemic autophagy.
Autophagy mediates nutrient mobilization
Autophagy mediates nutrient recycling upon starvation at the cell level through lysosomal turnover and recycling of lipids, sugars, amino acids, and nucleotides that may further be secreted into circulation (Kuma et al, 2004; Karsli‐Uzunbas et al, 2014; Kimmelman & White, 2017). We therefore investigated whether autophagy can mediate systemic nutrient release in this model. The levels of metabolites in the cell‐free hemolymph (serum) were measured using LC/MS analysis.
Serum levels of amino acids, most prominently, arginine, proline, glutamine, serine, alanine, lysine as well as the insect serum sugar, trehalose, increased in animals with RasV12; scrib −/− tumors relative to age‐matched controls (Fig 4A). This was apparent already at day 6, before onset of significant and exponential tumor growth and reduced feeding. Conversely, glutamate and methionine were lower (Fig 4A). By day 8, serum amino acid and trehalose levels increased further, including glutamate and methionine before tapering off at day 10 while glucose peaked (Fig 4A). Thus, serum nutrient levels increase during organ atrophy suggesting that autophagy may mediate nutrient release into circulation. To test this, we compared RasV12; scrib −/− tumor‐carrying animals with and without autophagy. Trehalose, arginine, glutamine, and proline showed significant higher levels in autophagy‐competent RasV12; scrib −/− animals versus atg13‐mutant RasV12; scrib −/− tumor‐carrying animals at day 6 (Fig 4B) and this was followed by the majority of amino acids except tyrosine, phenylalanine, and alanine at day 8 (Fig EV3A). This supports the hypothesis that autophagy is required for increased serum nutrient levels in tumor‐ridden animals. Indeed, we could not detect significant differences in serum nutrient levels between RasV12; scrib −/− , atg13 −/− //atg13 −/− and RasV12 control animals at day 6 (Fig EV3B). In order to infer which metabolites are changed early on during organ wasting in an autophagy‐dependent manner, we performed three pairwise comparisons at day 6. Metabolites that increased significantly (FDR < 0.05) upon wasting (i) RasV12;scrib−/− vs. RasV12, reversed when autophagy was inhibited (ii) RasV12;scrib−/− Atg13−/− vs. RasV12;scrib−/− and not altered in autophagy mutants alone (iii) Ctrl Atg13−/− vs. Ctrl. This set of criteria identified arginine, asparagine, glutamine, proline, lysine, and trehalose to respond early and strong at the onset of organ wasting and fat body alterations (Fig 4C).
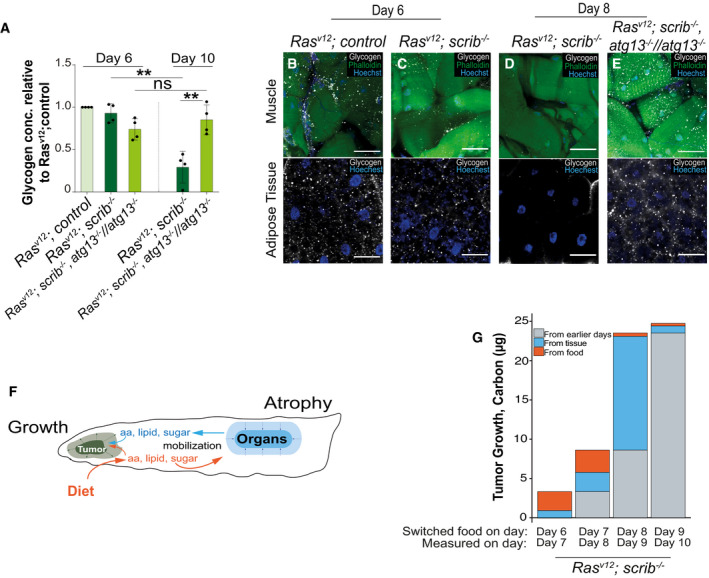
In flies, autophagy cooperates with enzymatic breakdown of muscle glycogen via glycogen phosphorylase in response to starvation, raising the possibility that autophagy may contribute to glycogen breakdown and serum sugar mobilization (Zirin et al, 2013). Visualizing glycogen by immunofluorescence staining in muscle and fat body, or biochemically measuring total tissue sugar showed that glycogen stores are depleted in day 8 RasV12, scrib −/− animals relative to day 6 while serum trehalose levels rise (Figs 4C and 5A–E). Both glycogen stores and trehalose levels normalized in RasV12; scrib −/− , atg13 −/− //atg13 −/− animals (Figs 5A–E and EV3C). Taken together, this provides in vivo evidence that autophagy mediates somatic organ wasting and mobilization of nutrients in the form of sugars and amino acids and that mobilization initiates before reduced feeding and onset of exponential tumor growth.
Figure 5. Host‐derived nutrients contribute to tumor biomass.
-
AThe amount of glycogen in the whole larvae measured by biochemical assay (n = 4), normalized to RasV12; ctrl at day 6, and per number of larvae.
-
B–ERepresentative confocal images of muscle and adipose tissue of larvae carrying RasV12; ctrl, RasV12; scrib −/− and RasV12; scrib −/− , atg13 −/− //atg13 −/− showing glycogen levels (white) at day 6 and day 8.
-
FCartoon illustrating tumor growth (green) incorporation of molecules derived from food (in orange) or from host tissues (in blue).
-
GSources of carbon incorporated into tumor biomass were differentiated by changing the isotopic carbon content of the food source 25 h before measuring the total carbon content and isotopic ratio of the tumor. A similar, but independent experiment is reported in Holland et al (2021).
Data information: Values depict mean ± s.e.m. of minimum three independent pooled experiments. ns, not significant, **P ≤ 0.01, from unpaired, two‐tailed test. Scale bar: muscles 100 μm and adipose tissue 50 μm.
Source data are available online for this figure.
Host‐derived nutrients constitute the main source of tumor biomass
These findings raised the tantalizing possibility that autophagy mediates nutrient release from host tissues that may further be utilized by the tumor for growth. To test this hypothesis, we sought to differentiate whether biomass of the growing tumor was derived from ingested food or nutrients released from host organ stores. As both sugars and amino acids were mobilized as a group, we chose to follow transfer of carbon using natural abundance stable isotope ratio mass spectrometry (SIRMS) using a recently developed protocol (Holland et al, 2021). We generated two types of fly food containing different 13C/12C ratios derived from plants with differences in 13C vs. 12C incorporation from CO2 during photosynthesis. C4–type carbon fixation (e.g., corn, sugar cane) incorporates relatively more 13C‐containing CO2 than does C3‐type plants (e.g., potato, sugar beet) (Jahren et al, 2006; Chartrand & Mester, 2019; Holland et al, 2021). Larvae raised on C4‐based vs. C3‐based food revealed segregated 13C/12C tissue and hemolymph values in keeping with the isotopic composition of the food they were raised on (Fig EV4A). Larvae raised on either food demonstrated similar pupation and hatching rates as well as tumor size. Thus, the two natural food formulations are equally able to support organismal and tumor growth.
To measure incorporation of carbon from food or internal stores into the growing tumor, we switched the food source 25 h before measuring the isotopic carbon ratio as well as total carbon mass of the cephalic complex. The measured change in mass and carbon composition during those 25 h then reveal the relative amount of carbon that has been added to the tumor from ingested food or host organs. We find that early tumor growth sources a majority of biomass carbon from the food, but that carbons are increasingly incorporated from the host tissues as tumor growth progresses (Figs 5F and G, and EV4B).
Discussion
Earlier studies in adult flies have demonstrated ovary atrophy in adult flies carrying allografted RasV12; scrib −/− or RasV12; dlg −/− tumors derived from the larval eye disc or in animals with adult stem cell tumors in the gut driven by defective Hippo‐Warts signaling(Figueroa‐Clarevega & Bilder, 2015). Ovary atrophy is mediated by IMPL2, an insulin‐binding peptide produced by the tumor. Muscles showed altered mitochondrial morphology, but muscle wasting was not reported in either model. Detailed μ‐CT and volumetric calculations presented here demonstrate that muscle wasting occurs in response to RasV12; scrib −/−, but that the fat body volume is retained with increased signs of steatosis. Muscle wasting was also reported to be induced by fibroblast growth factor secretion in a RasV12, Csk‐IR larval model while this paper was being revised (Newton et al, 2020). In both models, a concomitant increase in amino acid serum levels is observed raising the question of what is the mechanism for nutrient mobilization.
Autophagy captures intracellular material and delivers it to the lysosome for degradation and recycling of amino acids, sugars, fatty acids, and nucleotides to sustain metabolism and enable survival during starvation in mice and flies (Poillet‐Perez & White, 2019). It is well established that autophagy is required in tumor cells to uphold tumor cell metabolism and mitochondrial functionality cell intrinsically. More recently, non‐autonomous effects of autophagy in cancer progression have been revealed. In mouse and Drosophila, Ras‐driven tumors stimulate neighboring cells of the microenvironment to activate autophagy to support tumor growth (Sousa et al, 2016; Katheder et al, 2017). Pancreatic stellate cells secrete asparagine and alanine in response to tumor cells and alanine taken up by the tumor was shown to functionally support tumor growth by entering central TCA metabolism (Sousa et al, 2016). Beyond the microenvironment, systemic depletion of autophagy leads to strong decline in serum arginine due to the release of arginase from the liver that in turn restricts growth of arginine‐auxotrophic tumors (Poillet‐Perez et al, 2018). Whether autophagy may have a broader effect on physiology and tumor growth when cancer leads to systemic organ wasting is so far unknown.
The results herein suggest a model where autophagy supports tumor growth from peripheral tissues in a fly model (Katheder et al, 2017). As autophagy mediates massive nutrient release, we favor a model in which autophagy supports tumor growth by bulk nutritional provisioning through amino acid and sugar mobilization. This is supported by measurements showing that biomass increase is mainly derived from host carbon sources in this model.
We cannot rule out other autophagy‐mediated mechanisms that may also support growth and that the tumor is opportunistically incorporating the released molecules.
The similarities between human cancer cachexia processes and the findings presented herein, lends credence to the concept that autophagy contributes to organ wasting (Penna et al, 2014). It also may underlie the increased mobilization of branched chain amino acids from host observed in mouse pancreatic cancer models and patients (Mayers et al, 2014).
Materials and Methods
Reagents and Tools table
| Detailed genotypes |
|---|
| Figure 1 . |
| 1a‐c: y,w,ey‐FLP/y,w;UAS‐RasV12/act>y+>GAL4, UAS‐GFP; Frt82B/Frt82B, tub‐GAL80 |
| y,w,ey‐FLP/y,w;UAS‐RasV12/act>y+>GAL4, UAS‐GFP; Frt82B, scrib1/Frt82B, tub‐GAL80 |
| Figure 2 . |
| 1a‐h: y,w,ey‐FLP/y,w;UAS‐RasV12/act>y+>GAL4, UAS‐GFP; Frt82B/Frt82B, tub‐GAL80 |
| y,w,ey‐FLP/y,w;UAS‐RasV12/act>y+>GAL4, UAS‐GFP; Frt82B, scrib1/Frt82B, tub‐GAL80 |
| Figure 3 . |
| 3a: y,w,ey‐FLP/y,w;UAS‐RasV12/act>y+>GAL4, UAS‐GFP; Frt82B/Frt82B, tub‐GAL80 |
| 3b,c: y,w,ey‐FLP/y,w;UAS‐RasV12/act>y+>GAL4, UAS‐GFP; Frt82B, scrib1/Frt82B, tub‐ GAL80 |
| 3d: y,w,ey‐FLP/y,w;UAS‐RasV12/act>y+>GAL4, UAS‐GFP; Frt82B, atg13Δ81scrib1/Frt82B, tub‐GAL80, atg13Δ81 |
| 3e: y,w,ey‐FLP/ ey3.5‐Hsp70‐DmAtg13‐GFP;UAS‐RasV12/ act>y+>GAL4, UAS‐GFP; Frt82B, atg13Δ81scrib1/Frt82B, tub‐GAL80, atg13Δ81 |
| 3f,g,h: y,w,ey‐FLP/y,w;UAS‐RasV12/act>y+>GAL4, UAS‐GFP; Frt82B/Frt82B, tub‐GAL80 |
| y,w,ey‐FLP/y,w;UAS‐RasV12/act>y+>GAL4, UAS‐GFP; Frt82B, scrib1/Frt82B, tub‐ GAL80 |
| y,w,ey‐FLP/y,w;UAS‐RasV12/act>y+>GAL4, UAS‐GFP; Frt82B, atg13Δ81scrib1/Frt82B, tub‐GAL80, atg13Δ81 |
| y,w,ey‐FLP/ ey3.5‐Hsp70‐DmAtg13‐GFP;UAS‐RasV12/act>y+>GAL4, UAS‐GFP; Frt82B, atg13Δ81scrib1/Frt82B, tub‐GAL80, atg13Δ81 |
| 3i,j: y,w,ey‐FLP/y,w;UAS‐RasV12/act>y+>GAL4, UAS‐GFP; Frt82B, atg13Δ81scrib1/Frt82B, tub‐GAL80, atg13Δ81 |
| Figure 4 . |
| 4a: y,w,ey‐FLP/y,w;UAS‐RasV12/act>y+>GAL4, UAS‐GFP; Frt82B/Frt82B, tub‐GAL80 |
| y,w,ey‐FLP/y,w;UAS‐RasV12/ act>y+>GAL4, UAS‐GFP; Frt82B, scrib1/Frt82B, tub‐GAL80 |
| 4b: y,w,ey‐FLP/y,w;UAS‐RasV12/ act>y+>GAL4, UAS‐GFP; Frt82B, scrib1/Frt82B, tub‐GAL80 |
| y,w,ey‐FLP/y,w;UAS‐RasV12/act>y+>GAL4, UAS‐GFP; Frt82B, atg13Δ81scrib1/Frt82B, tub‐GAL80, atg13Δ81 |
| 4c: y,w,ey‐FLP/y,w;UAS‐RasV12/act>y+>GAL4, UAS‐GFP; Frt82B/Frt82B, tub‐GAL80 |
| y,w,ey‐FLP/y,w;UAS‐RasV12/ act>y+>GAL4, UAS‐GFP; Frt82B, scrib1/Frt82B, tub‐GAL80 |
| y,w,ey‐FLP/y,w;UAS‐RasV12/act>y+>GAL4, UAS‐GFP; Frt82B, atg13Δ81scrib1/Frt82B, tub‐GAL80, atg13Δ81 |
| hsflp;; Frt82B, atg13Δ81/ Frt82B, atg13Δ81 |
| hsflp;; Frt82B / Frt82B |
| Figure 5 . |
| 5a: y,w,ey‐FLP/y,w;UAS‐RasV12/act>y+>GAL4, UAS‐GFP; Frt82B/Frt82B, tub‐GAL80 |
| y,w,ey‐FLP/y,w;UAS‐RasV12/ act>y+>GAL4, UAS‐GFP; Frt82B, scrib1/Frt82B, tub‐GAL80 |
| y,w,ey‐FLP/y,w;UAS‐RasV12/act>y+>GAL4, UAS‐GFP; Frt82B, atg13Δ81scrib1/Frt82B, tub‐GAL80, atg13Δ81 |
| 5b: y,w,ey‐FLP/y,w;UAS‐RasV12/act>y+>GAL4, UAS‐GFP; Frt82B/Frt82B, tub‐GAL80 |
| 5c,d: y,w,ey‐FLP/y,w;UAS‐RasV12/ act>y+>GAL4, UAS‐GFP; Frt82B, scrib1/Frt82B, tub‐GAL80 |
| 5e: y,w,ey‐FLP/y,w;UAS‐RasV12/act>y+>GAL4, UAS‐GFP; Frt82B, atg13Δ81scrib1/Frt82B, tub‐GAL80, atg13Δ81 |
| 5g: y,w,ey‐FLP/y,w;UAS‐RasV12/ act>y+>GAL4, UAS‐GFP; Frt82B, scrib1/Frt82B, tub‐GAL80 |
| Figure EV1 . |
| EVF 1a: y,w,ey‐FLP/y,w;UAS‐RasV12 / act>y+ >GAL4, UAS‐GFP; Frt82B /Frt82B, tub‐GAL80 |
| EVF 1b,c: y,w,ey‐FLP/y,w;UAS‐RasV12 / act>y+ >GAL4, UAS‐GFP; Frt82B, scrib1 /Frt82B, tub‐GAL80 |
| EVF 1d: w1118 |
| EVF 1e: w1118/w*, spok‐Gal4, UAS‐Dcr‐2.D; UAS‐rpr |
| EVF 1f:;;ecd1, st1, ca1/ecd1, st1, ca1 (Bloomington 218) |
| Figure EV2 . |
| EVF 2a: y,w,ey‐FLP/y,w;UAS‐RasV12, pmCh‐atg8a/act>y+>GAL4, UAS‐GFP; Frt82B/Frt82B, tub‐GAL80 |
| y,w,ey‐FLP/y,w;UAS‐RasV12, pmCh‐atg8a/act>y+>GAL4, UAS‐GFP; Frt82B, scrib1/Frt82B, tub‐ GAL80 |
| y,w,ey‐FLP/y,w;UAS‐RasV12, pmCh‐atg8a/act>y+>GAL4, UAS‐GFP; Frt82B, atg13Δ81scrib1/Frt82B, tub‐GAL80, atg13Δ81 |
| EVF 2b: y,w,ey‐FLP/y,w;UAS‐RasV12/act>y+ >GAL4, UAS‐GFP; Frt82B, atg13Δ81scrib1/Frt82B, tub‐GAL80, atg13Δ81 |
| EVF 2c: y,w,ey‐FLP/y,w;UAS‐RasV12/act>y+>GAL4, UAS‐GFP; Frt82B/Frt82B, tub‐GAL80 |
| y,w,ey‐FLP/y,w;UAS‐RasV12/act>y+>GAL4, UAS‐GFP; Frt82B, scrib1/Frt82B, tub‐GAL80 |
| y,w,ey‐FLP/y,w;UAS‐RasV12/act>y+>GAL4, UAS‐GFP; Frt82B, atg13Δ81scrib1/Frt82B, tub‐GAL80, atg13Δ81 |
| EVF 2d,e: y,w,ey‐FLP/y,w; g‐atg13, UAS‐RasV12/act>y+>GAL4, UAS‐GFP; Frt82B, atg13Δ81scrib1/Frt82B, tub‐GAL80, atg13Δ81 |
| EVF 2f: y,w,ey‐FLP/y,w;UAS‐RasV12/act>y+>GAL4, UAS‐GFP; Frt82B, atg14Δ5.2,scrib1/Frt82B, tub‐GAL80, atg14Δ5.2 |
| EVF 2g: y,w,ey‐FLP/y,w;UAS‐RasV12, pmCh‐atg8a/act>y+>GAL4, UAS‐GFP; Frt82B/Frt82B, tub‐GAL80 |
| y,w,ey‐FLP/y,w;UAS‐RasV12, pmCh‐atg8a/act>y+>GAL4, UAS‐GFP; Frt82B, scrib1/Frt82B, tub‐ GAL80 |
| y,w,ey‐FLP/y,w;UAS‐RasV12, pmCh‐atg8a/act>y+>GAL4, UAS‐GFP; Frt82B, atg14Δ5.2,scrib1/Frt82B, tub‐GAL80, atg14Δ5.2 |
| EVF 2H: y,w;; Frt82B, atg13Δ81/Frt82B, atg13Δ81 |
| y,w,ey‐FLP/y,w;UAS‐RasV12/act>y+>GAL4, UAS‐GFP; Frt82B, scrib1/Frt82B, tub‐GAL80 |
| y,w,ey‐FLP/y,w;UAS‐RasV12/act>y+>GAL4, UAS‐GFP; Frt82B, atg14Δ5.2,scrib1/Frt82B, tub‐GAL80, atg14Δ5.2 |
| Figure EV3 . |
| EVF 3a: y,w,ey‐FLP/y,w;UAS‐RasV12/act>y+>GAL4, UAS‐GFP; Frt82B, atg13Δ81scrib1/Frt82B, tub‐GAL80, atg13Δ81 |
| y,w,ey‐FLP/y,w;UAS‐RasV12/act>y+>GAL4, UAS‐GFP; Frt82B, scrib1/Frt82B, tub‐GAL80 |
| EVF 3b: y,w,ey‐FLP/y,w;UAS‐RasV12/act>y+>GAL4, UAS‐GFP; Frt82B, atg13Δ81scrib1/Frt82B, tub‐GAL80, atg13Δ81 |
| y,w,ey‐FLP/y,w;UAS‐RasV12/act>y+>GAL4, UAS‐GFP; Frt82B/Frt82B, tub‐GAL80 |
| EVF 3c: y,w,ey‐FLP/y,w;UAS‐RasV12/act>y+>GAL4, UAS‐GFP; Frt82B/Frt82B, tub‐GAL80 |
| y,w,ey‐FLP/y,w;UAS‐RasV12/act>y+>GAL4, UAS‐GFP; Frt82B, scrib1/Frt82B, tub‐GAL80 |
| y,w,ey‐FLP/y,w;UAS‐RasV12/act>y+>GAL4, UAS‐GFP; Frt82B, atg13Δ81scrib1/Frt82B, tub‐GAL80, atg13Δ81 |
| EVF 3d: y,w,ey‐FLP/y,w;UAS‐RasV12/act>y+>GAL4, UAS‐GFP; Frt82B/Frt82B, tub‐GAL80 |
| y,w,ey‐FLP/y,w;UAS‐RasV12/act>y+>GAL4, UAS‐GFP; Frt82B, scrib1/Frt82B, tub‐GAL80 |
| y,w,ey‐FLP/y,w;UAS‐RasV12/act>y+>GAL4, UAS‐GFP; Frt82B, atg13Δ81scrib1/Frt82B, tub‐GAL80, atg13Δ81 |
| Figure EV4 . |
| EVD 4a: y,w,ey‐FLP/y,w;UAS‐RasV12/act>y+>GAL4, UAS‐GFP; Frt82B, scrib1/Frt82B, tub‐GAL80 |
Methods and Protocols
Fly husbandry and fly food
Stocks and crosses were kept at 25°C on standard potato mash fly food containing 32.7 g dried potato powder, 60 g sucrose, 27.3 g dry yeast, 7.3 g agar, 4.55 ml propionic acid, and 2 g nipagin per liter, resulting in a final concentration of 15.3 g/l protein and 6 g/l sugar, unless otherwise indicated.
Temperature sensitive crosses (Fig 4C–H) were set up in 18°C on standard fly food. Third‐instar larval stage L2 larvae were collected and transferred to 30°C incubator for induction of selected genes, under the temperature‐sensitive promoter.
Fly genetics
Clones of mutant cells were generated in eye‐antennal discs using the Mosaic Analysis with a Repressible Marker (MARCM) system with ey‐flp (Lee & Luo, 2001). Full genotypes of experimental animals in each figure are described in the Reagents and Tools Table.
Fly stocks
(1) Frt82B, (2) w1118 (3) ecd1, st1, ca1 , (4) spok‐Gal4, UAS‐Dcr‐2.D (5) UAS‐rpr (Bloomington stock center); (6) atg14Δ5.2/TM6C; (7) g‐atg13; (8) ey3.5‐Hsp70‐DmAtg13 (were described earlier (Katheder et al, 2017)). The following stocks were provided to us (9) 3xCh‐atg8a (G. Juhasz); (10) y,w,ey‐flp; act>y+>Gal4, UAS‐GFP/CyO; Frt82B, tub‐Gal80, (11) y,w;UAS‐RasV12/CyO; Frt82B; (12) y,w;UAS‐RasV12; Frt82B, scrib1/TM6B (by T. Xu); (13) atg13Δ81 (by T.P. Neufeld) (Chang & Neufeld, 2009); (14) pmCh‐atg8a (by E. Baehrecke)(Denton et al, 2012).
Immunofluorescence staining and microscopy
Larval cephalic complexes, muscles, and fat bodies were dissected in PBS and fixed in PBS containing 4% paraformaldehyde for 30 min at room temperature. Samples were washed twice with PBS and blocked with PBT (PBS containing 0.1% Triton X‐100 and 3% BSA). Primary antibody was incubated over night at +4°C, followed by two washes with and secondary antibodies, incubated at room temperature for 1 h. Tissue samples were washed and mounted in Vectashield mounting medium (H‐1000) and observed with a Zeiss LSM 710 or LSM 780 confocal microscope. Hoechst 33342 (Life technologies, H3570, final concentration 5 μg/ml) and Alexa Fluor‐488/647 Phalloidin (H3572, 1:200) were added to stain nuclei and actin, respectively, and Lipid Tox Red (Thermo Fisher Scientific, 1:1,000). Antibodies used in this study: anti‐glycogen monoclonal glycogen antibody (1:100, mouse, IgM, Generous gift from Otto Baba).
Metabolite analysis
Twenty larvae were washed thoroughly with cold Saline (0.9% NaCl solution), ensuring no traces of food were left on the larval body wall. Larvae were dried completely of saline solution by placing them on Kim Tech paper wipes. Larvae were then transferred into pre‐cooled 0.5‐ml microcentrifuge tube with a 3–4 mm cut at the bottom center vertically, one by one and using forceps tip a hole was made into the head region of the larva, avoiding puncturing the tumor or the gut. The 0.5 ml microcentrifuge tube was then transferred into a pre‐cooled 1.5 ml microcentrifuge tube and centrifuged at 1,000 g for 1 min at 4°C for hemolymph extraction. Tube containing the larval carcasses was removed and extracted hemolymph solution was re‐centrifuged at 1,000 g, for 5 min at 4°C for the removal of hemocytes. 5 µl of serum was pipetted into a new pre‐cooled microcentrifuge tube avoiding the hemocytes in the bottom, followed by immediate addition of 70 µl of the extraction solvent (LC‐MS methanol 75%: LC‐MS acetonitrile 25%, Merck, containing labeled standards, Metabolomic QC Kit for Untargeted/Targeted Mass Spectrometry, A Cambridge Isotope Laboratories Company). The solution was mixed well for 5 min. at 4°C. Sample solutions were centrifuged at 14,000 rpm, for 10 min at 4°C. The supernatant was moved into a new Eppendorf tube and kept at −80°C until analysis. LC‐MS metabolomics analysis was performed as described previously (Mackay et al, 2015). Briefly, Thermo Ultimate 3000 high‐performance liquid chromatography (HPLC) system coupled to Q‐Exactive Orbitrap Mass Spectrometer (Thermo Fisher Scientific) was used with a resolution of 35,000 at 200 mass/charge ratio (m/z), electrospray ionization, and polarity switching mode to enable both positive and negative ions across a mass range of 67 to 1,000 m/z. HPLC setup consisted ZIC‐pHILIC column (SeQuant; 150 mm × 2.1 mm, 5 μm; Merck), with a ZIC‐pHILIC guard column (SeQuant; 20 mm × 2.1 mm). 5 μl of Biological extracts was injected, and the compounds were separated with mobile phase gradient of 15 min, starting at 20% aqueous (20 mM ammonium carbonate adjusted to pH 9.2 with 0.1% of 25% ammonium hydroxide) and 80% organic (acetonitrile) and terminated with 20% acetonitrile. Flow rate and column temperature were maintained at 0.2 ml/min and 45°C, respectively, for a total run time of 27 min. All metabolites were detected using mass accuracy below 5 ppm. Thermo Xcalibur was used for data acquisition.
TraceFinder 4.1 was used for analysis. Peak areas of metabolites were determined by using the exact mass of the singly charged ions. The retention time of metabolites was predetermined on the pHILIC column by analyzing an in‐house mass spectrometry metabolite library consisting of commercially available standards. For data normalization, raw data files were processed with Compound Discoverer 3.0 to obtain total compounds peak area for each sample. Each metabolite peak area value analyzed in the sample was normalized to total measurable ions in the sample.
For further calculations, the ion counts measured by the LC‐MS were imported to R (R Core Team, 2019). From the concentration/metabolites peak area that were measured on the LC‐MS instrument, the normalized total amount of each metabolite in circulation per larvae was calculated by multiplying by the hemolymph volume of the larvae with the peak area and dividing by the total measurable ions for that sample. Peak area, volumes, and total measured ions for all samples are supplied in the source data file. To allow log2 (fold change) measurements even if there are metabolites that are not detected in a sample set, all normalized total amounts were added 0.0001 for the log2(fold change) calculations. P values were calculated by the t‐test function in R and volcano plots made by the Enhanced Volcano (Blighe et al, 2019) library in R.
Trehalose measurement
Three larvae of the indicated ages were collected and washed thoroughly in cold PBS three times. Larvae were then dried on a Kim Tech paper and transferred into a 1.5 ml microcentrifuge tube containing ice cold lysis buffer 20 μl/larva (Pierce Luciferase Cell Lysis Buffer (2X), Thermo Scientific) and immediately homogenized using a pellet pestle. Samples were then heated for 10 min at 70°C, followed by centrifugation at 14,000 rpm, for 10 min at 4°C. The supernatant was transferred into a new 1.5 ml microcentrifuge tube.
Trehalose amount was measured using Trehalose Assay Kit (Product code: K‐TREH, Megazyme Ltd.) according to the manufacturer’s instructions, with the exception of using 20 μl of larval sample extraction per 200 μl of total sample volume, in 96‐well plate. Two aliquots were measured, with and without trehalase enzyme, to measure background glucose amount and trehalose converted to glucose amount. Samples were normalized to the amount of larvae and to the control sample (RasV12; control).
Glycogen measurement
Three larvae of the indicated ages were collected and washed thoroughly in cold PBS three times. Larvae were then dried on a Kim Tech paper and transferred into a 1.5 ml microcentrifuge tube containing ice cold lysis buffer 30 μl/larva (Pierce Luciferase Cell Lysis Buffer (2X), Thermo Scientific) and immediately homogenized using a pellet pestle. Samples were then heated for 10 min at 70°C, followed by centrifugation at 14,000 rpm, for 10 min at 4°C. The supernatant was transferred into a new 1.5 ml microcentrifuge tube.
Glycogen amount was measured using Glycogen Colorimetric Assay Kit II (Catalog #: K648, BioVision, Inc), according to the manufacturer’s instructions, with the exception of using 10μl of larval extract solution in the total volume of 150 μl. An addition sample aliquot was measured without Hydrolysis Enzyme Mix to measure the background glucose level, which was subtracted from the total glucose level (background glucose + glycogen converted to glucose) to obtain glycogen only amount. Samples were normalized to the amount of larvae and to the control sample (RasV12; control).
mCherry flux assay, Western blot
Body wall preparations were made from three dissected larvae, added to 30 μl RIPA buffer (150 mM NaCl, 50 mM Tris–HCl pH 7.5, 1% Triton X‐100, 1% sodium deoxycholate, 0.2% SDS) with complete protease inhibitor cocktail (Sigma, 11697498001). Lysates were sonicated 10 cycles of 30 s at high intensity then debris sedimented by centrifugation 10 min, 18,000 g at 4 °c. The cleared lysates were normalized to protein content by the Pierce BCA assay kit (Thermo Scientific, 23227), and 8 μg of protein was added from each sample to a 26‐well Criterion TGX 4–20% precast gel (Bio‐Rad, 5671095). Proteins were transferred to an Immun‐Blot low fluorescence PVDF membrane (Bio‐Rad, 1620264) using a semi‐dry transfer system. Membranes were first blocked in 5% FA‐free BSA for 1 h (Sigma, A7030) then incubated with primary antibodies goat anti‐mCherry (Acris, AB0040‐200) at 1:1,000, mouse anti‐GAPDH (Abcam, ab9484) at 1:2,500, rabbit anti‐Ref(2)p (generated in‐house), and HRP‐conjugated anti‐goat (Jackson Immunoresearch Cat#705‐035‐147). Membranes were then washed and incubated with fluorescent secondary antibodies for the appropriate species (Li‐Cor) using either the 680 nm or 800 nm channels. Finally, membranes were washed and fluorescence detected using an Odyssey imaging system (Li‐Cor). All membrane incubations and washes were performed in PBS with 0.05% Tween‐20 (Sigma, P1379). For the mCherry blot extended view Fig 2F, Supersignal TM, West Dura Extended Duration Substrate (Thermo) was used for ECL. Membrane band quantification was performed with ImageJ, first marking the band area by the rectangle tool, creating a closed area that selects the band area while excluding any surrounding noise by a straight line then selecting the rectangle by the wand tool which gives the quantified band intensity.
Larval locomotor assays
Larval locomotor assay was conducted to measure distance traveled in the set time of 4 min. Individual larva was carefully set on a 15 cm Petri dish containing harden 2% agarose. Larval movement was tracked by drawing over the petri dish cap. Larval traveled distance was measured using fiji, and each line was normalized to the cap diameter.
Larval dry weight
Glass microscopy slides were weighed on a ME54 Mettler Toledo scale. 10 larvae were collected at different time points, washed 3× in water to remove any food particles, dried off on Kim wipes, and dissected directly on the glass slide to remove the entire transformed brain complex and eye discs. Slides were allowed to dry at room temperature for 24 h and weighed again to determine the dry weight of the animals.
Tumor volume measurements
GFP‐expressing tumors were dissected and fixed in 4% formaldehyde PBS for 30 min at room temperature. After three rounds of rinsing in PBS, tumors were mounted in Vectashield with coverslip spacers. Entire tumors were Z‐stack imaged with either: 3 µm slices using a Zeiss LSM780 confocal microscope using a 20× objective, followed by 3D volume reconstructions of absolute intensities of confocal stacks using Imaris 7.6.3 software. For Fig 2, 5, EV4, 2,5‐µm slice stacks were obtained with Nikon Eclipse Ti2‐E microscope equipped with CSU‐W1 dual disk, 50 µm CF & 50 µm SoRa spinning disk confocal scanner unit (Yokogawa), LHU 488 nm 100 mW laser, Prime BSI Scientific CMOS camera and CFI Plan Apochromat Lambda 10X objective (NA 0.20; WD 4.00 mm). Image analysis was performed in NIS‐Elements AR Analysis (Nikon) software. Briefly: Z‐stack images were denoised. GFP channels were segmented by manually adjusted threshold (same threshold was used to each image) and measured by Total Object Volume function. The statistical analysis (unpaired t‐test) was performed in GraphPad Prism 8 software.
Heat fixation and imaging
Larva was collected and washed thoroughly in PBS and transferred into a drop pf 100% glycerol on a microscope slide. To heat fix the larva, the slide was placed onto a heat block at 70°C for approximately 10 s or until larva immobile. Overview of larval fat body and muscles (FGP‐labeled myosin heavy chain (Mhc)) were obtained on a Leica MZ FLIII fluorescence stereomicroscope with a Leica DFC420 camera, using the backlight or fluorescence filters. Dissected cephalic complexes were imaged immediately in a drop of PBS similarly. For the segmentation of fat body occupied space, images were analyzed with Fiji image processing software. Background was subtracted with a rolling ball (radius 400), and images smoothened with Gaussian blur filter (sigma = 2). Thresholding was then performed using the “Minimum dark” method.
Carbon Transfer measured by Stable Isotope Ratios (CATSIR)
C3‐based food was prepared with 32.7 g/l potato mash, 60 g/l sucrose from beets, and 27.3 g/l dry yeast (δ 13C measured to be similar to C3‐type sugars). C4‐based food was prepared with 32.7 g/l corn flour, 62 g/l sucrose from sugar cane, and 26.3 g/l dry yeast that was expanded on sugar cane sucrose. The sugar cane and yeast content of the C4 food was adjusted to account for the slightly higher protein content and lower carbohydrate content of the corn flour compared to the potato mash, giving a similar final fat, protein, and carbohydrate content of the two food variants. Both foods were also added 4.55 ml/l propionic acid (Sigma, P5561), 2 g/l nipagin (Sigma, H5501), and 7.3 g/l agar (AS Pals, 77000). When moving larvae from C3 to C4 food, holes were poked in surface of the new food to give easy access and the larvae were then left for 24 + 1 h, assuming 1 h for the previous C3 food to be absorbed or passed through the gut (Wong et al, Nature Methods, 2008). Before dissection, larvae were washed three times in water and cephalic complex was dissected in a drop of ultrapure water. The cephalic complex from a single larvae was added to a tin cup (Elemental microanalysis, D1006), and samples were left to dry in a desiccator.
The δ13C value and total carbon mass of each sample were determined in triplicate using a Delta V Advantage Isotope Ratio Mass Spectrometer (Thermo Fisher, Bremen, Germany) configured to a Thermo Finnigan 1112 Series Flash Elemental Analyzer at the University of Oslo, Norway. Raw data are reported in standard δ‐notation (in units of permil, ‰) and normalized to the Vienna Pee Dee Belemnite (VPDB) scale using three internal laboratory reference materials (JRICE: δ13C = −27.44‰; JHIST: δ13C = −8.15‰; and JGLY: δ13C = −43.51‰). For all samples, the median standard deviation of the replicate capsules was 0.10‰.
To determine how much carbon is derived from the food or host tissues after moving the larvae from one food to the other, δ13C measurement of any given day was compared to a set of measurements of larval cephalic complexes growing on only C3 or C4 food. This comparison is required because the δ13C of the cephalic complex with a growing tumor gradually changes as the tumor grows, as is described in more detail in the method publication (Holland et al, 2021). First, the relative ratio of carbon derived from food and host was determined by comparing the measured δ13C to the C3‐ and C4‐only samples. Then the measured total carbon mass of the cephalic complex was multiplied by this relative ratio to determine the total carbon added from the two different carbon sources.
Larval hatching and pupation rate
Timed 4‐h egg laying (09:00–13:00) was performed to synchronize cultures and avoid crowding. Hatching and pupation were registered each day at 11:00 from day 3 after egg laying (AEL).
µ‐CT
Labeling: Third‐instar larvae were collected and transferred to a 1.5‐ml Eppendorf tube containing 1 ml of 0.5% phosphate‐buffered saline + Triton X‐100 (0.5% PBST) and incubated for 5 min at room temperature. Larvae were then fixed in 1 ml Bouin’s solution (5% acetic acid, 9% formaldehyde, 0.9% picric acid; Sigma‐Aldrich, St. Lous, MO) for 2 h at room temperature. A microdissection needle was then used to poke a small hole in the cuticle at both the anterior and posterior ends of each larva, carefully avoiding any underlying soft tissue. This allows for better penetration of Bouin’s solution and even fixation of all larval tissues. Fresh Bouin’s solution was then added, and larvae were left to incubate another 16–22 h at room temperature. Larvae were then washed 3 × 30 min in 1 ml of µ‐CT Wash Buffer (0.1 M Na2HPO4, 1.8% Sucrose) and stained with 1 ml of a 0.1N solution of iodine–iodide (I2KI, Lugol’s solution) for 1–2 days at room temperature. Larvae were then washed in two changes of ultrapure water and stored at room temperature.
Scanning: Individual larva were mounted for scanning using a P10 pipet tip filled with water, wedged inside a small piece of plastic capillary tube that fits tightly in a custom‐made brass holder. A dulled 20‐gauge needle was used to gently push the larva down in the pipet tip until it became wedged along the wall, which was necessary to prevent sample movement during scanning. Larva was scanned using a SkyScan 1172 desktop scanner controlled by SkyScan software (Bruker) operating on a Dell workstation computer (Intel Xeon X5690 processor @ 3.47GHz (12 CPUs), 50 GB RAM and an NVIDIA Quadro 5000 (4GB available graphics memory) GPU). X‐Ray source voltage and current settings: 40 kilovolts (kV), 110 microamps (μA), 4 watts (W) of power. A Hamamatsu 10 Mp camera with a 11.54 μm pixel size coupled to a scintillator was used to convert X‐rays to photons. Medium camera settings at an image pixel size of 4.5 μm were used for fast scans (˜20 min), which consists of about 300 projection images that are acquired. Small camera settings at an image pixel size of 2.5 μm and utilizing 360 degrees of sample rotation (˜1500 projection images) were used for the slow overnight (O/N) scans. Random movement was set to 10 and frame averaging ranged from 4 to 8. At these settings, the scanner has a measured resolution of 5.5 μm under optimal imaging conditions (Morales et al, 2016). Medium camera settings (fast scans) provide enough resolution for accurate morphometric analysis of tissues, whereas small camera settings (slow O/N scans) provide high resolution for assessment of tissue/tumor morphology.
Reconstruction: Tomograms were generated using NRecon software (Bruker MicroCT, v1.7.0.4). Reconstruction was performed using a built‐in shit correction algorithm that uses reference scans to correct for sample drift in the projection images, followed by an iterative application of misalignment and ring artifact reduction algorithms to generate the highest quality images possible (Salmon et al, 2009).
Image Analysis and Statistics: Tomograms were visualized and analyzed using Dragonfly (v4.1, Object Research Systems (ORS) Inc, Montreal, Canada, 2019; software available at http://www.theobjects.com/dragonfly) operating on a Dell workstation (Intel Xeon CPU E5‐2623 @ 3.00GHz (16 CPUs), 32 GB RAM, NVIDIA Quadro M2000 GPU (20 GB available graphics memory) and Dell Precision T7600 workstation (Intel® Xeon® CPU E5‐2620 @ 2.00GHz, 32GB RAM, 64‐bit Operating System, 3GB NVIDIA Quadro K4000 GPU). Segmentation of anatomical structures into individual regions of interest (ROIs) was performed manually using thresholded images with the 3D paintbrush function. To eliminate human bias during segmentation, a single threshold value was selected that encompassed the entire structure of interest in all images that were to be compared. This threshold value was then applied to all images and used for segmentation of tissues into ROIs. Small adjustments to this threshold value for some individuals were made when necessary to fully encompass a given tissue to be measured, to account for slight differences in contrast (as a result of X‐Ray beam fluctuations) between samples. ROIs were then converted to meshes for quantitative analysis and visualization. The built‐in 2D and 3D movie maker was used to generate all movies.
Author contributions
RK, PH, EG, WMH, AHJ, and TER designed the research; RK, PH, TS, IA, ST, CD, AJ, TAS, FOF, SWS, NSK, JGTR, and MMR performed experiments and analyzed the data. EMQ and RN performed analysis of μ‐CT data. AB, HJ, and NMR contributed to the conception of the work. RK, PH, and TER wrote the manuscript. TER is the leading principal investigator who conceived the project, supervised research, and edited the paper.
Conflict of interest
EG is a Board member and a shareholder of Metabomed Ltd, Israel. NSK and HJ are employees at Genentech, Inc.
Supporting information
Review Process File
Expanded View Figures PDF
Movie EV1
Movie EV2
Movie EV3
Movie EV4
Movie EV5
Movie EV6
Movie EV7
Movie EV8
Movie EV9
Source Data for Expanded View/Appendix
Source Data for Figure 2
Source Data for Figure 3
Source Data for Figure 5
Acknowledgements
RK, FOF, AJ, CD, and TER were supported by grants #262652 and #276070 from the Norwegian Research Council (to TER). PH ST were supported by HSØ grant #40041 (to TER). NMR and TAS are supported by the Division of Intramural Research at the National Institutes of Health/National Heart, Lung, and Blood Institute (1ZIAHL006126 to NMR and 1K22HL137902 to TAS). We thank the Laura and Isaac Perlmutter Fund for supporting the Technion's metabolomics facility, and the Simon Fougner Hartmann’s fund for research support (to TER). This work was supported by Office of Science, Research Council of Norway through its Centers of Excellence funding scheme #223272. We thank Eileen White and Geir Bjørkøy for stimulating discussions and suggestions to the project and Anne Simonsen, Harald Stenmark, and Jorrit Enserink for critically reading the manuscript.
The EMBO Journal (2021) 40: e107336.
Data availability
Metabolomics data have been deposited to the EMBL‐EBI MetaboLights database (https://doi.org/10.1093/nar/gkz1019, PMID: 31691833) with the identifier MTBLS2771.
The complete dataset can be accessed here https://www.ebi.ac.uk/metabolights/MTBLS2771
References
- Aversa Z, Pin F, Lucia S, Penna F, Verzaro R, Fazi M, Colasante G, Tirone A, Fanelli FR, Ramaccini Cet al (2016) Autophagy is induced in the skeletal muscle of cachectic cancer patients. Sci Rep 6: 30340 [DOI] [PMC free article] [PubMed] [Google Scholar]
- Baracos VE, Martin L, Korc M, Guttridge DC, Fearon KCH (2018) Cancer‐associated cachexia. Nat Rev Dis Primers 4: 17105 [DOI] [PubMed] [Google Scholar]
- Bhatt V, Khayati K, Hu ZS, Lee A, Kamran W, Su X, Guo JY (2019) Autophagy modulates lipid metabolism to maintain metabolic flexibility for Lkb1‐deficient Kras‐driven lung tumorigenesis. Genes Dev 33: 150–165 [DOI] [PMC free article] [PubMed] [Google Scholar]
- Blighe K, Rana S, Lewis M (2019) EnhancedVolcano: Publication‐ready volcano plots with enhanced colouring and labeling. R package version 1.4.0. https://github.com/kevinblighe/EnhancedVolcano
- Brumby AM, Richardson HE (2003) scribble mutants cooperate with oncogenic Ras or Notch to cause neoplastic overgrowth in Drosophila . EMBO J 22: 5769–5779 [DOI] [PMC free article] [PubMed] [Google Scholar]
- Chang YY, Neufeld TP (2009) An Atg1/Atg13 complex with multiple roles in TOR‐mediated autophagy regulation. Mol Biol Cell 20: 2004–2014 [DOI] [PMC free article] [PubMed] [Google Scholar]
- Chartrand MMG, Mester Z (2019) Carbon isotope measurements of foods containing sugar: a survey. Food Chem 300: 125106 [DOI] [PubMed] [Google Scholar]
- Colombani J, Andersen DS, Leopold P (2012) Secreted peptide Dilp8 coordinates Drosophila tissue growth with developmental timing. Science (New York NY) 336: 582–585 [DOI] [PubMed] [Google Scholar]
- Denton D, Chang TK, Nicolson S, Shravage B, Simin R, Baehrecke EH, Kumar S (2012) Relationship between growth arrest and autophagy in midgut programmed cell death in Drosophila . Cell Death Differ 19: 1299–1307 [DOI] [PMC free article] [PubMed] [Google Scholar]
- Figueroa‐Clarevega A, Bilder D (2015) Malignant Drosophila tumors interrupt insulin signaling to induce cachexia‐like wasting. Dev Cell 33: 47–55 [DOI] [PMC free article] [PubMed] [Google Scholar]
- Galluzzi L, Pietrocola F, Bravo‐San Pedro JM, Amaravadi RK, Baehrecke EH, Cecconi F, Codogno P, Debnath J, Gewirtz DA, Karantza Vet al (2015) Autophagy in malignant transformation and cancer progression. The EMBO journal 34: 856–880 [DOI] [PMC free article] [PubMed] [Google Scholar]
- Garelli A, Gontijo AM, Miguela V, Caparros E, Dominguez M (2012) Imaginal discs secrete insulin‐like peptide 8 to mediate plasticity of growth and maturation. Science (New York NY) 336: 579–582 [DOI] [PubMed] [Google Scholar]
- Guo JY, Xia B, White E (2013) Autophagy‐mediated tumor promotion. Cell 155: 1216–1219 [DOI] [PMC free article] [PubMed] [Google Scholar]
- Holland P, Hagopian WM, Jahren AH, Rusten TE (2021) Natural abundance isotope ratios to differentiate sources of carbon used during tumor growth in vivo. BMC Biol 19: 85 [DOI] [PMC free article] [PubMed] [Google Scholar]
- Jahren AH, Saudek C, Yeung EH, Kao WH, Kraft RA, Caballero B (2006) An isotopic method for quantifying sweeteners derived from corn and sugar cane. Am J Clin Nutr 84: 1380–1384 [DOI] [PubMed] [Google Scholar]
- Karsli‐Uzunbas G, Guo JY, Price S, Teng X, Laddha SV, Khor S, Kalaany NY, Jacks T, Chan CS, Rabinowitz JDet al (2014) Autophagy is required for glucose homeostasis and lung tumor maintenance. Cancer Discov 4: 914–927 [DOI] [PMC free article] [PubMed] [Google Scholar]
- Katheder NS, Khezri R, O’Farrell F, Schultz SW, Jain A, Rahman MM, Schink KO, Theodossiou TA, Johansen T, Juhász Get al (2017) Microenvironmental autophagy promotes tumour growth. Nature 541: 417–420 [DOI] [PMC free article] [PubMed] [Google Scholar]
- Kimmelman AC, White E (2017) Autophagy and tumor metabolism. Cell Metab 25: 1037–1043 [DOI] [PMC free article] [PubMed] [Google Scholar]
- Kuma A, Hatano M, Matsui M, Yamamoto A, Nakaya H, Yoshimori T, Ohsumi Y, Tokuhisa T, Mizushima N (2004) The role of autophagy during the early neonatal starvation period. Nature 432: 1032–1036 [DOI] [PubMed] [Google Scholar]
- Lee T, Luo L (2001) Mosaic analysis with a repressible cell marker (MARCM) for Drosophila neural development. Trends Neurosci 24: 251–254 [DOI] [PubMed] [Google Scholar]
- Mackay GM, Zheng L, van den Broek NJ, Gottlieb E (2015) Analysis of cell metabolism using LC‐MS and isotope tracers. Methods Enzymol 561: 171–196 [DOI] [PubMed] [Google Scholar]
- Mayers JR, Wu C, Clish CB, Kraft P, Torrence ME, Fiske BP, Yuan C, Bao Y, Townsend MK, Tworoger SSet al (2014) Elevation of circulating branched‐chain amino acids is an early event in human pancreatic adenocarcinoma development. Nat Med 20: 1193–1198 [DOI] [PMC free article] [PubMed] [Google Scholar]
- Morales AG, Stempinski ES, Xiao X, Patel A, Panna A, Olivier KN, McShane PJ, Robinson C, George AJ, Donahue DRet al (2016) Micro‐CT scouting for transmission electron microscopy of human tissue specimens. J Microsc 263: 113–117 [DOI] [PMC free article] [PubMed] [Google Scholar]
- Newton H, Wang YF, Camplese L, Mokochinski JB, Kramer HB, Brown AEX, Fets L, Hirabayashi S (2020) Systemic muscle wasting and coordinated tumour response drive tumourigenesis. Nat Commun 11: 4653 [DOI] [PMC free article] [PubMed] [Google Scholar]
- Pagliarini RA, Xu T (2003) A genetic screen in Drosophila for metastatic behavior. Science (New York NY) 302: 1227–1231 [DOI] [PubMed] [Google Scholar]
- Penna F, Baccino FM, Costelli P (2014) Coming back: autophagy in cachexia. Curr Opin Clin Nutr Metab Care 17: 241–246 [DOI] [PubMed] [Google Scholar]
- Penna F, Ballarò R, Martinez‐Cristobal P, Sala D, Sebastian D, Busquets S, Muscaritoli M, Argilés JM, Costelli P, Zorzano A (2019) Autophagy exacerbates muscle wasting in cancer cachexia and impairs mitochondrial function. J Mol Biol 431: 2674–2686 [DOI] [PubMed] [Google Scholar]
- Penna F, Costamagna D, Pin F, Camperi A, Fanzani A, Chiarpotto EM, Cavallini G, Bonelli G, Baccino FM, Costelli P (2013) Autophagic degradation contributes to muscle wasting in cancer cachexia. The American journal of pathology 182: 1367–1378 [DOI] [PubMed] [Google Scholar]
- Poillet‐Perez L, White E (2019) Role of tumor and host autophagy in cancer metabolism. Genes Dev 33: 610–619 [DOI] [PMC free article] [PubMed] [Google Scholar]
- Poillet‐Perez L, Xie X, Zhan Le, Yang Y, Sharp DW, Hu ZS, Su X, Maganti A, Jiang C, Lu Wet al (2018) Autophagy maintains tumour growth through circulating arginine. Nature 563: 569–573 [DOI] [PMC free article] [PubMed] [Google Scholar]
- R Core Team (2019) R: a language and environment for statistical computing. Vienna: R Foundation for Statistical Computing. https://www.R‐project.org/ [Google Scholar]
- Rosenfeldt MT, O’Prey J, Morton JP, Nixon C, MacKay G, Mrowinska A, Au A, Rai TS, Zheng L, Ridgway Ret al (2013) p53 status determines the role of autophagy in pancreatic tumour development. Nature 504: 296–300 [DOI] [PubMed] [Google Scholar]
- Salmon PL, Liu X, Sasov A (2009) A post‐scan method for correcting artefacts of slow geometry changes during micro‐tomographic scans. J Xray Sci Technol 17: 161–174 [DOI] [PubMed] [Google Scholar]
- Schoborg TA, Smith SL, Smith LN, Morris HD, Rusan NM (2019) Micro‐computed tomography as a platform for exploring Drosophila development. Development 146: dev176685 [DOI] [PMC free article] [PubMed] [Google Scholar]
- Sousa CM, Biancur DE, Wang X, Halbrook CJ, Sherman MH, Zhang Li, Kremer D, Hwang RF, Witkiewicz AK, Ying Het al (2016) Pancreatic stellate cells support tumour metabolism through autophagic alanine secretion. Nature 536: 479–483 [DOI] [PMC free article] [PubMed] [Google Scholar]
- Strohecker AM, Guo JY, Karsli‐Uzunbas G, Price SM, Chen GJ, Mathew R, McMahon M, White E (2013) Autophagy sustains mitochondrial glutamine metabolism and growth of BrafV600E‐driven lung tumors. Cancer Discov 3: 1272–1285 [DOI] [PMC free article] [PubMed] [Google Scholar]
- Tardif N, Klaude M, Lundell L, Thorell A, Rooyackers O (2013) Autophagic‐lysosomal pathway is the main proteolytic system modified in the skeletal muscle of esophageal cancer patients. Am J Clin Nutr 98: 1485–1492 [DOI] [PubMed] [Google Scholar]
- Xie X, Koh JY, Price S, White E, Mehnert JM (2015) Atg7 overcomes senescence and promotes growth of BrafV600E‐driven melanoma. Cancer Discov 5: 410–423 [DOI] [PMC free article] [PubMed] [Google Scholar]
- Yang A, Herter‐Sprie G, Zhang H, Lin EY, Biancur D, Wang X, Deng J, Hai J, Yang S, Wong K‐Ket al (2018) Autophagy sustains pancreatic cancer growth through both cell‐autonomous and nonautonomous mechanisms. Cancer Discov 8: 276–287 [DOI] [PMC free article] [PubMed] [Google Scholar]
- Yang A, Rajeshkumar NV, Wang X, Yabuuchi S, Alexander BM, Chu GC, Von Hoff DD, Maitra A, Kimmelman AC (2014) Autophagy is critical for pancreatic tumor growth and progression in tumors with p53 alterations. Cancer Discov 4: 905–913 [DOI] [PMC free article] [PubMed] [Google Scholar]
- Zirin J, Nieuwenhuis J, Perrimon N (2013) Role of autophagy in glycogen breakdown and its relevance to chloroquine myopathy. PLoS Biol 11: e1001708 [DOI] [PMC free article] [PubMed] [Google Scholar]
Associated Data
This section collects any data citations, data availability statements, or supplementary materials included in this article.
Supplementary Materials
Review Process File
Expanded View Figures PDF
Movie EV1
Movie EV2
Movie EV3
Movie EV4
Movie EV5
Movie EV6
Movie EV7
Movie EV8
Movie EV9
Source Data for Expanded View/Appendix
Source Data for Figure 2
Source Data for Figure 3
Source Data for Figure 5
Data Availability Statement
Metabolomics data have been deposited to the EMBL‐EBI MetaboLights database (https://doi.org/10.1093/nar/gkz1019, PMID: 31691833) with the identifier MTBLS2771.
The complete dataset can be accessed here https://www.ebi.ac.uk/metabolights/MTBLS2771