

Key Points
Question
Does treatment with oral inosine for up to 2 years slow progression of Parkinson disease?
Findings
In this randomized clinical trial that included 298 participants with early Parkinson disease, the rate of clinical disease progression as measured by the Movement Disorder Society Unified Parkinson Disease Rating Scale (parts I-III) total score prior to initiation of dopaminergic medication was 11.1 points per year in the inosine group and 9.9 points per year in the placebo group, a difference that was not statistically significant.
Meaning
Urate-elevating inosine treatment was not clinically beneficial in early Parkinson disease.
Abstract
Importance
Urate elevation, despite associations with crystallopathic, cardiovascular, and metabolic disorders, has been pursued as a potential disease-modifying strategy for Parkinson disease (PD) based on convergent biological, epidemiological, and clinical data.
Objective
To determine whether sustained urate-elevating treatment with the urate precursor inosine slows early PD progression.
Design, Participants, and Setting
Randomized, double-blind, placebo-controlled, phase 3 trial of oral inosine treatment in early PD. A total of 587 individuals consented, and 298 with PD not yet requiring dopaminergic medication, striatal dopamine transporter deficiency, and serum urate below the population median concentration (<5.8 mg/dL) were randomized between August 2016 and December 2017 at 58 US sites, and were followed up through June 2019.
Interventions
Inosine, dosed by blinded titration to increase serum urate concentrations to 7.1-8.0 mg/dL (n = 149) or matching placebo (n = 149) for up to 2 years.
Main Outcomes and Measures
The primary outcome was rate of change in the Movement Disorder Society Unified Parkinson Disease Rating Scale (MDS-UPDRS; parts I-III) total score (range, 0-236; higher scores indicate greater disability; minimum clinically important difference of 6.3 points) prior to dopaminergic drug therapy initiation. Secondary outcomes included serum urate to measure target engagement, adverse events to measure safety, and 29 efficacy measures of disability, quality of life, cognition, mood, autonomic function, and striatal dopamine transporter binding as a biomarker of neuronal integrity.
Results
Based on a prespecified interim futility analysis, the study closed early, with 273 (92%) of the randomized participants (49% women; mean age, 63 years) completing the study. Clinical progression rates were not significantly different between participants randomized to inosine (MDS-UPDRS score, 11.1 [95% CI, 9.7-12.6] points per year) and placebo (MDS-UPDRS score, 9.9 [95% CI, 8.4-11.3] points per year; difference, 1.26 [95% CI, −0.59 to 3.11] points per year; P = .18). Sustained elevation of serum urate by 2.03 mg/dL (from a baseline level of 4.6 mg/dL; 44% increase) occurred in the inosine group vs a 0.01-mg/dL change in serum urate in the placebo group (difference, 2.02 mg/dL [95% CI, 1.85-2.19 mg/dL]; P<.001). There were no significant differences for secondary efficacy outcomes including dopamine transporter binding loss. Participants randomized to inosine, compared with placebo, experienced fewer serious adverse events (7.4 vs 13.1 per 100 patient-years) but more kidney stones (7.0 vs 1.4 stones per 100 patient-years).
Conclusions and Relevance
Among patients recently diagnosed as having PD, treatment with inosine, compared with placebo, did not result in a significant difference in the rate of clinical disease progression. The findings do not support the use of inosine as a treatment for early PD.
Trial Registration
ClinicalTrials.gov Identifier: NCT02642393
This randomized clinical trial assesses whether sustained urate-elevating treatment with the urate precursor inosine, compared with placebo, slows rate of clinical disease progression among patients with early Parkinson disease.
Introduction
Urate is the enzymatic end product of purine metabolism in humans and other hominoids due to multiple mutations of the urate oxidase gene unique to primate evolution.1,2 The resulting urate elevation may have been advantageous as urate constitutes the main antioxidant circulating in human plasma.2,3 Oxidative damage is thought to play a role in the underlying dopaminergic neuron degeneration of Parkinson disease (PD), and urate protects dopaminergic neurons in cellular and animal models of PD.2,4,5 Clinically, concentrations of urate (or uric acid) that exceed the limits of its solubility cause crystallopathic disorders of gout and kidney stones, but elevated serum urate in healthy individuals is a reduced-risk factor for PD.6,7,8 In early PD, higher urate concentrations in serum and cerebrospinal fluid are associated with subsequently slower progression of motor and nonmotor disability and slower loss of striatal dopamine transporter.9,10,11,12
These findings prompted a phase 2 trial of oral inosine, a metabolic precursor of urate and dietary supplement, in early PD.13 Participants with a serum urate concentration below the population median of 6 mg/dL (360 μmol/L) were randomized to receive placebo or inosine titrated to elevate serum urate to either 6.1-7.0 mg/dL or 7.1-8.0 mg/dL for up to 2 years. Up to 3 g/d of oral inosine demonstrated adequate safety and tolerability, elevated serum and cerebrospinal fluid urate concentrations, and dose-dependently increased plasma antioxidant capacity and was associated with favorable clinical outcomes.13,14 A phase 3 trial of urate-elevating inosine in early PD was designed based on these collective findings, and its results are reported herein.
Methods
The trial design is detailed in the study protocol (Supplement 1), which was accepted under a noncommercial investigational new drug application (No. 100 896) to the US Food and Drug Administration and approved by institutional review boards of the administrative and coordination centers and all clinical sites. All participants provided written informed consent. A data and safety monitoring board provided independent oversight. Along with the study protocol in Supplement 1, the statistical analysis plan is available in Supplement 2. This study used the NINDS Common Data Elements (http://www.commondataelements.ninds.nih.gov/).15
Participants and Sites
Enrollment criteria for the Study of Urate Elevation in Parkinson Disease (SURE-PD3) were modeled on observational studies9,10 in which higher urate was predictive of slower disease progression among people with untreated PD. However, in SURE-PD3, only the subset of early PD participants whose serum urate concentration was below the expected median (<5.8 mg/dL) were included (see diagram on p 10 in the study protocol in Supplement 1), as this subpopulation is at risk of faster progression of disability and can more safely accommodate increases in serum urate. Individuals at greater risk due to elevated urate (ie, those with a history of gout or uric acid urolithiasis, urine pH ≤5.0 [a risk factor for uric acid urolithiasis], established cardiovascular disease, or estimated glomerular filtration rate [eGFR] <60 mL/min/1.73 m2) were excluded. Eligibility criteria were assessed during 2 screening visits at 61 credentialed US clinical sites of the Parkinson Study Group (http://www.parkinson-study-group.org). Eligibility required a PD diagnosis by a movement disorders neurologist who judged the participant to be unlikely to require dopaminergic drug therapy other than an existing stable dose of a monoamine oxidase B inhibitor within 3 months of enrollment.13 Central adjudication of dopamine transporter ligand (DaTscan; GE Healthcare) uptake into the striatum excluded individuals lacking evidence of dopaminergic deficit. In keeping with federal funding requirements and to assess the effectiveness of efforts to improve participation of underrepresented groups in PD trials, race and ethnicity information was collected as self-determined by participants based on fixed categories. Sex information was also collected as self-identified by participants.
Randomization
Eligible participants were randomized 1:1 to inosine or placebo by a computer-generated randomization schedule, stratified by site in permuted blocks of 4. Participants, all site staff, and all central staff other than the unblinded statistician and programmer and the central pharmacy were blinded to treatment assignment.
Intervention, Dose Titration, and Follow-up
Active drug (inosine) or matching placebo (lactose) were taken orally at dosages of up to two 500-mg capsules 3 times daily for 24 months after enrollment (period 1). Inosine dosing was titrated in a blinded manner (pp 37 and 51-52 in the study protocol in Supplement 1) to elevate and maintain serum urate and maintain concentrations between 7.1 and 8.0 mg/dL when measured prior to the first daily dose (when concentrations are approximately 0.7 mg/dL below near-peak concentrations13). Placebo dosing was based on an algorithm designed to match dose adjustments in the inosine group. During the 3-month washout following study drug discontinuation (period 2), participants were followed up monthly by telephone and completed a second dopamine transporter brain scan (see diagram on p 10 in the study protocol in Supplement 1). In January 2018, the maximum daily inosine dosage was reduced to 2 g/d to limit kidney stone risk.
Outcomes
The primary outcome was the Movement Disorder Society Unified Parkinson Disease Rating Scale (MDS-UPDRS) parts I-III, a composite scale comprising patient- and clinician-reported outcomes, with higher scores reflecting greater disability (summed total range, 0-236 points). Secondary outcome variables addressed pharmacodynamics (via serum and urine urate concentrations), efficacy, and adverse events. Secondary efficacy outcomes were scores on the individual MDS-UPDRS parts (I, II, and III) and 2 functionally organized subsets of its component questions (ambulatory capacity and the patient-reported outcome of parts Ib and II combined), disability warranting initiation of dopaminergic therapy, 13 modules from the Quality of Life in Neurological Disorders assessment, the 39-item Parkinson Disease Questionnaire, the modified Schwab and England Activities of Daily Living Scale, the Montreal Cognitive Assessment, and 4 measures of orthostatic vital signs. Outcome scale descriptions (including reference ranges, directionality, and minimum clinically important differences when available) are detailed in eTable 1 in Supplement 3. Efficacy was also assessed by neuroimaging of loss of striatal dopamine transporter binding signal. Safety-related outcomes included adverse events, tolerability as assessed after 12 weeks, 12 months, and 24 months (defined as statistically significantly greater than 50% of participants continuing study drug treatment without more than 4 weeks of dose reduction), vital signs, and routine laboratory tests including electrocardiograms and measurement of blood lipids, glucose, electrolytes, cell counts, and spot and 24-hour urine. Secondary analyses were carried out stratified by sex or restricted to an as-treated sample. Exploratory outcomes included questionnaire responses on participants’ expectations (not reported herein) and probable rapid eye movement sleep behavior disorder. The schedule of activities (p 78 in the study protocol in Supplement 1) shows the timing of all assessments.
Sample Size Determination
With 270 randomized participants, the study was designed to have 80% power to detect a 20% reduction by inosine in the expected rate of progression; ie, a reduction in the 2-year increase in MDS-UPDRS parts I-III by 6.3 points, which corresponds with patient assessment of a minimum clinically important difference16 (Section 10.3.1 in the study protocol in Supplement 1).
Statistical Analyses
The primary analysis included all randomized participants classified according to their randomization group assignment (as-randomized sample) to estimate the rate of change of MDS-UPDRS (parts I-III) total scores during period 1 in a random slopes model with shared baseline, censoring observations made after initiation of dopaminergic therapy (see details in the statistical analysis plan in Supplement 2). The model included fixed terms for time, treatment interaction with time, and 3 covariates (sex, baseline monoamine oxidase B inhibitor use, and baseline Schwab and England Activities of Daily Living Scale score) and their interactions with time. The model included random site- and participant-specific intercepts and slopes, each with unstructured covariance. The shared-baseline construction implicitly adjusted for baseline MDS-UPDRS score in addition to adjustment for the covariates. The random effects accommodated covariance among participants from the same site and among repeated observations from the same participant. The model accommodated data missing due to censoring after initiation of dopaminergic therapy and early termination or loss to follow-up, with unbiased estimates and appropriate adjustment in precision under a missing-at-random assumption conditional on the observed data and the model structure.
Additional analyses applied the primary model to secondary end points in the as-randomized sample, assessed an as-treated sample restricted to time receiving study drug, and determined incidence of time-to-event outcomes and rates of adverse events among a safety sample of participants who initiated study drug. Kaplan-Meier product-limit estimates were used to calculate the percentage of participants needing dopaminergic therapy by 12 months. Because of the potential for type I error due to multiple comparisons, findings for analyses of secondary end points should be interpreted as exploratory. Two prespecified, blinded interim analyses with early stopping rules for efficacy and nonbinding futility were completed after approximately one-third and three-quarters of total anticipated follow-up. Early stopping for efficacy used a Haybittle-Peto boundary at a 1-sided P < .001. Early stopping for futility used a β-spending rule linear in information time. The significance threshold for the primary analysis was a 2-tailed P < .046 to accommodate 2 interim analyses. All other safety and efficacy analyses were considered exploratory and were evaluated using 2-sided tests at a significance level of P < .05. All analyses were performed using SAS version 9.4 (SAS Institute Inc).
Early Study Completion
In September 2018, the data and safety monitoring board reviewed the second prespecified, nonbinding interim analysis for early stopping due to efficacy or futility of inosine treatment. Its results (87% of maximum information; z = 1.25; P = .21 in favor of placebo) met the prespecified criterion for futility (β-spending quadratic in information time) for the hypothesized beneficial effect on the primary outcome. The data and safety monitoring board considered this result along with cumulative safety data and on October 1, 2018, recommended an early, orderly completion of the study while preserving the opportunity to collect a final set of outcome data and biospecimens from patients still taking study drug. Sites and participants were apprised in October 2018 of the modified early completion plan, which included an option for participants to continue taking study drug until their next scheduled study visit, up to 3 months later. The last participant completed a final safety/washout visit in June 2019.
Results
From July 12, 2016, to December 21, 2017, 587 participants consented from 61 sites, 289 had screening failure (64% had a serum urate concentration ≥5.8 mg/dL and 10% had a brain scan without evidence of dopaminergic deficit ) and 298 were randomized (149 to each group) (Figure 1). At baseline, randomized participants had demographic, clinical, and laboratory features (Table 1; eTable 2 in Supplement 3) typical of early, largely untreated PD, except for a higher proportion of women (equal to that of men) that resulted from exclusion of participants with serum urate levels equal to or greater than 5.8 mg/dL, only 16% of whom were women.
Figure 1. Participant Flow in the SURE-PD3 Trial.

DaT indicates dopamine transporter; eGFR, estimated glomerular filtration rate.
aWith stratification by clinical site.
bThese participants had completed participation but stopped study drug early prior to early study closure.
cAmong these participants, 18 experienced treatment-emergent adverse events, including 11 who had a kidney stone.
dAmong these participants, 9 experienced treatment-emergent adverse events, including 1 who had a kidney stone.
eAmong these participants, 10 experienced treatment-emergent adverse events, including 2 who had a kidney stone.
fAmong these participants, 2 experienced treatment-emergent adverse events (none had a kidney stone).
Table 1. Baseline Participant Characteristics.
| Characteristics | Inosine (n = 149) | Placebo (n = 149) |
|---|---|---|
| Age, mean (SD), y | 63 (10) | 64 (9) |
| Sex, No. (%) | ||
| Female | 80 (54) | 67 (45) |
| Male | 69 (46) | 82 (55) |
| Race, No. (%)a | n = 148 | n = 147 |
| Asian | 2 (1.4) | 1 (0.7) |
| Black or African American | 2 (1.4) | 0 |
| Multiracial | 1 (0.7) | 1 (0.7) |
| White | 143 (97) | 145 (99) |
| Ethnicity, No. (%)a | ||
| Hispanic or Latino | 5 (3.4) | 4 (2.7) |
| Non-Hispanic or non-Latino | 144 (97) | 145 (97) |
| Years of education, No. (%) | 17.1 (3.0) | 16.0 (2.4) |
| Years since first Parkinson disease symptom, median (IQR) | 1.90 (1.21-2.95) | 1.76 (1.03-2.77) |
| Years since Parkinson disease diagnosis, median (IQR) | 0.52 (0.19-1.01) | 0.47 (0.19-0.97) |
| Taking monoamine oxidase B inhibitor, No. (%) | 50 (34) | 62 (42) |
| Resting tremor at diagnosis, No. (%) | 126 (85) | 125 (84) |
| Probable REM sleep behavior disorder (appears to act out dreams), No./total (%) | 38/148 (26) | 38/149 (26) |
| Modified Hoehn and Yahr scale score, mean (SD)b | 1.7 (0.5) | 1.8 (0.4) |
| Modified S&E ADL Scale score, mean (SD)c | 94 (5) | 94 (5) |
| MDS-UPDRS (parts I-III) total score, mean (SD)d | 32 (12) | 34 (13) |
| Montreal Cognitive Assessment score, mean (SD)e | 28 (2) | 27 (2) |
| Neuro-QoL depression score, median (IQR)f,g | 9.0 (8.0-10.0) | 8.0 (8.0-10.0) |
| Serum urate, mean (SD), mg/dLg,h | 4.6 (0.9) | 4.7 (0.8) |
| Urine urate excretion, mean (SD), mg per 24 hi | 527 (177) | 515 (190) |
| Orthostatic systolic blood pressure change, mean (SD), mm Hg | −3.3 (11) | −3.1 (11) |
| Body mass indexj | ||
| Median (IQR) | 25.8 (23.0-28.2) | 25.9 (23.5-28.8) |
| ≥30, No. (%) | 26 (17) | 26 (17) |
| Estimated glomerular filtration rate, mean (SD), mL/min/1.73 m2g,k | 83 (12) | 83 (11) |
| DaTscan striatal specific binding ratio, mean (SD)g,l | 1.62 (0.48) | 1.56 (0.44) |
Abbreviations: DaT, dopamine transporter; IQR, interquartile range; REM, rapid eye movement.
Demographic data on race and ethnicity were recorded (based on participant self-identification in response to both fixed categories and open-ended questions) to assess effectiveness of study strategies for increased enrollment of underrepresented minorities (see Supplement 1).
The modified Hoehn and Yahr scale is an 8-level Parkinson disease staging instrument, with the lowest stage (0) indicating “no signs of disease” and the highest stage (5) indicating “wheelchair bound or bedridden unless aided.”
The modified Schwab and England Activities of Daily Living (S&E ADL) Scale is a site investigator and participant assessment of a participant’s level of independence, scored on a percentage scale reflective of the participant’s ability to perform ADLs. Scores range from 100% to 0% in increments of 5%, in which 100% represents full ability and complete independence and 0% represents vegetative function and being bedridden.
The Movement Disorders Society Unified Parkinson Disease Rating Scale (MDS-UPDRS) (parts I-III) total score is a composite score comprising patient- and clinician-reported outcomes focused on movement but addressing nonmotor functions as well, with higher scores reflecting greater disability (range, 0-236 points).
The Montreal Cognitive Assessment is a rapid screening instrument that assesses short-term and working memory, visual-spatial abilities, executive function, attention, concentration, language, and orientation. The total score ranges from 0 (lowest function) to 30 (highest function).
The Quality of Life in Neurological Disorders assessment (Neuro-QoL) is a set of patient-reported outcome measures that assess health-related quality of life of people with neurological disorders. The short form of its depression domain comprises 8 questions with a summed response score ranging from 8 to 40, corresponding to no to maximum depression symptoms.
All data reported in this table are from the baseline assessment and were an unchanging characteristic except for the following: (1) Neuro-QoL depression score was assessed at screening visit 2; (2) DaT scan striatal specific binding ratio was assessed at the time of DaTscan or up to 6 months prior to screening visit 1; (3) serum urate is the mean of assessments at screening visit 1, screening visit 2, and baseline visit; and (4) estimated glomerular filtration rate is the mean of assessments at screening visit 2 and baseline visit.
Serum urate values reflect the inclusion criterion of initial screening value below the de novo Parkinson disease population median of 5.8 mg/dL and are consistent with the study laboratory’s sex-specific reference ranges of 2.7 to 6.8 mg/dL for women and 3.9 to 9.0 mg/dL for men.
Urinary urate excretion rate reference range of the study laboratory is 250 to 750 mg per 24 hours.
Calculated as weight in kilograms divided by height in meters squared.
The estimated glomerular filtration rate was consistent with the exclusionary criterion of less than 60 mL/min/1.73 m2 and with the study laboratory’s sex-specific reference ranges in a 60- to 69-year-old White subpopulation of 51 to 120 mL/min/1.73 m2 for women and 56 to 130 mL/min/1.73 m2 for men.
This neuroimaging (positron emission tomography) biomarker is a quantitative measure of the DaT expressed on nerve terminals of dopaminergic nigrostriatal neurons, and their substantial degeneration by the time of diagnosis in Parkinson disease is reflected by a low striatal specific binding ratio value.
Primary Outcome
In the primary outcome analysis, the rate of clinical progression in early PD as measured by rate of change in MDS-UPDRS parts I-III prior to initiation of dopaminergic medication did not significantly differ between participants randomized to inosine vs placebo (11.1 vs 9.9 points per year, respectively; slope difference, 1.26 [95% CI, −0.59 to 3.11] points per year; P = .18) (Table 2). Early study completion, while shortening period 1 from the originally planned 24 months to 18.9 months, had little effect on the primary analysis because 85% of participants had already initiated dopaminergic therapy prior to their accelerated closeout and therefore were no longer contributing data to the primary analysis, and greater than 90% of the possible information for estimating rate of change in the primary outcome was already incorporated.
Table 2. Primary and Selected Secondary and Safety Outcomes for Target Engagement, Efficacy, and Physiologya.
| Outcomes | Model estimated rate of change or absolute change | |||
|---|---|---|---|---|
| Estimate (95% CI) | Treatment difference | |||
| Inosine (n = 149) | Placebo (n = 149) | Estimate (95% CI) | P value | |
| Primary outcome | ||||
| MDS-UPDRS (parts I-III) total score (until dopaminergic medication), rate of change per yearb,c | 11.1 (9.7 to 12.6) | 9.9 (8.4 to 11.3) | 1.26 (−0.59 to 3.11) | .18 |
| Systemic target changes | ||||
| Serum urate, absolute change from baseline to post–week 6 visit, mg/dLd | 2.03 (1.90 to 2.15) | 0.01 (−0.11 to 0.13) | 2.02 (1.85 to 2.19) | <.001 |
| Urine urate output, absolute change from baseline to month 12 visit, mg/dd | 505 (441 to 568) | −8.7 (−69.9 to 52.5) | 514 (426 to 601) | <.001 |
| Secondary outcomes: clinical efficacy | ||||
| MDS-UPDRS (parts I-III) score (until dopaminergic medication), rate of change per year | ||||
| I (nonmotor experiences of daily living)b | 1.33 (0.83 to 1.82) | 0.83 (0.33 to 1.33) | 0.50 (−0.19 to 1.18) | .16 |
| II (motor experiences of daily living)b | 2.69 (2.17 to 3.20) | 2.59 (2.08 to 3.10) | 0.10 (−0.61 to 0.81) | .79 |
| Ib-II (patient-reported outcome)b | 3.41 (2.70 to 4.12) | 2.95 (2.25 to 3.66) | 0.46 (−0.54 to 1.45) | .37 |
| III (motor examination)e | 6.92 (5.86 to 7.98) | 6.40 (5.34 to 7.47) | 0.51 (−0.76 to 1.79) | .43 |
| Ambulatory capacityb | 0.45 (0.30 to 0.61) | 0.52 (0.36 to 0.67) | −0.06 (−0.28 to 0.15) | .56 |
| Fatigueb | 0.17 (0.07 to 0.27) | 0.13 (0.03 to 0.23) | 0.04 (−0.10 to 0.18) | .59 |
| Apathyb | 0.15 (0.06 to 0.24) | 0.15 (0.06 to 0.24) | 0.00 (−0.12 to 0.12) | .98 |
| Modified S&E ADL Scale score, rate of change per yeare,f | −0.83 (−1.54 to −0.13) | −0.88 (−1.55 to −0.21) | 0.05 (−0.76 to 0.86) | .91 |
| 39-Item Parkinson Disease Questionnaire score, rate of change per yearb,c | ||||
| Quality-of-life summary index | 0.69 (0.09 to 1.28) | 0.76 (0.20 to 1.31) | −0.07 (−0.83 to 0.69) | .86 |
| Activities of daily living | 1.71 (0.37 to 3.05) | 2.33 (1.04 to 3.61) | −0.62 (−2.25 to 1.01) | .45 |
| Cognition | 0.71 (−0.14 to 1.55) | 0.87 (0.08 to 1.66) | −0.16 (−1.28 to 0.96) | .78 |
| Neuro-QoL score, rate of change, raw points per year | ||||
| Anxietyc,g | −0.40 (−0.76 to −0.04) | −0.47 (−0.82 to −0.13) | 0.08 (−0.37 to 0.52) | .74 |
| Communicationf,h | 0.05 (−0.11 to 0.22) | −0.20 (−0.35 to −0.05) | 0.26 (0.04 to 0.47) | .02 |
| Depressionc,g | −0.02 (−0.23 to 0.19) | 0.08 (−0.11 to 0.28) | −0.11 (−0.38 to 0.17) | .45 |
| Emotional/behavioral dyscontrolc,g | −0.23 (−0.50 to 0.05) | −0.32 (−0.59 to −0.06) | 0.09 (−0.25 to 0.43) | .58 |
| Lower extremity functionf,h | −0.09 (−0.29 to 0.10) | −0.26 (−0.45 to −0.07) | 0.17 (−0.10 to 0.44) | .21 |
| Upper extremity functionf,h | −0.03 (−0.24 to 0.19) | −0.24 (−0.45 to −0.03) | 0.21 (−0.06 to 0.49) | .13 |
| REM sleep behavior disorder frequency, rate of change, points per yearc,i | 0.15 (0.05 to 0.25) | 0.02 (−0.07 to 0.11) | 0.13 (0.01 to 0.25) | .03 |
| Montreal Cognitive Assessment score, rate of change per yeare,f | 0.19 (−0.01 to 0.38) | 0.23 (0.04 to 0.41) | −0.04 (−0.29 to 0.21) | .76 |
| Secondary outcome: biomarker efficacy | ||||
| DaTscan striatal specific binding ratio, rate of change per yearf,h | −0.14 (−0.17 to −0.11) | −0.15 (−0.18 to −0.12) | 0.01 (−0.03 to 0.04) | .61 |
| Secondary and safety outcomes: physiologic and laboratory | ||||
| Body mass index, rate of change per yearb,j | −0.17 (−0.32 to −0.01) | −0.09 (−0.24 to 0.06) | −0.07 (−0.28 to 0.14) | .50 |
| Blood pressure (supine), rate of change per year, mm Hgb | ||||
| Systolic | 0.24 (−1.26 to 1.75) | 0.20 (−1.24 to 1.64) | 0.04 (−1.62 to 1.70) | .96 |
| Diastolic | 0.35 (−0.67 to 1.37) | −0.18 (−1.16 to 0.81) | 0.52 (−0.53 to 1.58) | .33 |
| Orthostatic change in systolic blood pressure, rate of change per year, mm Hge | −1.21 (−2.57 to 0.16) | 0.20 (−1.11 to 1.51) | −1.41 (−2.93 to 0.12) | .07 |
| Electrocardiographic QTcF, rate of change per year, msb | −1.66 (−3.38 to 0.06) | −0.67 (−2.31 to 0.96) | −0.98 (−3.29 to 1.32) | .40 |
| Estimated glomerular filtration rate, absolute change from baseline to post–week 6 visit, mL/min/1.73 m2k | −5.11 (−6.22 to −4.00) | −1.40 (−2.47 to −0.33) | −3.71 (−5.23 to −2.19) | <.001 |
| Glucose, absolute change from baseline to post–week 6 visit, mg/dLk | 1.44 (−0.28 to 3.16) | 1.31 (−0.34 to 2.96) | 0.13 (−2.18 to 2.45) | .91 |
| Total cholesterol, absolute change from baseline to post–week 6 visit, mg/dLk | −0.09 (−3.36 to 3.18) | 0.45 (−2.69 to 3.59) | −0.54 (−4.82 to 3.74) | .80 |
| Low-density lipoprotein cholesterol, absolute change from baseline to post–week 6 visit, mg/dLk | 1.92 (−1.04 to 4.89) | 1.24 (−1.62 to 4.09) | 0.69 (−3.26 to 4.63) | .73 |
| Triglycerides, absolute change from baseline to post–week 6 visit, mg/dLk | −1.03 (−8.34 to 6.27) | 5.82 (−1.25 to 12.9) | −6.85 (−16.4 to 2.70) | .16 |
Abbreviations: DaT, dopamine transporter; MAOBI, monoamine oxidase B inhibitor; MDS-UPDRS, Movement Disorders Society Unified Parkinson Disease Rating Scale; Neuro-QoL, Quality of Life in Neurological Disorders assessment; QTcF, Fridericia formula–corrected QT interval; REM, rapid eye movement; S&E ADL, Schwab and England Activities of Daily Living.
SI conversions: To convert to millimoles per liter, multiply glucose by 0.0555, total cholesterol and low-density lipoprotein cholesterol by 0.0259, and triglycerides by 0.0113.
Secondary and exploratory outcomes reported herein cover all serially conducted clinical assessments and the subset of laboratory tests known to be associated with serum urate. Explanations of assessment scales are provided in footnotes to Table 1.
Random slopes, period 1, adjusted (sex, MAOBI, S&E ADL Scale, baseline value of the outcome being analyzed); positive values represent worsening.
A lower score on this scale or measure corresponds to a better outcome.
Repeated measures, period 1, adjusted (sex, baseline value of the outcome being analyzed).
Random slopes, period 1, adjusted (sex, MAOBI, S&E ADL Scale, baseline value of the outcome being analyzed); negative values represent worsening.
A higher score on this scale or measure corresponds to a better outcome.
Random slopes, periods 1 + 2, adjusted (sex, MAOBI, S&E ADL Scale, baseline value of the outcome being analyzed); positive values represent worsening.
Random slopes, periods 1 + 2, adjusted (sex, MAOBI, S&E ADL Scale, baseline value of the outcome being analyzed); negative values represent worsening.
Random slopes, period 1, adjusted (sex, MAOBI, S&E ADL Scale, baseline value of the outcome being analyzed); positive values represent increasing frequency, assessed as points on a scale from 0 to 4; 0 = never, 1 = not once in the previous 3 months, 2 = 1 to 3 times in the previous 3 months, 3 = 1 to 2 times per week, and 4 = more than once a week. Inference confirmed by mixed-model ordinal logistic regression.
Calculated as weight in kilograms divided by height in meters squared.
Change from baseline (including screening) to visit 3–visit 10, as randomized, repeated measures, period 1, adjusted (sex, baseline value of the outcome being analyzed).
Secondary Outcomes
Among secondary analyses, urate elevation was a pharmacodynamic marker of target engagement by inosine. By design and through titration (see diagram on p 10 in the study protocol in Supplement 1), serum urate in the inosine group increased by 44% from a mean baseline of 4.6 mg/dL to targeted trough concentrations of 7.1 to 8.0 mg/dL within 3 months with a mean titrated inosine dosage of 1.8 g/d and remained at or near 7.0 mg/dL for up to 24 months (Figure 2A). Eighty-one percent of participants (121/149) receiving inosine achieved a measured trough serum urate of at least 7.1 mg/dL (vs 4.7% [7/149] in the placebo group). Despite a reduction of mean serum urate in the inosine group after early discontinuations of study drug (Figure 1), urate concentrations remained elevated in the as-randomized sample at more than 95%, on average, of that achieved among inosine group participants who continued study drug. Similarly, 24-hour urinary urate output increased only in the inosine treatment group and did so by 97% (Table 2).
Figure 2. Time Courses of Biochemical, Clinical, and Radiographic Outcomes in the SURE-PD3 Trial.
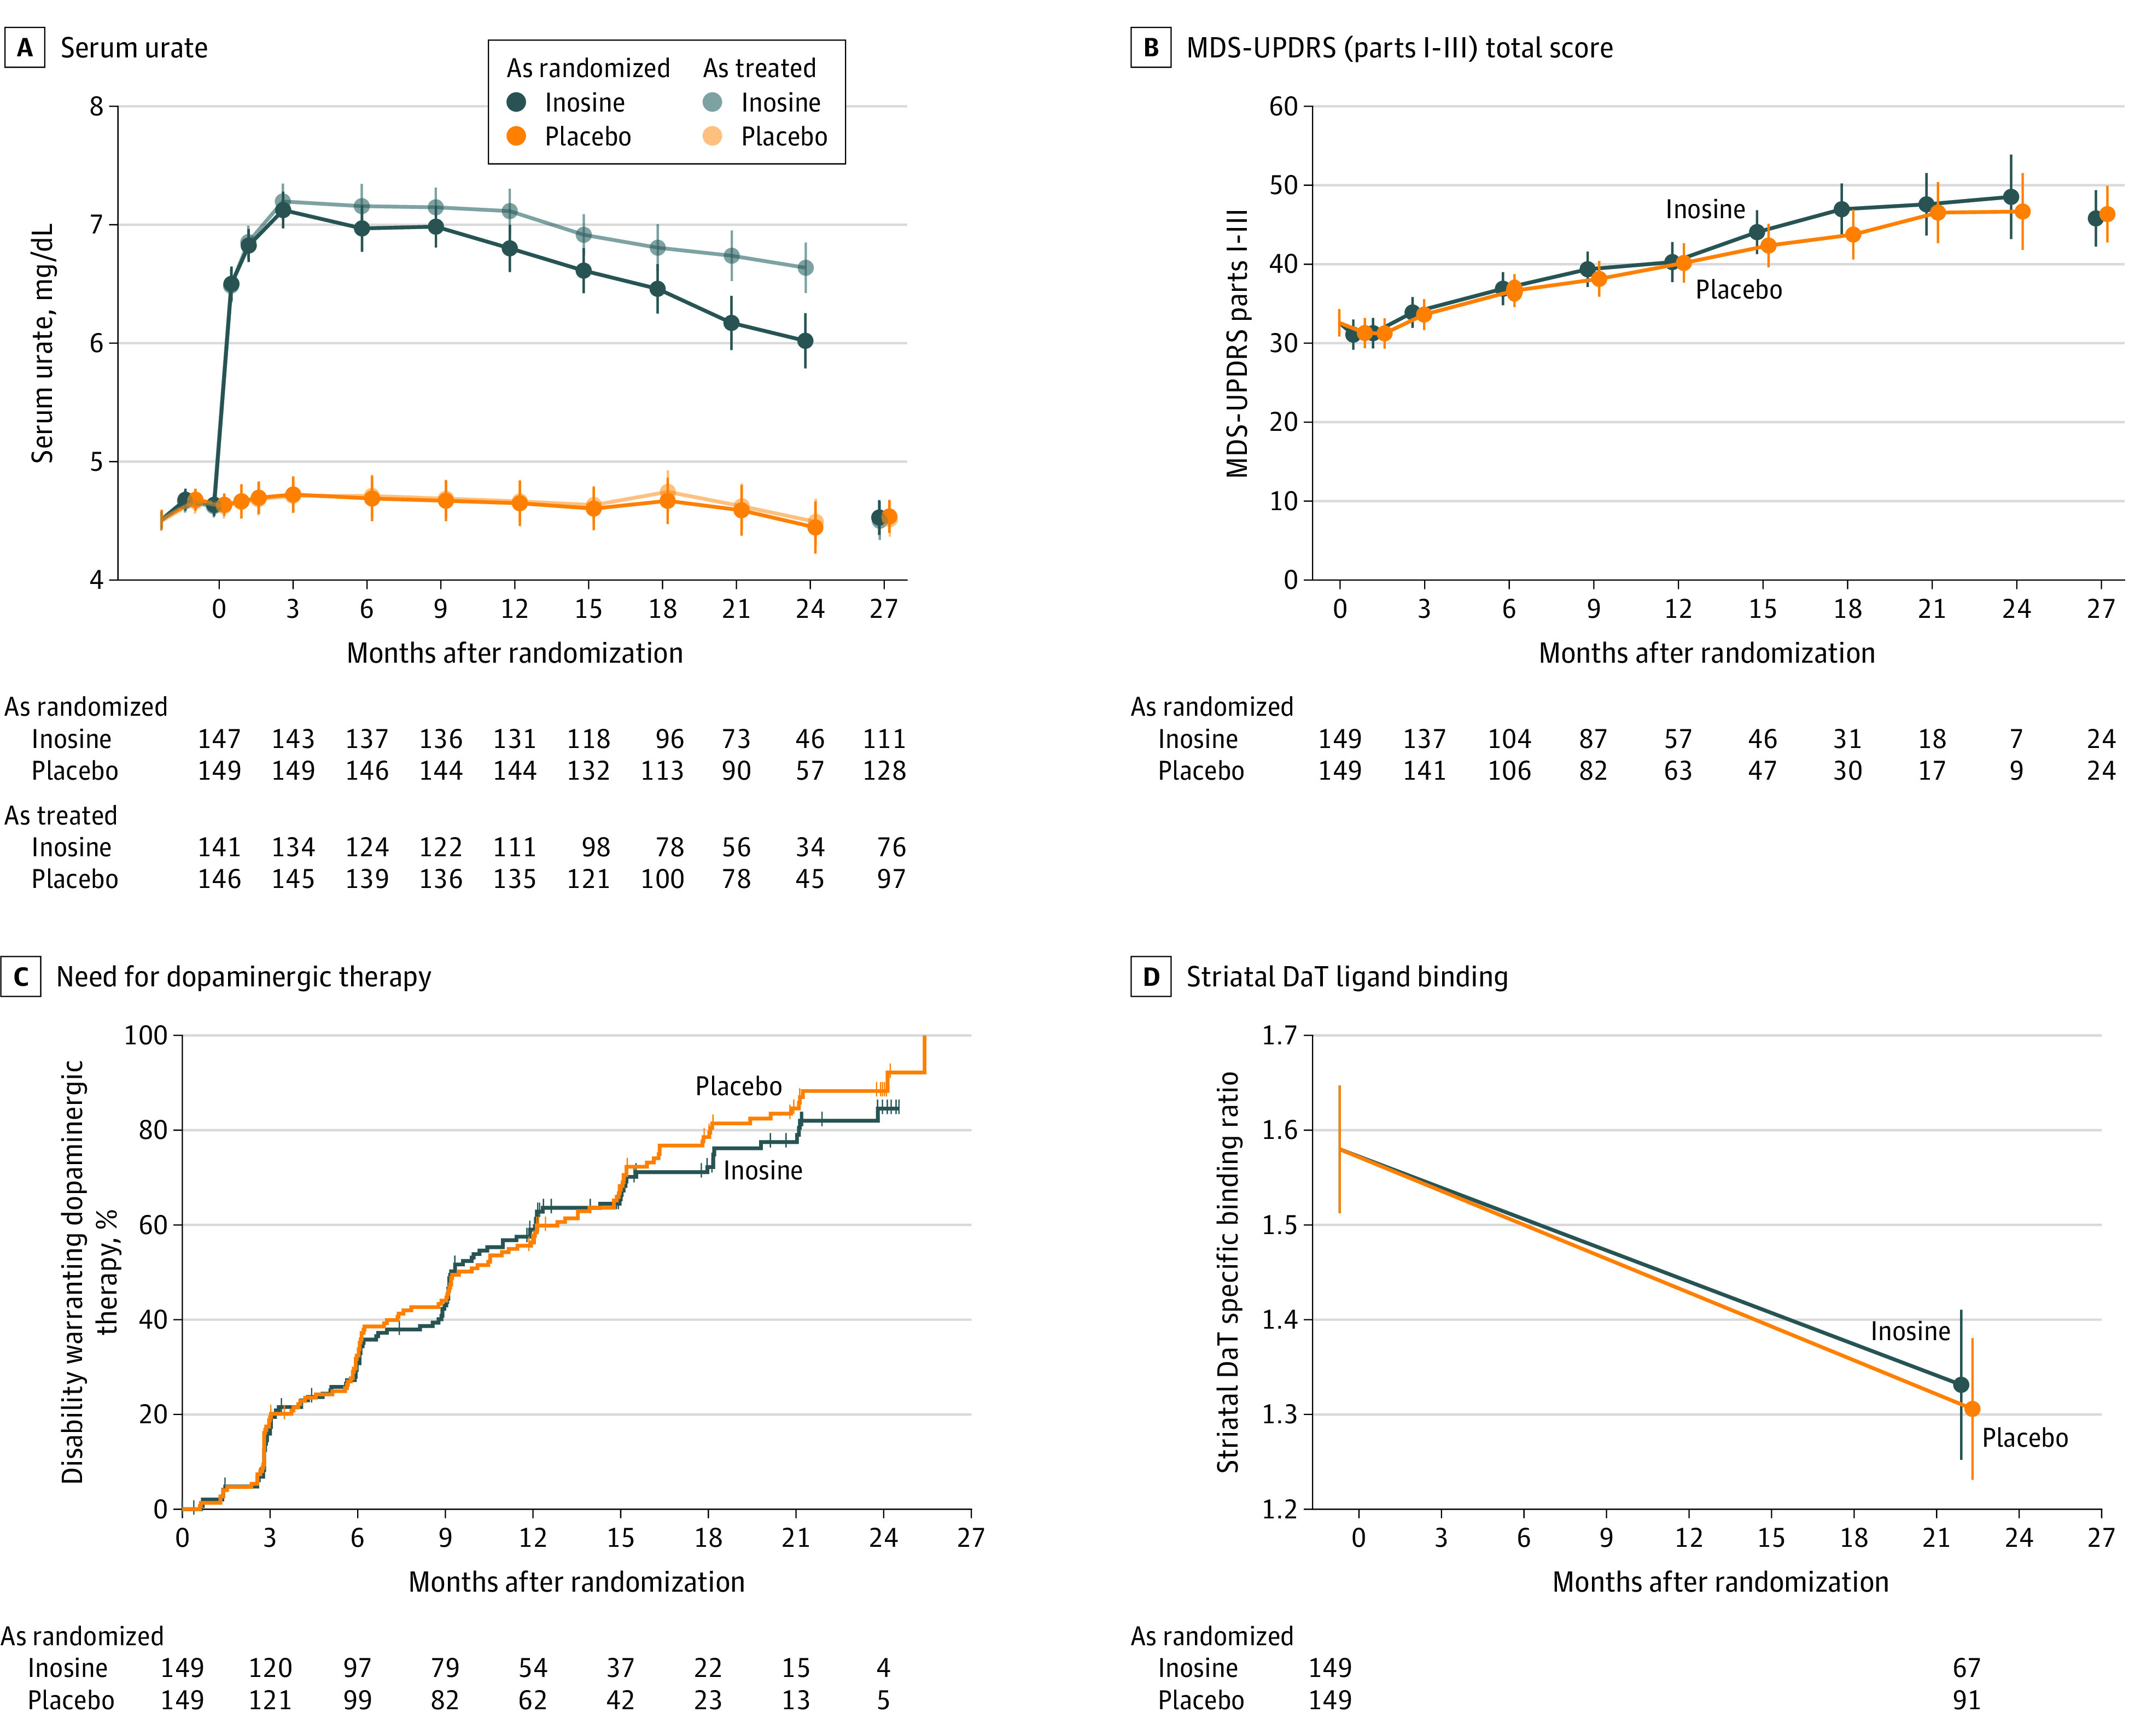
Serum urate (panel A), Movement Disorder Society Unified Parkinson Disease Rating Scale (MDS-UPDRS) (parts I-III) total score (the primary outcome, which comprises both clinician- and patient-reported outcomes and both motor and nonmotor features) (panel B), need for dopaminergic therapy (panel C), and radiographic striatal dopamine transporter (DaT) ligand binding (panel D) are compared between participants randomized to inosine vs placebo. Model estimates are plotted with 95% confidence intervals from analysis of the as-randomized sample or as-treated sample, stratified by treatment assignment to inosine or placebo. Estimates for serum urate (panel A) were adjusted for sex. Estimates in panels B and D are adjusted for sex, monoamine oxidase B inhibitor use at baseline, modified Schwab and England Activities of Daily Living Scale scores at baseline, and each respective outcome measure at baseline. The number of participants contributing to each data point is shown by treatment group under each graph in panels A, B, and D; the number at risk of need for dopaminergic therapy is shown in panel C. The safety visit, which followed study drug discontinuation by 3 months, was intended to occur at month 27, following 3-month washout, but could occur earlier (eg, in participants whose planned 24-month follow-up was shortened due to early termination of the study). Vertical tick marks on the curves of panel C indicate times when individual participants were censored for this time-to-event analysis. The indicated timing of the striatal DaT specific binding ratio estimate at 21 months reflects the mean time after baseline at which follow-up DaTscan imaging occurred, but all such imaging was performed at least 2 weeks into the 3-month washout. The y-axis scales in panels A and D focus on relatively narrow ranges to maximize comparison between groups.
Secondary analyses of clinical end points showed steady disease progression. The inosine and placebo groups were not significantly different in visit-specific increases in MDS-UPDRS (parts I-III) total score during treatment (mean change from baseline to 24 months, 15.9 points vs 14.1 points; difference, 1.85 [95% CI, −4.9 to 8.6] points; P = .59) (Figure 2B) or its patient-reported subscore (mean change from baseline to 24 months, 4.4 points vs 4.2 points; difference, 2.0 [95% CI, −3.2 to 3.6] points; P = .91) (eFigure 1 in Supplement 3) or after the 3-month study washout (mean change in MDS-UPDRS (parts I-III) total score from baseline to postwashout, 13.2 points vs 13.8 points; difference, −0.54 [95% CI, −4.8 to 3.7] points; P = .80; mean change in MDS-UPDRS patient-reported subscore from baseline to postwashout, 4.2 points vs 4.2 points; difference, −0.01 [95% CI, −2.2 to 2.2] points; P = .99).
The proportion of participants who developed disability warranting initiation of dopaminergic drug (symptomatic) therapy also increased at each time point and was not significantly different between groups (log-rank P = .50), with 59% (95% CI, 51%-67%) and 56% (95% CI, 49%-64%) needing dopaminergic drug therapy by 12 months in the inosine and placebo groups, respectively (Figure 2C). Worsening by these and other clinical measures of motor and nonmotor function and by composite quality-of-life scores did not significantly differ between those randomized to either treatment, except that rapid eye movement sleep behavior disorder appeared to worsen only with inosine in an exploratory analysis (mean slope during period 1, 0.15 points per year vs 0.02 points per year; difference, 0.13 [95% CI, 0.01-0.25] points per year; P = .03) (Table 2).
Follow-up dopamine transporter imaging was completed for 159 participants (53%) after discontinuation of study drug (a mean of 23 [SD, 4] months after baseline scan). The rate at which dopamine transporter binding in the striatum was lost did not significantly differ between inosine and placebo participants with serial imaging (Figure 2D and Table 2).
The as-treated analyses limited to data obtained while participants were taking study drug and thus maintaining higher urate levels in the inosine group (Figure 2A) did not show a significant between-group difference (eFigure 2 and eTable 3 in Supplement 3). Similarly, stratification by sex did not identify a sex-specific effect of inosine on any clinical outcome (eFigure 3 and eTable 4 in Supplement 3).
Adverse Events
For most measures, overall adverse events during treatment with urate-elevating inosine appeared comparable with that of placebo (Table 3). However, fewer participants randomized to inosine than to placebo experienced serious adverse events (12% vs 17%), and these adverse events occurred at a lower rate in the inosine group (7.4 per 100 patient-years) than in the placebo group (13.1 per 100 patient-years), with a rate difference of −5.8 per 100 patient-years (95% CI, −11 to −0.4 per 100 patient-years). This reflects the numerically lower rates of cardiovascular and gastrointestinal serious adverse events in the inosine group being only partially offset by its higher rates of kidney/nephrolithiasis serious adverse events (Table 3). Participants taking inosine developed kidney stones at a rate of 7.0 per 100 patient-years vs 1.4 per 100 patient-years in the placebo group (in 17 vs 4 patients, respectively; rate difference, 5.6 per 100 patient-years [95% CI, 2.0-9.1 per 100 patient-years]; P = .003). Uric acid stone prophylaxis by urine alkalinization, typically with potassium citrate, was initiated based on blinded monitoring for acidic urine and uric acid crystalluria in 71 participants (24%), in similar proportions in the inosine group (25% [n = 37]) and the placebo group (23% [n = 34]).
Table 3. Adverse Events and Additional Safety Parametersa.
| Inosine (n = 147) | Placebo (n = 149) | Rate ratio (95% CI) | Rate difference per 100 patient-years (95% CI) | |||
|---|---|---|---|---|---|---|
| Events, No. | Participants, No. (%) | Events, No. | Participants, No. (%) | |||
| Any serious adverse eventb | 19 | 17 (11.6) | 37 | 25 (16.8) | 0.56 (0.32-0.98) | −5.76 (−11.2 to −0.36) |
| Serious adverse events resulting in death | 1 | 1 (0.7) | 1 | 1 (0.7) | 1.09 (0.07-17.7) | 0.03 (−1.00 to 1.07) |
| Any adverse eventc | 839 | 133 (90.5) | 871 | 138 (92.6) | 1.05 (0.96-1.16) | 16.3 (−13.9 to 46.6) |
| Serious adverse events occurring in >2.5% of a treatment group | ||||||
| Kidney and urinary disorders (including nephrolithiasis and urinary retention) | 6 | 6 (4.1) | 1 | 1 (0.7) | 6.56 (0.78-55.0) | 1.97 (−0.02 to 3.97) |
| Nephrolithiasisd | 6 | 6 (4.1) | 0 | 0 (0.0) | ∞ (0.00-∞) | 2.33 (0.46 to 4.20) |
| Infections and infestations | 2 | 2 (1.4) | 5 | 4 (2.7) | 0.44 (0.08-2.27) | −1.00 (−2.90 to 0.90) |
| Gastrointestinal disorders (including abdominal pain, constipation, gastric ulcer, hiatal hernia, intestinal obstruction, and melena) | 1 | 1 (0.7) | 8 | 6 (4.0) | 0.14 (0.02-1.10) | −2.45 (−4.57 to −0.33) |
| Cardiac disorders (including atrial fibrillation, cardiomyopathy, and myocardial infarction) | 0 | 0 | 4 | 4 (2.7) | 0.00 (0.00-∞) | −1.42 (−2.82 to −0.23) |
| Adverse events occurring in >10% of a treatment group | ||||||
| Nausea | 25 | 22 (15.0) | 31 | 20 (13.4) | 0.88 (0.52-1.50) | −1.30 (−6.75 to 4.14) |
| Back pain | 19 | 18 (12.2) | 14 | 11 (7.4) | 1.48 (0.74-2.97) | 2.40 (−1.83 to 6.63) |
| Dizziness | 19 | 17 (11.6) | 22 | 16 (10.7) | 0.94 (0.51-1.75) | −0.44 (−5.11 to 4.23) |
| Urinary tract infection | 25 | 17 (11.6) | 17 | 10 (6.7) | 1.61 (0.87-2.98) | 3.66 (−1.12 to 8.44) |
| Nephrolithiasisd | ||||||
| Any adverse event | 18 | 17 (11.6) | 4 | 4 (2.7) | 4.92 (1.66-14.6) | 5.56 (2.04 to 9.09) |
| Only nonserious adverse events | 12 | 12 (8.2) | 4 | 4 (2.7) | 3.28 (1.05-10.2) | 3.24 (0.24 to 6.23) |
| Pain in extremity | 9 | 9 (6.1) | 25 | 21 (14.1) | 0.39 (0.18-0.85) | −5.38 (−9.56 to −1.21) |
| Constipation | 8 | 8 (5.4) | 17 | 16 (10.7) | 0.51 (0.22-1.20) | −2.93 (−6.53 to 0.67) |
| Upper respiratory tract infection | 9 | 7 (4.8) | 18 | 15 (10.1) | 0.55 (0.25-1.22) | −2.90 (−6.64 to 0.85) |
| Altered vital signs or safety laboratory measures | ||||||
| Body mass index increased >2% to >25e | 77 | 41 (27.9) | 91 | 44 (29.5) | 0.93 (0.68-1.25) | −2.43 (−11.9 to 7.02) |
| Systolic blood pressure | ||||||
| Increased >10% to >140 mm Hg | 37 | 29 (19.7) | 45 | 27 (18.1) | 0.90 (0.58-1.39) | −1.62 (−8.21 to 4.98) |
| Decreased >10% to <100 mm Hg | 5 | 5 (3.4) | 6 | 5 (3.4) | 0.91 (0.28-3.00) | −0.19 (−2.61 to 2.23) |
| Orthostatic systolic blood pressure decreased >20 mm Hg to >20 mm Hgf | 21 | 15 (10.2) | 14 | 13 (8.7) | 1.64 (0.83-3.23) | 3.18 (−1.19 to 7.54) |
| Orthostatic systolic/diastolic blood pressure decrease >20/10 mm Hg | 40 | 26 (17.7) | 40 | 32 (21.5) | 1.09 (0.70-1.70) | 1.32 (−5.22 to 7.86) |
| Estimated glomerular filtration rate decreased >10% to <60 mL/min/1.73 m2 | 116 | 42 (28.6) | 39 | 22 (14.8) | 3.25 (2.26-4.68) | 31.2 (21.8 to 40.5) |
| Glucose increased >10% to >140 mg/dL | 40 | 20 (13.6) | 54 | 25 (16.8) | 0.81 (0.54-1.22) | −3.65 (−10.7 to 3.40) |
| Total cholesterol increased >10% to >240 mg/dL | 14 | 14 (9.5) | 10 | 10 (6.7) | 1.53 (0.68-3.46) | 1.88 (−1.73 to 5.49) |
| Low-density lipoprotein cholesterol increased >10% to >160 mg/dL | 11 | 10 (6.8) | 9 | 8 (5.4) | 1.34 (0.55-3.24) | 1.07 (−2.21 to 4.36) |
| Triglycerides increased >10% to >190 mg/dL | 18 | 15 (10.2) | 19 | 16 (10.7) | 1.04 (0.54-1.98) | 0.24 (−4.21 to 4.68) |
| Urine crystals | ||||||
| Amorphous | 183 | 97 (66.0) | 76 | 55 (36.9) | 2.63 (2.01-3.44) | 44.0 (32.0 to 56.0) |
| Calcium oxalate | 138 | 64 (43.5) | 282 | 94 (63.1) | 0.54 (0.44-0.66) | −46.5 (−61.3 to −31.8) |
| Uric acid | 63 | 39 (26.5) | 4 | 3 (2.0) | 17.2 (6.24-47.5) | 23.0 (16.8 to 29.2) |
SI conversions: See Table 2 footnote for SI conversions.
Adverse events and additional safety parameters presented herein are limited to those that were treatment emergent (ie, occurring after initiation of study drug).
A serious adverse event was defined as any adverse event or experience that resulted in any of the following outcomes: death, a life-threatening event or experience, an inpatient hospitalization or prolongation of existing hospitalization, a persistent or significant disability or incapacity, or a congenital anomaly or birth defect.
Adverse events include serious adverse events.
Based on safety concerns about a higher-than-expected rate of nephrolithiasis adverse events with greatest incidence in participants taking study drug dosages >2.0 g/d, the maximum dosage was reduced from 3.0 g/d to 2.0 g/d beginning January 24, 2018. These adverse events occurred despite crystallopathy risk reduction measures (see Section 8.4.1 and Figure 12 of the study protocol in Supplement 1). Kidney stone and gout prophylaxis also included universal hydration recommendations with reinforcement prompted by alerts for high urine-specific gravity. The incidence rate for gout with inosine (0.8 adverse events per 100 patient-years) was nonsignificantly lower than with placebo (0.8 adverse events per 100 patient-years; P = .73).
Calculated as weight in kilograms divided by height in meters squared.
Orthostatic systolic blood pressure change on standing became more negative between the baseline visit and a follow-up visit by >20 mm Hg, and the orthostatic systolic blood pressure decrease was >20 mm Hg at the follow-up visit.
Among the 21 participants who developed nephrolithiasis, 5 had their kidney stone composition determined. Four (all in the inosine group) had a uric acid component confirmed, and these participants had a significantly greater increase in serum urate prior to the kidney stone adverse event compared with others in the inosine group (by 3.4 vs 2.4 mg/dL; P = .02). There was increased likelihood in the inosine group of amorphous and uric acid crystals in the urine and a decreased risk of calcium oxalate crystalluria (Table 3). Relative to placebo, eGFR was significantly reduced (by 3.7 [95% CI, 2.2-5.2] mL/min/1.73 m2; P < .001) in participants in the inosine group (Table 2), who were also more likely to experience a clinically significant eGFR reduction (Table 3). The eGFR reduction was reversible, with a difference after washout of 1.3 mL/min/1.73 m2 (95% CI, −1.0 to 3.6 mL/min/1.73 m2; P = .26) between the inosine and placebo groups. In sensitivity analyses adjusting for presence of concurrent crystalluria, estimated treatment-dependent reduction in eGFR was unchanged (3.6-3.7 mL/min/1.73 m2). Body mass index, blood pressure, and glucose and lipid levels did not significantly change with inosine treatment (Table 2 and Table 3).
Inosine was tolerable over the first several months, but its tolerability declined over time. In the inosine group, 93% (95% CI, 88%-96%) were tolerant at 12 weeks and 76% (95% CI, 68%-82%) at 12 months. In the placebo group, 99% (95% CI, 95%-100%) and 91% (95% CI, 85%-95%) were tolerant at 12 weeks and 12 months, respectively (eTable 5 in Supplement 3).
Assessment of Blinding
Blinding to treatment assignment was effective at 6 weeks, when participants were nearly equally likely to correctly and incorrectly guess their assigned group (50.9% [147/289] and 49.1% [142/289], respectively), as were coordinators (47.9% [140/292] and 52.1% [152/292], respectively) and investigators (50.3% [146/290] and 49.7% [144/290], respectively). However, by the end of the study, more participants (57% [95% CI, 50%-63%]; P = .04 [151/265]) guessed their treatment assignment correctly than incorrectly, with that difference only partially attributable to kidney stones developing primarily in the inosine group (eTable 6 in Supplement 3). A single participant indicated unblinding herself and her investigator based on having obtained a serum urate measurement outside the study; that participant discontinued study participation at that time.
Discussion
This trial showed that clinical progression of early PD, as assessed by the rate of change in the MDS-UPDRS (parts I-III) total score prior to dopaminergic medication initiation, was not slowed by long-term treatment with oral inosine dosed to elevate serum urate into a range associated with slower clinical decline in previous studies. Similarly, no significant benefit of inosine was seen on any secondary clinical measure of PD or on a dopamine transporter imaging biomarker of nigrostriatal dopaminergic neuron loss over 2 years.
Several features distinguish this clinical trial from prior, similarly negative disease modification trials.17 To our knowledge, this trial is the first placebo-controlled, randomized clinical trial to limit enrollment to patients with a striatal dopamine transporter deficit demonstrated by brain imaging, substantiating recent regulatory endorsement of this strategy to increase diagnostic confidence.18,19 Enriching for dopamine transporter deficiency can be particularly valuable for trials seeking to enroll untreated patients with PD within a year of diagnosis, when at least 10% of PD diagnoses are a misdiagnosis, even by movement disorders specialists.19 This study’s use of this diagnostic biomarker, which excluded 9% of otherwise eligible patients, allowed testing of the primary hypothesis with approximately 20% less participants (see pp 34-36 in the study protocol in Supplement 1).
The study population was enriched not only for neurodegenerative parkinsonism but also for a subpopulation that was more likely to benefit from the putatively protective intervention. By enrolling only participants with serum urate concentrations below the population median, the study targeted a subset of patients with PD for whom urate-elevating treatment was expected to offer greater benefit. Patients with early PD with lower urate levels decline more rapidly, both clinically and by dopamine transporter imaging.9,10,11
Another key feature of the trial was its demonstration that the intended molecular target of oral inosine, urate elevation, was engaged. Inosine increased serum urate levels to 7-8 mg/dL (with parallel cerebrospinal fluid urate elevation expected based on the phase 2 trial13), concentrations linked to slower disease progression.9,10,11 In contrast to prior negative PD trials of putative neuroprotectants, in which dosing was based on preclinical studies or maximum tolerated dose, in this study dosing of the active study drug (inosine) was based on and achieved sustained engagement of the intended target (urate), allowing for a clearer interpretation of the lack of hypothesized benefit.
The results of this trial do not support a protective effect of urate as the basis of the reproducible epidemiological link between higher urate and reduced risk and progression of PD,2,6,7,8,9,10,11 despite preclinical evidence in cellular and animal models of PD. Recent mendelian randomization studies also argue against a protective effect of higher urate on PD risk,20,21 although 1 such study supported a protective effect on progression in manifest PD.22
While urate-elevating inosine treatment did not provide a demonstrable benefit, it did significantly increase the rate of kidney stone adverse events. Consistent with increased urinary urate excretion in the inosine group, most captured kidney stones contained uric acid crystals. Thirty-three percent of the kidney stone adverse events were classified as serious, and all occurred despite intensive protocol-driven efforts to prevent kidney stones, such as excluding participants with a history of kidney stones, increasing hydration, and alkalinizing acidic urine.
Limitations
This study has several limitations. First, the lack of evidence for benefit of inosine treatment on PD progression for 1 to 2 years shortly after diagnosis, when most dopaminergic neurons may have already degenerated, does not exclude a beneficial effect of urate in PD with earlier (prediagnostic) or longer (years to decades) exposure.
Second, because the urate precursor inosine rather than urate was administered, it may have produced urate-independent deleterious effects offsetting benefits of urate elevation. For example, enhanced enzymatic synthesis of urate via xanthine oxidase generates reactive oxygen species as a byproduct. However, the conversion of oral inosine to urate takes place almost entirely peripherally such that the increased central nervous system urate concentrations generated by oral inosine13 are unlikely accompanied by increased purine metabolism locally. Oral inosine raises venous serum urate concentrations rapidly (within 60 minutes and with a maximum at approximately 3 hours) without a detectable increase in serum inosine.23
Third, the lack of demonstrated efficacy also does not exclude the possibility of benefit in a small subpopulation of patients with PD. The possibility of subpopulations possessing alternative genetic variants that have offsetting interactions with urate on PD progression has been suggested for INPPK5.24 Whole genome sequencing of the cohort in this trial is currently underway.25 Prior evidence of benefit of inosine among women but not men in the phase 2 trial26 was not replicated in this larger phase 3 trial.
Conclusions
Among patients recently diagnosed as having PD, treatment with inosine, compared with placebo, did not result in a significant difference in the rate of clinical disease progression. The findings do not support the use of inosine as a treatment for early PD.
Trial Protocol
Statistical Analysis Plan
eFigure 1. Time Course of MDS-UPDRS Patient-Reported Outcomes
eFigure 2. Time Courses of Key Biochemical, Clinical and Radiographic Outcomes Analyzed in an As-Treated Sample
eFigure 3. Time Courses of Key Biochemical, Clinical and Radiographic Outcomes Analyzed in an As-Randomized Sample, Stratified by Sex
eTable 1. Efficacy Outcome Scale Features
eTable 2. Baseline Characteristics by Treatment Arm, Extended Listing
eTable 3. Primary and Selected Secondary and Safety Outcomes for Target Engagement, Efficacy, and Physiology, As-Treated
eTable 4. Primary and Selected Secondary and Safety Outcomes for Target Engagement, Efficacy, and Physiology, Full Analysis Sample, Stratified by Sex
eTable 5. Tolerability, Short- and Long-term
eTable 6. Blinding, Short- and Long-term
Nonauthor Collaborators. Parkinson Study Group SURE-PD3 Investigator Collaborators
Data Sharing Statement
References
- 1.Wu XW, Muzny DM, Lee CC, Caskey CT. Two independent mutational events in the loss of urate oxidase during hominoid evolution. J Mol Evol. 1992;34(1):78-84. doi: 10.1007/BF00163854 [DOI] [PubMed] [Google Scholar]
- 2.Crotty GF, Ascherio A, Schwarzschild MA. Targeting urate to reduce oxidative stress in Parkinson disease. Exp Neurol. 2017;298(pt B):210-224. [DOI] [PMC free article] [PubMed] [Google Scholar]
- 3.Benzie IFSJ, Strain JJ. The ferric reducing ability of plasma (FRAP) as a measure of “antioxidant power”: the FRAP assay. Anal Biochem. 1996;239(1):70-76. doi: 10.1006/abio.1996.0292 [DOI] [PubMed] [Google Scholar]
- 4.Guerreiro S, Ponceau A, Toulorge D, et al. Protection of midbrain dopaminergic neurons by the end-product of purine metabolism uric acid: potentiation by low-level depolarization. J Neurochem. 2009;109(4):1118-1128. doi: 10.1111/j.1471-4159.2009.06040.x [DOI] [PubMed] [Google Scholar]
- 5.Chen X, Burdett TC, Desjardins CA, et al. Disrupted and transgenic urate oxidase alter urate and dopaminergic neurodegeneration. Proc Natl Acad Sci U S A. 2013;110(1):300-305. doi: 10.1073/pnas.1217296110 [DOI] [PMC free article] [PubMed] [Google Scholar]
- 6.Davis JWGA, Grandinetti A, Waslien CI, Ross GW, White LR, Morens DM. Observations on serum uric acid levels and the risk of idiopathic Parkinson’s disease. Am J Epidemiol. 1996;144(5):480-484. doi: 10.1093/oxfordjournals.aje.a008954 [DOI] [PubMed] [Google Scholar]
- 7.de Lau LMKP, Koudstaal PJ, Hofman A, Breteler MM. Serum uric acid levels and the risk of Parkinson disease. Ann Neurol. 2005;58(5):797-800. doi: 10.1002/ana.20663 [DOI] [PubMed] [Google Scholar]
- 8.Weisskopf MG, O’Reilly E, Chen H, Schwarzschild MA, Ascherio A. Plasma urate and risk of Parkinson’s disease. Am J Epidemiol. 2007;166(5):561-567. doi: 10.1093/aje/kwm127 [DOI] [PMC free article] [PubMed] [Google Scholar]
- 9.Schwarzschild MASS, Schwid SR, Marek K, et al. ; Parkinson Study Group PRECEPT Investigators . Serum urate as a predictor of clinical and radiographic progression in Parkinson disease. Arch Neurol. 2008;65(6):716-723. doi: 10.1001/archneur.2008.65.6.nct70003 [DOI] [PMC free article] [PubMed] [Google Scholar]
- 10.Ascherio A, LeWitt PA, Xu K, et al. ; Parkinson Study Group DATATOP Investigators . Urate as a predictor of the rate of clinical decline in Parkinson disease. Arch Neurol. 2009;66(12):1460-1468. doi: 10.1001/archneurol.2009.247 [DOI] [PMC free article] [PubMed] [Google Scholar]
- 11.Moccia M, Picillo M, Erro R, et al. Presence and progression of non-motor symptoms in relation to uric acid in de novo Parkinson’s disease. Eur J Neurol. 2015;22(1):93-98. doi: 10.1111/ene.12533 [DOI] [PubMed] [Google Scholar]
- 12.Sleeman I, Lawson RA, Yarnall AJ, et al. Urate and homocysteine: predicting motor and cognitive changes in newly diagnosed Parkinson’s disease. J Parkinsons Dis. 2019;9(2):351-359. doi: 10.3233/JPD-181535 [DOI] [PMC free article] [PubMed] [Google Scholar]
- 13.Schwarzschild MA, Ascherio A, Beal MF, et al. ; Parkinson Study Group SURE-PD Investigators . Inosine to increase serum and cerebrospinal fluid urate in Parkinson disease: a randomized clinical trial. JAMA Neurol. 2014;71(2):141-150. doi: 10.1001/jamaneurol.2013.5528 [DOI] [PMC free article] [PubMed] [Google Scholar]
- 14.Bhattacharyya S, Bakshi R, Logan R, Ascherio A, Macklin EA, Schwarzschild MA. Oral inosine persistently elevates plasma antioxidant capacity in Parkinson’s disease. Mov Disord. 2016;31(3):417-421. doi: 10.1002/mds.26483 [DOI] [PubMed] [Google Scholar]
- 15.Grinnon ST, Miller K, Marler JR, et al. National Institute of Neurological Disorders and Stroke Common Data Element Project—approach and methods. Clin Trials. 2012;9(3):322-329. doi: 10.1177/1740774512438980 [DOI] [PMC free article] [PubMed] [Google Scholar]
- 16.Hauser RA, Auinger P; Parkinson Study Group . Determination of minimal clinically important change in early and advanced Parkinson’s disease. Mov Disord. 2011;26(5):813-818. doi: 10.1002/mds.23638 [DOI] [PubMed] [Google Scholar]
- 17.Poewe W, Seppi K, Marini K, Mahlknecht P. New hopes for disease modification in Parkinson’s disease. Neuropharmacology. 2020;171:108085. doi: 10.1016/j.neuropharm.2020.108085 [DOI] [PubMed] [Google Scholar]
- 18.Romero K, Conrado D, Burton J, et al. ; Critical Path for Parkinson’s Consortium; Parkinson’s Progression Markers Initiative . Molecular neuroimaging of the dopamine transporter as a patient enrichment biomarker for clinical trials for early Parkinson’s disease. Clin Transl Sci. 2019;12(3):240-246. doi: 10.1111/cts.12619 [DOI] [PMC free article] [PubMed] [Google Scholar]
- 19.Stephenson D, Hill D, Cedarbaum JM, et al. ; Critical Path for Parkinson’s Consortium . The qualification of an enrichment biomarker for clinical trials targeting early stages of Parkinson’s disease. J Parkinsons Dis. 2019;9(4):825. doi: 10.3233/JPD-199003 [DOI] [PMC free article] [PubMed] [Google Scholar]
- 20.Kobylecki CJ, Nordestgaard BG, Afzal S. Plasma urate and risk of Parkinson’s disease: a mendelian randomization study. Ann Neurol. 2018;84(2):178-190. doi: 10.1002/ana.25292 [DOI] [PubMed] [Google Scholar]
- 21.Kia DA, Noyce AJ, White J, et al. ; IPDGC Collaborators . Mendelian randomization study shows no causal relationship between circulating urate levels and Parkinson’s disease. Ann Neurol. 2018;84(2):191-199. doi: 10.1002/ana.25294 [DOI] [PMC free article] [PubMed] [Google Scholar]
- 22.Simon KC, Eberly S, Gao X, et al. ; Parkinson Study Group . Mendelian randomization of serum urate and Parkinson disease progression. Ann Neurol. 2014;76(6):862-868. doi: 10.1002/ana.24281 [DOI] [PMC free article] [PubMed] [Google Scholar]
- 23.Yamamoto T, Moriwaki Y, Cheng J, et al. Effect of inosine on the plasma concentration of uridine and purine bases. Metabolism. 2002;51(4):438-442. doi: 10.1053/meta.2002.31322 [DOI] [PubMed] [Google Scholar]
- 24.Nazeri A, Roostaei T, Sadaghiani S, et al. Genome-wide variant by serum urate interaction in Parkinson’s disease. Ann Neurol. 2015;78(5):731-741. doi: 10.1002/ana.24504 [DOI] [PubMed] [Google Scholar]
- 25.Bandres-Ciga S, Saez-Atienzar S, Kim JJ, et al. ; American Genome Center; International Parkinson Disease Genomics Consortium . Large-scale pathway specific polygenic risk and transcriptomic community network analysis identifies novel functional pathways in Parkinson disease. Acta Neuropathol. 2020;140(3):341-358. doi: 10.1007/s00401-020-02181-3 [DOI] [PMC free article] [PubMed] [Google Scholar]
- 26.Schwarzschild MA, Macklin EA, Bakshi R, et al. ; Parkinson Study Group SURE-PD Investigators . Sex differences by design and outcome in the Safety of Urate Elevation in PD (SURE-PD) trial. Neurology. 2019;93(14):e1328-e1338. doi: 10.1212/WNL.0000000000008194 [DOI] [PMC free article] [PubMed] [Google Scholar]
Associated Data
This section collects any data citations, data availability statements, or supplementary materials included in this article.
Supplementary Materials
Trial Protocol
Statistical Analysis Plan
eFigure 1. Time Course of MDS-UPDRS Patient-Reported Outcomes
eFigure 2. Time Courses of Key Biochemical, Clinical and Radiographic Outcomes Analyzed in an As-Treated Sample
eFigure 3. Time Courses of Key Biochemical, Clinical and Radiographic Outcomes Analyzed in an As-Randomized Sample, Stratified by Sex
eTable 1. Efficacy Outcome Scale Features
eTable 2. Baseline Characteristics by Treatment Arm, Extended Listing
eTable 3. Primary and Selected Secondary and Safety Outcomes for Target Engagement, Efficacy, and Physiology, As-Treated
eTable 4. Primary and Selected Secondary and Safety Outcomes for Target Engagement, Efficacy, and Physiology, Full Analysis Sample, Stratified by Sex
eTable 5. Tolerability, Short- and Long-term
eTable 6. Blinding, Short- and Long-term
Nonauthor Collaborators. Parkinson Study Group SURE-PD3 Investigator Collaborators
Data Sharing Statement