FIGURE 5.

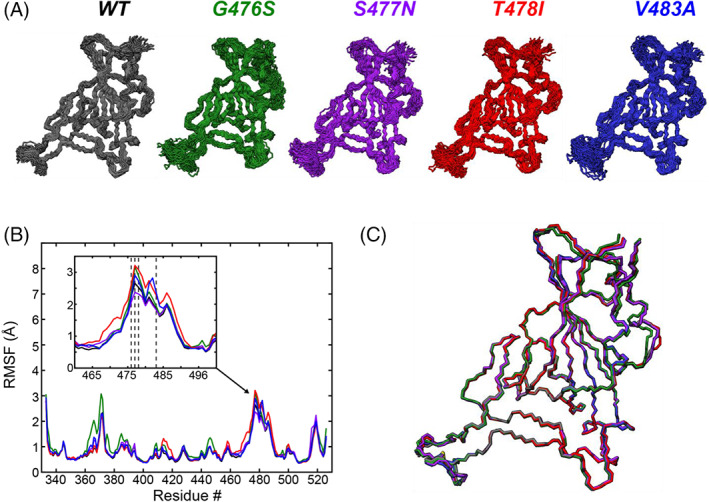
MD simulations of four mutants in the flexible Loop 3 region of the SARS‐CoV2 RBD binding interface. (A) Snapshots of conformations sampled during 2 μs MD simulations of mutants G476S (green), S477N (purple), T478I (red), and V483A (blue). The wild‐type snapshots (black) are the same as shown in Figure 3B, reproduced here for comparison with the mutants. (B) Per residue RMSF of all backbone (N, CA, and C) atoms from the five different models. The inset shows the Loop and Loop 3 regions. RBD mutations are clustered in this region (dashed lines: G476S, S477N, T478I, and V483A). (C) Average conformations of the five different models, showing the high similarity between all of the models. The colors of the data and models are kept consistent throughout the figure
