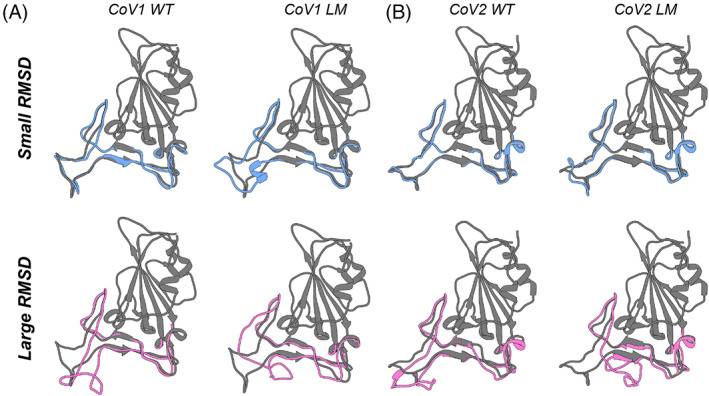
FIGURE 6.

Representative conformations from MD simulations that show the greatest similarity or difference from the starting crystal structure of CoV1‐RBD or CoV2‐RBD. (A) The conformations that are most similar (blue, small RMSD) or most different (pink, large RMSD) of the binding interface loops from the wild‐type (left) or loop‐modeled (right) CoV1‐RBD. The crystal structure (PDB: 2dd8) is shown in dark gray. (B) The conformations that are most similar (blue, small RMSD) or most different (pink, large RMSD) of the binding interface loops from the wild‐type (left) or loop‐modeled (right) CoV2‐RBD. The crystal structure (PDB: 6m0j) is shown in dark gray
