

Abstract
Aims
To describe (i) self‐reported changes in drug use and (ii) trends in price, perceived availability, and perceived purity of illicit drugs, among people who regularly use ecstasy/ 3,4‐methylenedioxymethamphetamine (MDMA) and other illicit stimulants in Australia following COVID‐19 and associated restrictions.
Design
Annual interviews with cross‐sectional sentinel samples conducted face‐to‐face in 2016–19 and via video conferencing or telephone in 2020. Data were collected via an interviewer‐administered structured questionnaire.
Setting
Australian capital cities.
Participants
Australians aged 16 years or older who used ecstasy/MDMA and other illicit stimulants on a monthly or more frequent basis and resided in a capital city, recruited via social media and word‐of‐mouth (n ~ 800 each year).
Measurements
Key outcome measures were self‐reported illicit drug market indicators (price, purity and availability) and, in 2020 only, perceived change in drug use (including alcohol and tobacco) since March 2020 and reasons for this change.
Findings
For most drugs, participants reported either no change or a reduction in their use since COVID‐19 restrictions were introduced. Ecstasy/MDMA was the drug most frequently cited as reduced in use (n = 552, 70% of those reporting recent use), mainly due to reduced opportunities for socialization. While market indicators were largely stable across most drugs, the odds of perceiving MDMA capsules as ‘high’ in purity decreased compared with 2016–19 [adjusted odds ratio (aOR) = 0.72, 95% confidence interval (CI) = 0.53–0.99], as did perceiving them as ‘easy’ to obtain (aOR = 0.42, CI = 0.26–0.67). The odds of perceiving cocaine and methamphetamine crystal as ‘easy’ to obtain also decreased (aOR = 0.67, CI = 0.46–0.96 and aOR = 0.12, CI = 0.04–0.41, respectively).
Conclusions
After COVID‐19‐related restrictions were introduced in Australia, use of ecstasy/MDMA, related stimulants and other licit and illicit drugs mainly appeared to remain stable or decrease, primarily due to impediments to socialization.
Keywords: Big events, COVID‐19, drug markets, harms, illicit drug, MDMA, pandemic
Introduction
An estimated 5.5% of the global population aged 15–64 years reported illicit drug use in the past year [1]. Long‐term trends in drug use, harms and market characteristics are relatively well‐understood through international (e.g. [1, 2]) and national (e.g. [3, 4]) surveillance systems. However, drug use and harms can significantly and rapidly change with market disruptions. Such disruptions can lead to reduced harms (e.g. [5]), but can also lead to increased mortality and morbidity, typically among those experiencing the greatest disadvantage [5, 6].
Studies of major historical events (so‐called ‘big events’ or ‘complex emergencies’) may be informative as to potential impacts [5, 7, 8]. For example, a major disruption to heroin supply in Australia in early 2001 (the so‐called heroin ‘shortage’) was characterized by significant declines in heroin purity and availability, increased purity‐adjusted price, reduced heroin use and harms and shifts to use of other substances (e.g. methamphetamine) [5]. However, the COVID‐19 pandemic and associated restrictions are unprecedented in the scale of economic, health, social and political upheaval, and thus the magnitude and types of impacts upon drug market, use and harms may differ. The COVID‐19 pandemic has probably had a significant impact on the way people supply, obtain and use illicit drugs through the effects of the disease itself, restrictions on movement and gathering, as well as social, economic and health sequelae [9]. These impacts may differ by substance and among different groups of people who use drugs. For example, restrictions on mass gatherings are more likely to impact use of substances commonly consumed in social settings [e.g. 3,4‐methylenedioxymethamphetamine (MDMA), cocaine] than in private settings (e.g. cannabis, heroin). There is also concern that changes in drug markets and contexts for use may see people turn to other drugs as a substitute or complement which, depending upon the shift, may reduce or increase risk of harm [9]. Indeed, provisional data from the Centers for Disease Control and Prevention (CDC) suggests an acceleration in drug overdose deaths in the United States since the pandemic onset [10], with increases in emergency department visits for opioid overdose also recorded [11].
The Ecstasy and Related Drugs Reporting System (EDRS) is an Australian drug surveillance system which has been running nationally since 2003. The EDRS includes annual interviews with sentinel samples of Australians who report recent monthly or more frequent use of ecstasy/MDMA and other stimulants. With data collection commencing in April (subsequent to the introduction of restrictions throughout Australia), the 2020 EDRS provided a unique opportunity to directly capture impacts of COVID‐19 and associated restrictions on people who regularly use illicit drugs, with consistent recruitment methods facilitating comparison to data collected in the preceding years.
We used annual cross‐sectional EDRS interview data from 2016 to describe the following among people who regularly use ecstasy/MDMA and other stimulants:
Changes in drug use (including alcohol and tobacco) and consumption practices since COVID‐19 as compared to the ‘pre‐restriction’ period (using data from April–July 2020); and
Changes in price, purity, and availability of illicit drugs since COVID‐19 compared to earlier years (using data collected since 2016).
Methods
Study design and procedure
Annual interviews are conducted in each Australian capital city with a cross‐sectional sentinel sample of people who use ecstasy/MDMA and other stimulants. Participants are predominantly recruited via social media and word‐of‐mouth. Participants need to be at least 18 years of age (17 years prior to 2020; 16 years in Western Australia prior to 2020); report ecstasy/MDMA and/or other illicit stimulant use at least monthly in the past 6 months; and have resided in the city of interview for the previous 12 months (target n = 100 per capital city per year). Until 2020, participants completed a face‐to‐face, interviewer‐administered survey of 45–60 minutes’ duration. In 2020, interviews were conducted via telephone or video conference due to COVID‐19 restrictions. Informed consent was obtained prior to interview and participants were reimbursed $AUD40 for their time.
Data are typically collected from April to June. In 2020, data collection commenced on 25 April and ceased on 31 July. For context, the first COVID‐19 diagnosis in Australia occurred in 26 January 2020, with a rapid increase in cases throughout March (peak daily cases = 460), declining subsequently until a resurgence from late June, predominantly in Melbourne [12]. By early March 2020, restrictions on gatherings were implemented across the country; by the end of March, Australians could only leave their residence for essential reasons and international borders were closed to non‐residents. Restrictions were reduced gradually from May to mid‐June, with some variation at jurisdiction‐level, although international border restrictions remained (Supporting information, Fig. S1). EDRS interviews took place a median of 55 days (range = 26–123) after the strictest restrictions were introduced nationally on 30 March 2020.
Ethical approval was granted by the University of New South Wales Human Research Ethics Committee (HREC) and jurisdictional HRECs. Findings are reported according to the STROBE checklist (Supporting information, Table S1); full methodological details can be found elsewhere [13].
Measures
Response options and post‐categorization of responses are detailed in Supporting information, Table S2.
Demographics and drug use characteristics
Participants in the 2016–20 samples reported age, sex, sexual orientation, trade/tertiary qualification, current engagement in paid employment, current engagement in drug treatment and use and frequency of use of various drugs in the past 6 months.
Experience of COVID‐19 and associated restrictions
Participants in the 2020 sample were asked if they had: been tested for SARS‐CoV‐2, diagnosed with COVID‐19, and engaged in social distancing, home isolation and home quarantine.
Perceived changes in drug use since March 2020
In the 2020 survey, participants were asked how frequently they used ecstasy/MDMA and related drugs during the month preceding interview and during February (before COVID‐19 restrictions). Participants who reported use of a range of licit and illicit drugs in the last 6 months were asked whether their use of the drug changed from the beginning of March (since COVID‐19 restrictions) compared to before. For substances most commonly consumed in previous years [alcohol, cannabis, cocaine, ketamine, lysergic acid diethylamide (LSD), MDMA, methamphetamine, tobacco], participants were asked to nominate the reason(s) for this change. A list of pre‐specified reasons was developed by the investigator team and refined during piloting; a free‐text field for other reason(s) was also included.
Changes in illicit drug price
Across the 2016–20 samples, participants were asked the last price they paid for illicit drugs during the past 6 months ($AUD). The most common measure of quantity reported for each drug was used: cannabis (hydroponic and bush; per ounce), cocaine (gram), ketamine (g), LSD (tab), MDMA (capsule, pill and crystal; gram) and methamphetamine (powder and crystal; gram and point, respectively). In 2020, participants were asked which month they last purchased the drug to enable distinction between prices before and after the introduction of restrictions.
Changes in illicit drug perceived availability
Across the 2016–20 samples, participants were asked: ‘how easy is it to obtain the drug at the moment’ for the aforementioned drugs. Questions regarding availability of different forms of ecstasy/MDMA were introduced in 2017. In 2020, participants were also asked whether availability had changed since March.
Changes in illicit drug perceived purity
Across the 2016–20 samples, participants were asked: ‘how strong would you say the drug is at the moment’ for the aforementioned drugs. Questions regarding purity of different forms of ecstasy/MDMA were introduced in 2017.
Data analysis
Data were analysed using R version 4.0.2 [14]. Descriptive statistics for categorical data are presented as percentages and continuous data are presented as mean and standard deviation (SD). Where data were collected for multiple drug forms findings for the most commonly consumed form are reported in the text, and other forms in the Supporting information Appendix. As minimal data were missing (< 1%), complete case analysis was used; only those who responded to the survey item about the market indicator were included, and the number of missing responses per covariate is reported (Supporting information, Table S3). Our analysis plan was pre‐registered on Open Science Framework (https://osf.io/3fyh6/), but we did not have a pre‐formed hypothesis, so results should be considered exploratory.
Retrospective self‐report data from the 2020 interviews were used to ascertain participants’ perceived change in drug use and drug availability. Data from 2016–20 interviews were utilized as repeated cross‐sectional data to assess changes in price, purity and availability of illicit drugs over time. This time‐period was chosen due to changes in survey item wording and participant recruitment.
Sample characteristics
Sample characteristics across the 5 years of interviews were compared using variance‐weighted least squares regression for continuous outcomes and linear trend of log odds for categorical outcomes (Supporting information, Table S3).
Perceived changes in drug use since March 2020
Perceived change in drug use (including alcohol and tobacco) since COVID‐19 restrictions among the 2020 sample is reported descriptively. For participants who reported past 6‐month use of the three most commonly used drugs (ecstasy/MDMA, cannabis and alcohol; n = 684), the intersection between change in use of these drugs is presented visually [15]; expected percentages and 95% confidence intervals (CI) for each combination were derived from fitting a binomial logistic regression model.
Reasons for increased or decreased use were clustered by authors O.P., A.P., D.G. and R.B. using a priori categorization of fixed‐choice response options into themes (Supporting information, Table S5). Descriptive statistics are presented for the percentage of the sample endorsing each theme. Where possible, the free‐text responses were also categorized.
Changes in illicit drug price
Time of last purchase for 2020 was split into ‘pre‐COVID’ (October 2019–February 2020) and ‘during‐COVID’ (March 2020–July 2020). Trends in price over time were modelled using a linear mixed‐effect model [16], with jurisdiction included as a random effect to account for known jurisdictional differences in illicit drug markets [17]. Five years of data were included to incorporate any trend that existed prior to COVID‐19, with year of interview included as a continuous variable (1 for 2016 to 5 for 2020), and a categorical variable used to test for change in trend after COVID‐19 (0 for 2016–2019, 1 for pre‐COVID‐19, 2020; and 2 for during‐COVID‐19, 2020). We included age as a restricted cubic spline (two knots, placed at tertiles), as visual inspection indicated that the relationship was not linear, and Akaike's information criterion (AIC) indicated that this was the best fit. Other control variables were month of interview (categorical); interviews conducted in February (n = 2; 2016, 2017) and August (n = 1; 2019) were excluded, sex (categorical) and frequency of use (binary; ≥ weekly versus < weekly frequency). Jurisdiction and jurisdiction by year of interview were fitted as random intercept and random slope, respectively, after AIC criteria suggested that this fitted better than a random intercept only. During the model‐fitting process, the assumptions of mixed models were assessed; rationale for the model chosen is detailed in Supporting information, Table S4.
The coefficient, CI (calculated as profile likelihood confidence limits), and P‐value are presented for the COVID‐19 variable for each drug.
Changes in illicit drug perceived availability
Perceived availability was converted into a binary variable: easy (‘very easy’ or ‘easy’) and difficult (‘very difficult’ or ‘difficult’). Mixed‐effects logistic regression was used to assess differences in perceived availability over time, with confounders adjusted for as described for price (Supporting information, Table S4). To test for difference in trend in 2020, a dummy variable was included (0 for 2016–19; 1 for 2020).
Changes in illicit drug perceived purity
Perceived drug purity was converted into a binary variable reflecting high purity, clustering ‘low’, ‘medium’ and ‘fluctuates’ responses. Trend over time was assessed using the same model as described for perceived availability (Supporting information, Table S4).
Sensitivity analyses
To account for repeat participation, participants who reported participation in prior years were removed in sensitivity analyses (Supporting information, Table S7). A further sensitivity analysis was performed to directly compare 2020 observations (specifically those during‐COVID restrictions for price) to 2019 (Supporting information, Table S8). Finally, we performed additional post‐hoc sensitivity analyses to investigate the effects of including two additional years of data in the models (2014–15, Supporting information, Table S9), excluding participants aged under 18 years (due to the change in eligibility criteria in 2020, Supporting information, Table S10) and excluding ‘fluctuates’ as a response option for perceived purity (Supporting information, Table S11).
Results
Sample characteristics
Sample sizes each year comprised: 2016: n = 795; 2017: n = 786; 2018: n = 799; 2019: n = 797; and 2020: n = 805. Of the 2020 sample, the mean age was 24 years (SD = 6.5), 61% (n = 492) were male and 83% (n = 665) identified as heterosexual. Half the participants (51%, n = 412) had completed a tertiary degree or trade qualification and 65% (n = 522) were in paid employment at time of interview. Few participants reported current engagement with drug treatment (2%, n = 21). Sample characteristics remained consistent, except the sample were older and more educated over time (Supporting information, Table S3).
The majority of the EDRS 2020 sample reported that they had not undergone SARS‐CoV‐2 testing (91%, n = 731), and all participants who were tested (9%, n = 74) reported returning a negative result. Most participants (93%, n = 749) reported social distancing and home isolation (80%, n = 647), while 7% (n = 53) reported being required to quarantine for 14 days since March 2020.
Perceived changes in drug use since march 2020
Half the sample (52%, n = 417) reported that their frequency of use of ecstasy/MDMA and related drugs had declined in the month prior to interview compared to February (pre‐COVID restrictions). For most drugs, the majority of participants reported either no change or a reduction in their use since the beginning of March (Fig. 1). Ecstasy/MDMA was most frequently cited as reduced in use, with 70% of consumers (n = 552) reporting a reduction. Use of other illicit drugs (e.g. cocaine, ketamine, methamphetamine and nitrous oxide) was also reported as reduced for almost half of consumers. E‐cigarettes, non‐prescribed benzodiazepines and LSD were the drugs most commonly cited as stable in use. For alcohol, similar percentages of consumers reported no change, increase and decrease in use [36% (n = 281), 31% (n = 239) and 34% (n = 268), respectively], while for cannabis, the same percentage of consumers reported increasing and no change in use (41% each; n = 292 and 288, respectively).
Figure 1.
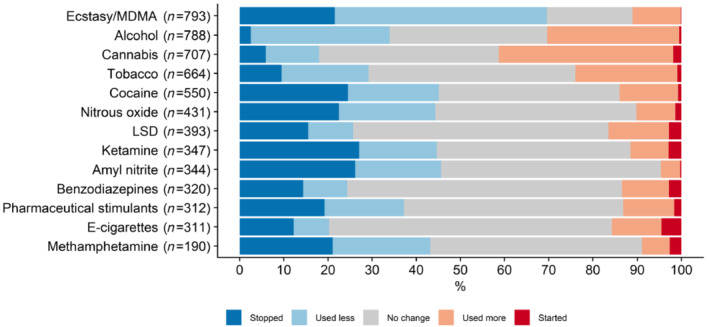
Self‐reported change in drug use since COVID‐19 pandemic restrictions, Ecstasy and Related Drugs Reporting System (EDRS) sample, 2020. Estimates reflect percentages of participants who had used the drug during the last 6 months and reported on change in use since March 2020 compared to before. Estimates reflect reports on non‐prescribed use for pharmaceutical medicines [Colour figure can be viewed at wileyonlinelibrary.com]
Investigation of the intersection between perceived change in use of MDMA, cannabis and alcohol showed substantial heterogeneity across participants. An increase in cannabis but decrease in MDMA and alcohol was the primary pattern observed in the sample and was reported more often than the calculated expected percentage (Fig. 2). Notably, participants were also more likely to report concurrent change across all three drugs (i.e. increase, no change or decrease for all) compared to the calculated expected value.
Figure 2.
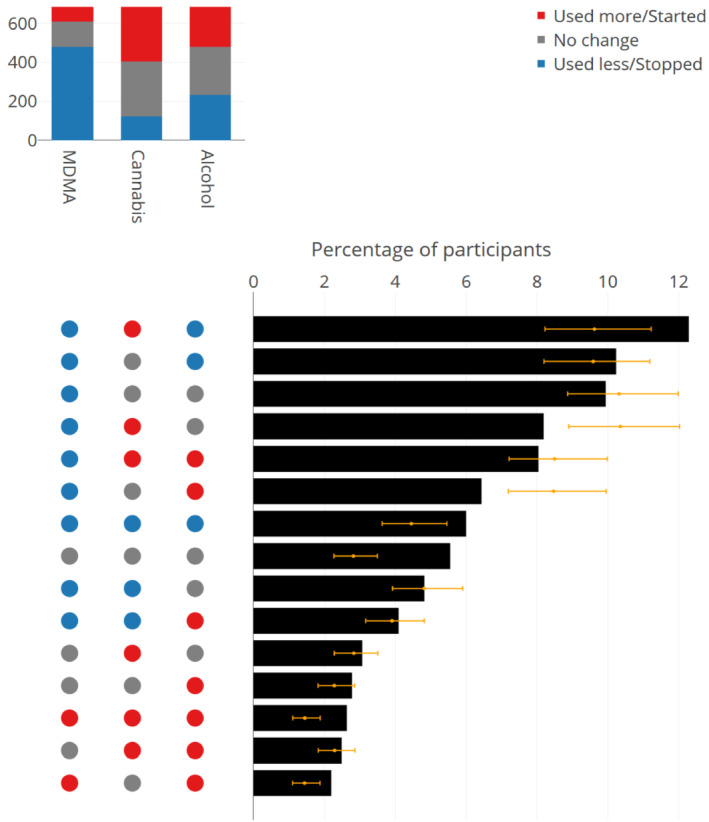
Intersection plot of perceived change in use of 3,4‐methylenedioxymethamphetamine (MDMA), cannabis and alcohol among those reporting recent use of all three drugs in the 2020 Ecstasy and Related Drugs Reporting System (EDRS) sample (n = 684). The colour of the dots and bars in the left panel indicates the direction of perceived change in use of each drug. The black bars represent the observed percentages of participants for each combination of change in drug use; the orange dots and error bars represent the expected percentage and 95% confidence interval. The combinations of change in drug use reported by < 2% of participants have been removed [Colour figure can be viewed at wileyonlinelibrary.com]
For all drugs, the majority of participants who reported an increase in use cited a social reason (e.g. more bored, more time; Fig. 3a). Approximately one‐in‐four participants who reported an increase in use of alcohol, methamphetamine or tobacco cited psychological effects (e.g. loneliness, greater depression/anxiety since COVID‐19) as the reason. Approximately one‐in‐four participants reported access‐related reasons (e.g. greater availability of the drug, larger amounts available due to stocking up) for their increase in use of methamphetamine, ecstasy/MDMA, LSD, cocaine and ketamine. The remaining reasons for increase in use were endorsed by fewer than one‐in‐10 participants (Supporting information, Table S6).
Figure 3.
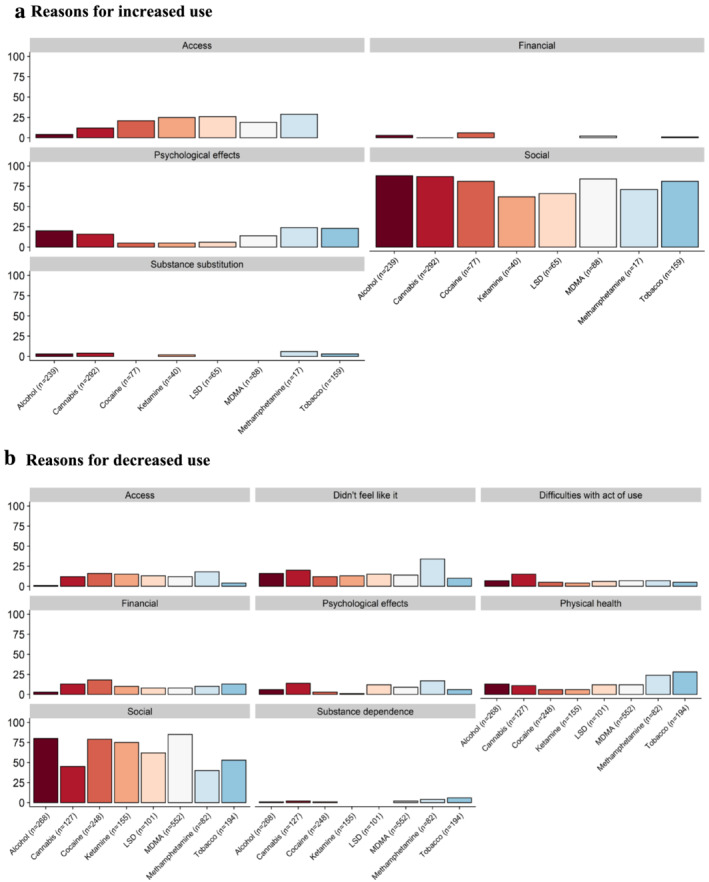
Self‐reported reasons for increased use (a) and decreased used (b), Ecstasy and Related Drugs Reporting System (EDRS) sample, 2020. % calculated out of those who reported increased or decreased use for each drug (n). Participants could nominate multiple forced‐choice response options. Responses were clustered into themes; see Supporting information, Table S5 for categorization of items and Supporting information, Table S6 for descriptive statistics for individual items by drug [Colour figure can be viewed at wileyonlinelibrary.com]
The most frequently cited reasons for decrease in use of all drugs were also social (e.g. fewer opportunities to be out; Fig. 3b). Approximately one‐in‐four participants who reported a decrease in use of methamphetamine or tobacco cited a reason related to physical health. The remaining themes were endorsed by fewer than one‐in‐five participants (Supporting information, Table S6).
Changes in illicit drug price
The median price of the drugs analysed has remained mainly stable during the past 5 years, with the exception of MDMA capsule, which has decreased (Fig. 4; Supporting information, Fig. S2). Correspondingly, results of regression analyses suggest that price did not change significantly after the implementation of COVID‐19‐related restrictions, except for bush cannabis (Table 1). Bush cannabis (per ounce) increased by $30.50 (95% CI= $5.90–55.10, P = 0.015; median price: $220) relative to the trend in price from 2016 to 2020 pre‐COVID. This result was reproduced when repeat participants were removed (Supporting information, Table S7), but not when 2020 during‐COVID observations were compared directly to 2019 (Supporting information, Table S8), suggesting that the increase in price during‐COVID restrictions is significant only in relation to the 5‐year trend, but not relative to 2019.
Figure 4.
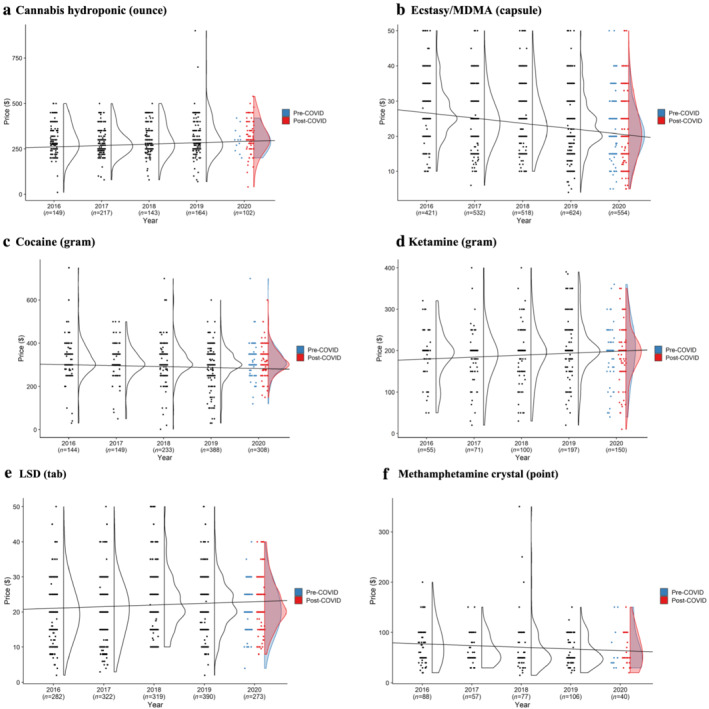
Last price of hydroponic cannabis (a), ecstasy/methylenedioxymethamphetamine (MDMA) capsules (b), cocaine (c), methamphetamine powder (d), lysergic acid diethylamide (LSD) (e) and ketamine (f), Ecstasy and Related Drugs Reporting System (EDRS) samples, 2016–20. Each dot represents an individual report of current price, and the data distribution is summarized as a smoothed density plot. The line represents the mixed‐effects linear regression model of price modelled on year of interview with 2020 post‐COVID excluded. Outliers (observations in the top 0.1 percentile) have been removed to improve visualization of trends. Price for other forms of these drugs (bush cannabis; ecstasy/MDMA pills; ecstasy/MDMA crystal, methamphetamine crystal) are available in Supporting information, Fig. S2 [Colour figure can be viewed at wileyonlinelibrary.com]
Table 1.
Results of regression analyses for changes in illicit drug price, perceived availability and perceived purity.
| Price ($) | Perceived availability (‘easy/very easy’) | Perceived purity (‘high’) | |||||||
|---|---|---|---|---|---|---|---|---|---|
| n | β (95% CI) | P‐value | n | OR (95% CI) | P‐value | n | OR (95% CI) | P‐value | |
| Cannabis bush (ounce) | 576 | 30.5 (5.9–55.1) | 0.015 | 1874 | 0.90 (0.64–1.28) | 0.571 | 1508 | 0.88 (0.58–1.34) | 0.560 |
| Cannabis hydroponic (ounce) | 782 | −17.8 (−36.5, 1.0) | 0.063 | 1874 | 1.43 (0.70–3.20) | 0.198 | 1853 | 0.92 (0.65–1.29) | 0.623 |
| Cocaine (gram) | 1262 | 6.2 (−6.7, 19.2) | 0.346 | 1628 | 0.67 (0.46–0.96) | 0.030 | 1560 | 1.06 (0.50–1.56) | 0.783 |
| Ecstasy/MDMA (capsule) | 2265 | −0.5 (−1.5, 0.4) | 0.266 | 2417 | 0.42 (0.26–0.67) | < 0.001 | 2405 | 0.72 (0.53–0.99) | 0.044 |
| Ecstasy/MDMA crystal (gram) | 1122 | −8.9 (−26.8–9.0) | 0.330 | 1672 | 1.01 (0.64–1.60) | 0.958 | 1668 | 0.52 (0.36–0.76) | 0.001 |
| Ecstasy/MDMA (pill) | 2607 | −1.3 (−3.0–0.4) | 0.133 | 2152 | 0.63 (0.42–0.96) | 0.030 | 2128 | 0.74 (0.50–1.09) | 0.124 |
| Ketamine (gram) | 592 | −11.4 (−27.8, 4.9) | 0.170 | 892 | 1.34 (0.82–2.18) | 0.247 | 863 | 0.63 (0.19–2.12) | 0.700 |
| LSD (tablet) | 1615 | 0.7 (−1.2, 2.5) | 0.514 | 1774 | 1.43 (1.00–2.03) | 0.048 | 1724 | 0.91 (0.64–1.28) | 0.584 |
| Methamphetamine crystal (point) | 384 | 8.3 (−4.1, 20.7) | 0.188 | 574 | 0.12 (0.04–0.41) | < 0.001 | 538 | 0.66 (0.35–1.25) | 0.204 |
| Methamphetamine powder (gram) | 187 | 28.2 (−49.5, 106.2) | 0.475 | 472 | 0.81 (0.38–1.69) | 0.567 | 453 | 1.19 (0.56–2.50) | 0.654 |
Change in price was estimated using mixed‐effect linear regression comparing post‐COVID 2020 against the 5‐year trend; change in availability and purity was estimated using mixed‐effect logistic regression comparing 2020 against the 5‐year trend. All models were adjusted for age, sex, month of interview, frequency of use and jurisdiction. Price models were computed for the most commonly reported quantity per drug form—capsule [ecstasy/ 3,4‐methylenedioxymethamphetamine (MDMA)], pill (ecstasy/MDMA), gram (cocaine, ketamine, methamphetamine powder, ecstasy/MDMA crystal), tablet [lysergic acid diethylamide (LSD)], point (methamphetamine crystal) and ounce (cannabis hydroponic and bush). Bold values denote statistical significance, p < 0.05. OR odds ratio; CI confidence interval.
For the remaining drugs, results of sensitivity analyses removing repeat participants also indicated no significant change in price (Supporting information, Table S7). Results of sensitivity analyses that directly compared reported prices in 2020 during‐COVID to 2019 were also similar to the principal analyses, with the exception of MDMA capsules, which significantly decreased in price (−$1.70 CI = –$3.10, −$0.20, P = 0.003, median price = $25), and MDMA crystal (gram: −$26.80; CI = –$46.80, −$6.60, P = 0.012, median price = $180; Supporting information, Table S8).
Changes in illicit drug perceived availability
The majority of participants reported stable availability of drugs since March 2020 compared to before (Fig. 5a; Supporting information, Fig. S3). Crystal methamphetamine, ecstasy/MDMA pills and capsules and cocaine were most commonly cited as being more difficult to obtain, although by fewer than half of those who responded. This was reflected in the multi‐level logistic regression model, particularly for crystal methamphetamine. The adjusted odds ratio (aOR) of perceiving the drug as ‘easy/very easy’ to obtain in 2020 compared to the trend from 2016 to 2019 was 0.12 (0.04–0.41, P < 0.001). For MDMA capsules, the aOR was 0.42 (95% CI = 0.26–0.67, P < 0.001; Table 1), for MDMA pills it was 0.63 (95% CI = 0.42–0.96, P = 0.030) and for cocaine it was 0.67 (95% CI = 0.46–0.96, P = 0.030). These results were replicated after removing repeat participants from analyses (Supporting information, Table S7) and were replicated when comparing 2020 responses to 2019, except for cocaine (Supporting information, Table S8).
Figure 5.
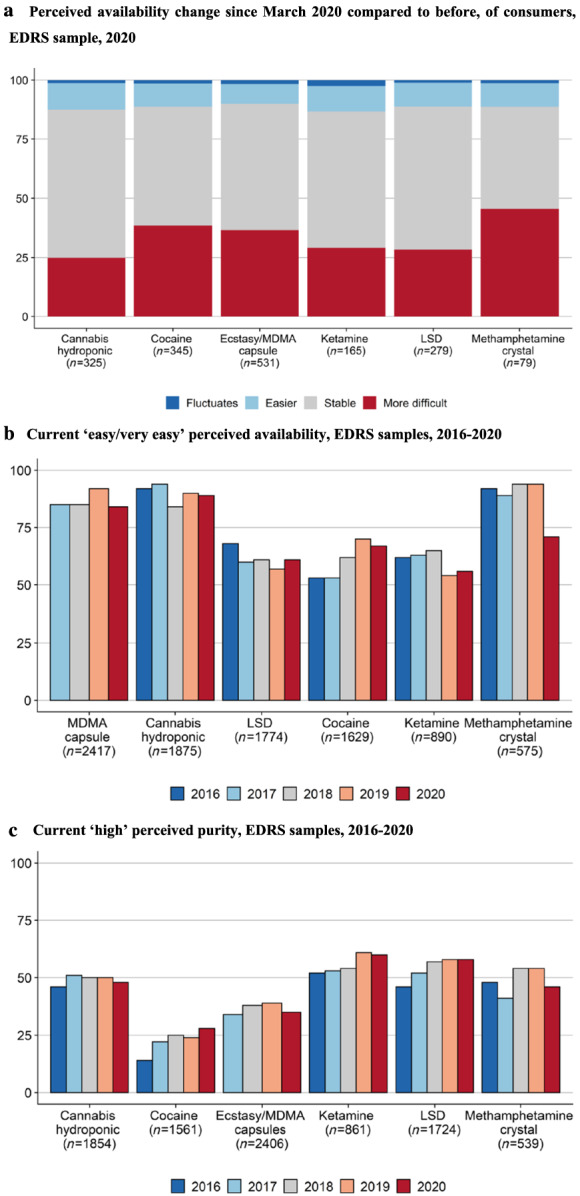
Percentage reporting change in availability since COVID‐19 restrictions (a), current perceived availability of illicit drugs as ‘easy/very easy’ (b) and of purity as ‘high’ (c). (a) Perceived availability change since March 2020 compared to before, of consumers, Ecstasy and Related Drugs Reporting System (EDRS) sample, 2020; (b) current ‘easy/very easy’ perceived availability, EDRS samples, 2016–20; (c) current ‘high’ perceived purity, EDRS samples, 2016–20. The number reporting availability (b) and purity (c) for each drug has been summed across years. Questions about availability and purity were asked for MDMA capsules from 2017. See detailed reports of perceived availability and purity for these drugs—and for other forms of these drugs—in Supporting information, Figs S3 and S4 [Colour figure can be viewed at wileyonlinelibrary.com]
Analyses suggested that LSD became easier to obtain in 2020 compared to the trend from 2016 to 2019 (Table 1), although the increase was small (aOR = 1.43, 95% CI = 1.00–2.03, P = 0.049). However, only 10% (n = 28) of participants who responded in 2020 reported that LSD had become easier to obtain since March 2020. Moreover, while the direction of this result was reflected in both sensitivity analyses, the results were no longer significant (Supporting information, Tables S7 and S8).
Changes in illicit drug perceived purity
The perceived purity of all drugs also remained mainly stable (Fig. 5c; Supporting information, Fig. S4), except for ecstasy/MDMA capsules (aOR = 0.72, 95% CI = 0.53–0.99, P = 0.044) and crystal (aOR = 0.52, 95% CI = 0.36–0.76, P = 0.001), which decreased significantly in 2020 compared to the trend that existed from 2017 to 2019 (Table 1). While the direction of this result was reflected in both sensitivity analyses (Supporting information, Tables S7 and S8), the results only remained significant for the crystal form.
Post‐hoc sensitivity analyses
Results of post‐hoc sensitivity analyses were similar to those of the main analysis. However, when data from 2014 to 2015 were included in the models the decrease in cocaine availability and increase in LSD availability were no longer significant (Supporting information, Table S9). Similarly, the decrease in LSD availability was no longer significant when participants aged under 18 years were excluded (Supporting information, Table S10). Exclusion of ‘fluctuates’ responses from analysis of perceived purity did not change results (Supporting information, Table S11).
Discussion
The aim of this study was to explore shifts in drug use and markets in Australia associated with COVID‐19 and related restrictions on gatherings and movement by drawing upon data collected from sentinel samples prior and subsequent to introduction of restrictions. Most participants perceived that their use of ecstasy/MDMA and related drugs (e.g. cocaine, ketamine) had decreased relative to pre‐COVID‐19 and associated restrictions. Illicit drug price and perceived purity were mainly reported as stable, except for a decline in perceived purity of MDMA crystal. Perceived availability of crystal methamphetamine, MDMA pills and capsules, and cocaine all declined. While these findings are exploratory and need to be replicated, they suggest some demand reduction in the presence of restrictions on travel and gatherings and thus may be transient, as well as early evidence of potential supply disruption for certain drugs.
Decreased use of illicit drugs often used in recreational settings (e.g. MDMA, cocaine) and, predominantly for reasons related to impacts of restrictions on socializing, aligns with other Australian [18] and international research [19, 20, 21]. COVID‐19 restrictions have arguably functioned as a demand reduction intervention, driving behaviour change for some individuals by removing social motives for drug use through limits on gatherings. For this reason, reductions in use may have reversed with relaxation of restrictions on gatherings, although this is probably dependent upon drug markets and subject to individual variability. Indeed, unique analyses here revealed no clear dominant pattern when looking at the intersection between changes in MDMA, alcohol and cannabis use, suggesting heterogeneous responses to COVID‐19 and associated restrictions which are often concealed by analyses of the total sample. It is also important to note that few among the EDRS sample experience drug dependence and/or engage with drug treatment, and thus findings may differ when assessed in populations who are experiencing greater problems related to their use, including people who inject drugs.
Notably among the smaller percentage who reported increased use, social factors were also a key driver for this change, particularly for drugs such as alcohol and cannabis, with participants citing boredom, lack of activity and spending more time with others with whom they use these drugs. Further, one in four consumers cited increased stress, anxiety and depression associated with COVID‐19 as a reason for increased use of drugs such as alcohol and methamphetamine. Given that use for coping and self‐medication is associated with developing more problematic patterns of drug use [22], these findings reinforce the necessity of addressing barriers to mental health service utilization for people who use illicit drugs. This is particularly critical, given the COVID‐19 pandemic‐related economic, social and other stressors facing many people, which have created a heightened risk environment for developing more problematic patterns of substance use [23].
There was limited evidence of shifts in drug price and purity, although there were some indications of a decline in perceived availability of cocaine and methamphetamine crystal and availability and purity of MDMA, which are the most commonly used illicit drugs in this sample and in Australia [24], excluding cannabis. These data were collected soon after implementation of restrictions in Australia, and may be an early indication of some disruption to illicit drug markets in Australia. Supply disruptions were expected, given Australia's remoteness and reliance upon importation of drugs from overseas (with the exception of cannabis, which has a strong local market [25]), and the restrictions on available importation methods (e.g. limited air passenger transport). However, it was anticipated that these disruptions may take some time to manifest depending on demand, time to deplete existing supply and duration of national and jurisdictional border restrictions.
Although early European research suggested that production and distribution of most drugs were not majorly affected during restrictions up until June 2020 [26], other Australian survey data collected in June–September shows emerging evidence of disruption to methamphetamine and heroin supply [27]. The magnitude and duration of these supply disruptions will probably depend upon the state of production in supplier countries, capacity of local production, duration of border restrictions and innovation in combating barriers to distribution. Indeed, there are particular concerns about emergence of new markets and/or greater adulteration with cheaper, easily‐transportable emerging substances with disruption to more established illicit drug markets and continued demand [9]. Ongoing monitoring drawing upon sentinel and population‐level data will be critical to establish extent and pervasiveness of drug market shifts, and potential fluctuations in use and harms as a consequence.
Strengths and limitations
A particular strength of this study lies in the ability to directly compare data collected prior to the COVID‐19 pandemic. While the annual samples are cross‐sectional, methods of recruitment were consistent, and analysis of sample characteristics shows a similar profile over time. Other strengths include the collection of data across all Australian jurisdictions, in‐depth collection of information on price, purity and availability of various drugs in different forms and timeliness of data collection relative to implementation of COVID‐19‐associated restrictions.
In saying this, data are collected from sentinel Australian city samples, and may not generalize to the broader population who use stimulants in Australia or internationally. However, consistency of recruitment methods and sample profile over time means that we can be confident in the relative changes observed, although noting interviewing modality changed to video/phone from face‐to‐face in 2020. This study relies upon retrospective self‐report data which may be limited by recall bias, although existing research indicates sufficient reliability and validity when assessing illicit drug use and associated behaviours [28]. A minority of participants report prior participation in our study each year, but the anonymous nature of the study means that we are unable to link repeat participants across survey years accurately and therefore cannot utilize a repeated measures framework. While repeat participation in annual cross‐sectional studies is unlikely to affect population‐level inferences [29] and we saw similar results when excluding them from analyses, we acknowledge that the non‐independence of observations may have biased results.
We were unable to use prevalence of drug use across survey years to investigate the effect of the pandemic on drug use, as the 6‐month recall period in 2020 included months prior to the introduction of restrictions, and participants were recruited based on their regular stimulant use. Therefore, data on change in use rely upon cross‐sectional data and we cannot establish the concordance between perceived versus objective change since March 2020. Additionally, we were unable to capture nuances of this change; for example, whether use changed in frequency or quantity and whether the change shifted during the period after restrictions were introduced. When analysing change in drug price we did not account for inflation. Change in drug price may manifest as change in purity or discrepancy in weight rather than a more tangible change in cost per transaction [30, 31]. This may be resolved by using purity data from drug seizures [32, 33] although this was not feasible here, as high‐frequency (i.e. more than quarterly) data were not available at the national level. Participants only reported the last price they had paid in 2020, rather than both a pre‐ and post‐COVID price. While we controlled for some individual differences in the model, including frequency of use, we cannot completely eliminate the effect of these differences on reported price values. Lastly, we did not adjust for possible inflation of Type 1 error rate in our analyses, instead choosing to emphasize effect sizes, and note the exploratory nature of our analyses. These factors should be considered when drawing conclusions from this study, and we encourage efforts to replicate our findings.
Conclusions
Use of ecstasy/MDMA, related stimulants and other licit and illicit drugs mostly remained stable or decreased since COVID‐19‐related restrictions were introduced in Australia, primarily due to impediments to socialization. Reductions in use may be reversed with lifting of restrictions, although heterogeneity in patterns of drug use during COVID‐19 suggest a probable diversity of responses, particularly with economic, social and other stressors associated with COVID‐19. Market indicators remained mostly stable, although there was some evidence of perceived reduction in purity and availability of MDMA, cocaine and methamphetamine. Given that data were collected relatively early in restrictions, the manifestation of potential drug market disruption throughout the COVID‐19 pandemic requires close monitoring, with ongoing international border restrictions and scope for innovation in illicit drug production and distribution.
Declaration of interests
A.P. has received untied educational grant from Seqirus and Mundipharma for study of opioid medications. R.B. has received untied educational grant from Mundipharma and Indivior for study of opioid medications. P.D. has received untied educational grant from Gilead sciences for work related to hepatitis C and an untied educational grant from Indivior. S.L. and P.D. have served as an unpaid member of an Advisory Board for Mundipharma. L.D. has received untied educational grant from Seqirus, Indivior and Mundipharma for study of opioid medications. All other authors have no conflicts of interest to declare.
Author contributions
Olivia Price: Conceptualization; data curation; formal analysis; investigation; methodology; project administration; visualization. Nicola Man: Conceptualization; formal analysis; investigation; methodology; supervision; visualization. Raimondo Bruno: Conceptualization; funding acquisition; investigation; methodology; project administration. Paul Dietze: Conceptualization; funding acquisition; investigation; project administration. Caroline Salom: Conceptualization; funding acquisition; investigation; project administration. Simon Lenton: Conceptualization; funding acquisition; investigation; project administration. Jodie Grigg: Conceptualization; investigation; project administration. Daisy Gibbs: Conceptualization; investigation; methodology; project administration. Tanya Wilson: Conceptualization; investigation; project administration. Louisa Degenhardt: Conceptualization; funding acquisition; investigation; project administration. Roanna Chan: Conceptualization; investigation; project administration. Natalie Thomas: Conceptualization; investigation. Amy Peacock: Conceptualization; formal analysis; funding acquisition; investigation; methodology; project administration; supervision.
Pre‐registered analysis plan
Supporting information
Table S1 STROBE Checklist for Cross‐Sectional Studies.
Figure S1 Timeline of COVID‐19 in Australia and EDRS data collection period.
Table S2 Survey questions, response options and post‐categorisation of response options.
Table S3 Sample characteristics 2016–2020.
Table S4 Model definition and rationale.
Table S5 Thematic categorisation of reasons for increased and decreased use of drugs and results of confirmatory factor analyses.
Table S6 Detailed descriptive statistics for reasons for increased and decreased use of drugs.
Table S6A Reasons for decreased use of drugs.
Table S6B Reasons for increased use of drugs.
Figure S2 Additional plots of median price.
Figure S3 Additional plots of perceived availability.
Figure S4 Additional plots of perceived purity.
Table S7 Sensitivity regression analyses for price, purity and availability removing repeat participants.
Table S7B Number of ‘unique’ participants each year.
Table S7A Results of regression analyses for illicit drug price, perceived availability and perceived purity.
Table S8 Sensitivity regression analyses for price, purity and availability comparing 2020 post‐COVID (price) and 2020 (purity and availability) directly to 2019.
Table S9 Post‐hoc sensitivity regression analyses for price, purity and availability using data 2014–2020.
Table S10 Post‐hoc sensitivity regression analyses for price, purity and availability excluding participants under 18 years of age.
Table S11 Post‐hoc sensitivity regression analyses purity excluding ‘fluctuates’ as response option.
Acknowledgements
We would like to thank the Chief Investigators and the broader Drug Trends team, past and present, for their contribution to the EDRS. We would also like to thank the thousands of participants who have shared their experiences and expertise with us over the years. Finally, we would like to thank the Australian Injecting and Illicit Drug Users League (AIVL) for their review of the 2020 questionnaire and input on important items.
Drug Trends (including the EDRS) and the National Drug and Alcohol Research Centre are funded by the Department of Health, Australian Government under the Drug and Alcohol Program. S.L. was supported by funding from the Department of Health, Australian Government under the Drug and Alcohol Program through its core funding of The National Drug Research Institute at Curtin University. A.P. is supported by a National Health and Medical Research Council (NHMRC) Investigator Fellowship (no. 1174630). L.D. is supported by a NHMRC Senior Principal Research Fellowship (no. 1135991). L.D. is supported by National Institute of Health (NIH) National Institute on Drug Abuse (NIDA) grant (R01DA1104470).
Price, O. , Man, N. , Bruno, R. , Dietze, P. , Salom, C. , Lenton, S. , Grigg, J. , Gibbs, D. , Wilson, T. , Degenhardt, L. , Chan, R. , Thomas, N. , and Peacock, A. (2022) Changes in illicit drug use and markets with the COVID‐19 pandemic and associated restrictions: findings from the Ecstasy and Related Drugs Reporting System, 2016–20. Addiction, 117: 182–194. 10.1111/add.15620
References
- 1. United Nations Office on Drugs and Crime World Drug Report 2019. Vienna: United Nations; 2019. [Google Scholar]
- 2. European Monitoring Centre for Drugs and Drug Addiction European Drug Report 2019: Trends and Developments. Luxembourg: Publications Office of the European Union, p. 2019. [Google Scholar]
- 3. Burns L., Roxburgh A., Bruno R., Van Buskirk J. Monitoring drug markets in the internet age and the evolution of drug monitoring systems in Australia. Drug Test Anal 2014; 6: 840–845. [DOI] [PubMed] [Google Scholar]
- 4. Artigiani E. E., Wish E. D. Introducing the National Drug Early Warning System. Curr Opin Psychiatry, Vol. 33; 2020, pp. 319–325. [DOI] [PMC free article] [PubMed] [Google Scholar]
- 5. Degenhardt L., Day C., Dietze P., Pointer S., Conroy E., Collins L., et al. Effects of a sustained heroin shortage in three Australian states. Addiction 2005; 100: 908–920. [DOI] [PubMed] [Google Scholar]
- 6. Peacock A., Bruno R., Gisev N., Degenhardt L., Hall W., Sedefov R., et al. New psychoactive substances: challenges for drug surveillance, control, and public health responses. Lancet 2019; 394: 1668–1684. [DOI] [PubMed] [Google Scholar]
- 7. Dom G., Samochowiec J., Evans‐Lacko S., Wahlbeck K., Van Hal G., McDaid D. The impact of the 2008 economic crisis on substance use patterns in the countries of the European Union. Int J Environ Res Public Health 2016; 13: 122. [DOI] [PMC free article] [PubMed] [Google Scholar]
- 8. Mackey T. K., Strathdee S. A. Big events and risks to global substance using populations: unique threats and common challenges. Subst Use Misuse 2015; 50: 885–890. [DOI] [PMC free article] [PubMed] [Google Scholar]
- 9. Dietze P. M., Peacock A. Illicit drug use and harms in Australia in the context of COVID‐19 and associated restrictions: anticipated consequences and initial responses. Drug Alcohol Rev 2020; 39: 297–300. [DOI] [PMC free article] [PubMed] [Google Scholar]
- 10. Centers for Disease Control and Prevention (CDC) Increase in Fatal Drug Overdoses Across the United States Driven by Synthetic Opioids Before and During the COVID‐19 Pandemic. Atlanta, GA: CDC Health Alert Network; 2020. [Google Scholar]
- 11. Holland K. M., Jones C., Vivolo‐Kantor A. M., Idaikkadar N., Zwald M., Hoots B., et al. Trends in US emergency department visits for mental health, overdose, and violence outcomes before and during the COVID‐19 pandemic. JAMA Psychiatry 2021; 78: 372–379. [DOI] [PMC free article] [PubMed] [Google Scholar]
- 12. Australian Government Department of Health . Coronavirus (COVID‐19) Current Situation and Case Numbers. Canberra, Australia: Australian Government Department of Health; 2020.
- 13. Peacock A., Karlsson A., Uporova J., Gibbs D., Swanton R., Kelly G., et al. Australian Drug Trends 2019: Key Findings from the National Ecstasy and Related Drugs Reporting System (EDRS) Interviews. Sydney, Australia: National Drug and Alcohol Research Centre, UNSW Sydney; 2019. [Google Scholar]
- 14. R Core Team . R: A Language and Environment for Statistical Computing. Vienna, Austria; 2013.
- 15. Lex A., Gehlenborg N., Strobelt H., Vuillemot R., Pfister H. J. I. UpSet: visualization of intersecting sets. IEEE Trans Vis Comput Graph 2014; 20: 1983–1992. [DOI] [PMC free article] [PubMed] [Google Scholar]
- 16. Bates D., Mächler M., Bolker B., Walker S. J. Fitting linear mixed‐effects models using lme4. J Stat Softw 2014; 67: 1–48. [Google Scholar]
- 17. Australian Criminal Intelligence Commission National wastewater drug monitoring program. Report 10. Queensland, Australia: Australian Criminal Intelligence Commission; 2020. [Google Scholar]
- 18. Sutherland R., Baillie G., Memedovic S., Hammoud M., Barratt M., Bruno R., et al. Key findings from the ‘Australians’ Drug Use: Adapting to Pandemic Threats (ADAPT)’ Study. ADAPT Bulletin no. 1. Sydney, Australia: National Drug and Alcohol Research Centre, UNSW Sydney; 2020. [Google Scholar]
- 19. European Monitoring Centre for Drugs and Drug Addiction (EMCDDA) Impact of COVID‐19 on Drug Markets, Drug Use, Drug‐Related Harms and Responses in East European Neighbourhood Policy Countries. Lisbon, Portugal: EMCDDA; 2020. [Google Scholar]
- 20. Palamar J. J., Le A., Acosta P. Shifts in drug use behavior among electronic dance music partygoers in New York during COVID‐19 social distancing. Subst Use Misuse 2021; 56: 238–244. [DOI] [PMC free article] [PubMed] [Google Scholar]
- 21. Starks T. J., Jones S. S., Sauermilch D., Benedict M., Adebayo T., Cain D., et al. Evaluating the impact of COVID‐19: a cohort comparison study of drug use and risky sexual behavior among sexual minority men in the U.S.A. Drug Alcohol Depend 2020; 216: 108260. [DOI] [PMC free article] [PubMed] [Google Scholar]
- 22. Cooper M. L., Kuntsche E., Levitt A., Barber L. L., Wolf S. Motivational models of substance use: a review of theory and research on motives for using alcohol, marijuana, and tobacco. 2016. In: Sher H. K., editor. The Oxford Handbook of Substance Use and Substance Use Disorders, Vol. 1. New York, NY: Oxford University Press; 2016, pp. 375–421. [Google Scholar]
- 23. Czeisler M. É., Lane R. I., Petrosky E., Wiley J. F., Christensen A., Njai R., et al. Mental health, substance use, and suicidal ideation during the COVID‐19 pandemic—United States, June 24–30, 2020. Morb Mortal Wkly Rep 2020; 69: 1049–1057. [DOI] [PMC free article] [PubMed] [Google Scholar]
- 24. Australian Institute of Health and Welfare (AIHW) National Drug Strategy Household Survey 2019. Canberra, Australia: AIHW; 2020. [Google Scholar]
- 25. Australian Criminal Intelligence Commission Illicit Drug Data Report. Canberra, Australia: Australian Criminal Intelligence Commission; 2019. [Google Scholar]
- 26. European Monitoring Centre for Drugs and Drug Addiction (EMCDDA) Impact of COVID‐19 on Patterns of Drug Use and Drug‐Related Harms in Europe. Lisbon, Portugal: EMCDDA; 2020. [Google Scholar]
- 27. Peacock A., Price O., Karlsson A., Uporova J., Chan R., Swanton R., et al. Impact of COVID‐19 and associated restrictions on people who inject drugs in Australia: Findings from the Illicit Drug Reporting System 2020, Drug Trends Bulletins Series. Sydney, Australia: National Drug and Alcohol Research Centre, UNSW Sydney; 2020. [Google Scholar]
- 28. Darke S. Self‐report among injecting drug users: a review. Drug Alcohol Depend 1998; 51: 253–263. [DOI] [PubMed] [Google Scholar]
- 29. Agius P., Aitken C., Breen C., Dietze P. Repeat participation in annual cross‐sectional surveys of drug users and its implications for analysis. BMC Res Notes 2018; 11: 349. [DOI] [PMC free article] [PubMed] [Google Scholar]
- 30. Caulkins J. P. Price and purity analysis for illicit drug: data and conceptual issues. Drug Alcohol Depend 2007; 90: S61–S68. [DOI] [PubMed] [Google Scholar]
- 31. Reuter P., Caulkins J. P. Illegal ‘lemons’: price dispersion in cocaine and heroin markets. Bull Narc 2004; 56: 141–165. [Google Scholar]
- 32. Hughes C., Hulme S., Ritter A. The relationship between drug price and purity and population level harm. Trends and issues in crime and criminal justice no. 598. Canberra, Australia: Australian Institute of Criminology; 2020. [Google Scholar]
- 33. Scott N., Caulkins J. P., Ritter A., Quinn C., Dietze P. High‐frequency drug purity and price series as tools for explaining drug trends and harms in Victoria, Australia. Addiction 2015; 110: 120–128. [DOI] [PubMed] [Google Scholar]
Associated Data
This section collects any data citations, data availability statements, or supplementary materials included in this article.
Supplementary Materials
Table S1 STROBE Checklist for Cross‐Sectional Studies.
Figure S1 Timeline of COVID‐19 in Australia and EDRS data collection period.
Table S2 Survey questions, response options and post‐categorisation of response options.
Table S3 Sample characteristics 2016–2020.
Table S4 Model definition and rationale.
Table S5 Thematic categorisation of reasons for increased and decreased use of drugs and results of confirmatory factor analyses.
Table S6 Detailed descriptive statistics for reasons for increased and decreased use of drugs.
Table S6A Reasons for decreased use of drugs.
Table S6B Reasons for increased use of drugs.
Figure S2 Additional plots of median price.
Figure S3 Additional plots of perceived availability.
Figure S4 Additional plots of perceived purity.
Table S7 Sensitivity regression analyses for price, purity and availability removing repeat participants.
Table S7B Number of ‘unique’ participants each year.
Table S7A Results of regression analyses for illicit drug price, perceived availability and perceived purity.
Table S8 Sensitivity regression analyses for price, purity and availability comparing 2020 post‐COVID (price) and 2020 (purity and availability) directly to 2019.
Table S9 Post‐hoc sensitivity regression analyses for price, purity and availability using data 2014–2020.
Table S10 Post‐hoc sensitivity regression analyses for price, purity and availability excluding participants under 18 years of age.
Table S11 Post‐hoc sensitivity regression analyses purity excluding ‘fluctuates’ as response option.