Abstract.
Purpose: Pathologists rely on relevant clinical information, visual inspection of stained tissue slide morphology, and sophisticated molecular diagnostics to accurately infer the biological origin of secondary metastatic cancer. While highly effective, this process is expensive in terms of time and clinical resources. We seek to develop and evaluate a computer vision system designed to reasonably infer metastatic origin of secondary liver cancer directly from digitized histopathological whole slide images of liver biopsy.
Approach: We illustrate a two-stage deep learning approach to accomplish this task. We first train a model to identify spatially localized regions of cancerous tumor within digitized hematoxylin and eosin (H&E)-stained tissue sections of secondary liver cancer based on a pathologist’s annotation of several whole slide images. Then, a second model is trained to generate predictions of the cancers’ metastatic origin belonging to one of three distinct clinically relevant classes as confirmed by immunohistochemistry.
Results: Our approach achieves a classification accuracy of 90.2% in determining metastatic origin of whole slide images from a held-out test set, which compares favorably to an established clinical benchmark by three board-certified pathologists whose accuracies ranged from 90.2% to 94.1% on the same prediction task.
Conclusions: We illustrate the potential impact of deep learning systems to leverage morphological and structural features of H&E-stained tissue sections to guide pathological and clinical determination of the metastatic origin of secondary liver cancers.
Keywords: deep learning, digital pathology, cancer, liver, metastasis
1. Introduction
Metastatic liver cancer accounts for 25% of all metastases to solid organs, yet because liver metastases can arise from almost anywhere in the body, accurately determining the origin of metastatic liver cancer is of paramount importance for guiding effective treatment.1,2 In clinical practice, pathologists commonly rely on clinical information, tissue examination, and molecular assays to determine the metastatic origin of a patient’s secondary liver tumor. Although clinically effective, this approach requires significant expertise, experience, and time to perform properly.
Deep learning methods have rapidly accelerated the automation of key processes in identifying and quantifying clinically meaningful features in biomedical images and continue to drive modern advancements in digital pathology.3,4 Furthermore, deep learning systems have been applied to settings where their performance matches and even exceeds the ability of clinical human practitioners in tasks related to image analysis, including in clinical instances that rely on inspection of hematoxylin and eosin (H&E)-stained tissue.5–9 The emerging power and success of many deep learning approaches applied to image content analysis stem from their ability to learn and leverage meaningful features from large data collections that cannot be explicitly mathematically modeled.6,10–14 For example, these approaches can provide robust and reproducible solutions for automated detection and analysis of tumor lesions within whole slide images (WSIs) containing both normal and cancerous tumor tissue segments.15–18
Our key contribution in this paper is a deep learning approach to identify metastatic tissue within whole slide section and classify these tumors by their metastatic origin. We evaluate model performance with respect to a clinical benchmark established by three board-certified pathologists charged with the same classification task as our model in which each pathologist was tasked to infer the metastatic origin of liver cancer directly from H&E-stained tissue sections without the use of molecular immunohistochemistry assays or clinical data. Through this work, we demonstrate feasibility of deep learning systems to automatically characterize the biological origin of metastatic cancers by their morphological features presented in H&E tissue sections.
2. Methods
2.1. Data Set
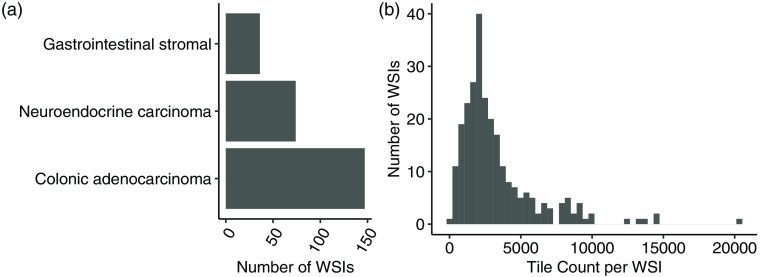
This study collected 257 whole slide scanned H&E-stained images of metastatic liver cancer. Raw H&E images were acquired from the OHSU Knight BioLibrary, uploaded to a secure instance of an OMERO server,19 programmatically accessed through the OpenSlide python API,20 normalized with established methods to overcome known inconsistencies in the H&E-staining process,21 and tiled into nonoverlapping patches of necessary to accommodate the utilized deep learning architecture. Tiles whose mean three-channel, 8-bit intensities were greater than 240 were filtered out as white noninformative background. The total training data set is composed of 20,000 nonoverlapping tiles from tumor tissue within the H&E-scanned images. Each image in the dataset is annotated with clinically determined metastatic origin labels informed by clinical information, pathological inspection of tissue sample, and IHC profiling. Clinical annotations were summarized into three distinct subgroups by a clinical practitioner, which are summarized in Fig. 1. Annotations of tumor regions within 28 whole-slide H&E images were generated by a board-certified pathologist and collected using PathViewer, an interactive utility for the collection and storage of pathological annotations.
Fig. 1.
(a) Summary of the acquired dataset composed of WSIs each containing metastatic tissue originating from one of three sites of interest. (b) Distribution of nonoverlapping tile counts in each WSI with mean count 3300 tiles per WSI.
2.2. Learning Approach
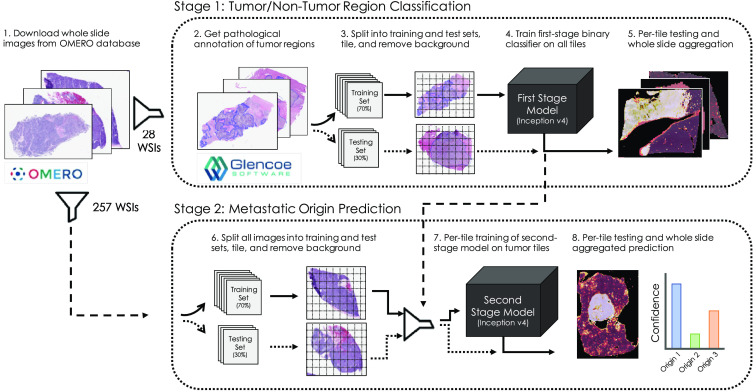
Our approach is composed of two deep neural networks that operate in series. The first stage model is trained to pass through tiles containing cancerous tissue from WSIs and filter out tiles containing normal liver. A second stage model is then trained to predict a single label of metastatic origin for each tile in the dataset. Individual per-tile predictions are then aggregated within their respective WSI and averaged to compute a single prediction for the WSI. A diagram illustrating the basic workflow of our approach is shown in Fig. 2.
Fig. 2.
Deep learning-based approach to leverage pathological annotation of tumor region to isolate and localize tumor tissue from a WSI and generate predictions of metastatic origin.
In the first stage of our approach, pathologist annotations of tumor regions are employed to train a binary classifier to predict whether a given tile of H&E image is either tumor or nontumor tissue. A second-stage classification model is then trained on just the tumor portions of images to predict metastatic origin based on clinically determined whole-slide labels. In all cases, the predictions from the models are reassembled into probabilistic heatmaps over the WSI, enabling a rapid assessment of spatial characteristics driving predictive reasoning. Both first and second stage models utilize the inception v4 deep learning architecture, which is optimized to capture morphological and architectural features on varying scales with high efficiency and has been shown to achieve human-level prediction capability on the ImageNet dataset.22 For the first and second stage models, we randomly assigned 30% of the 28 and 257 WSIs, respectively, to held-out test sets used for model validation. Deep learning models and training routines were developed in Keras with Tensorflow backend23 and trained undergoing cyclic learning rates24 with base learning rate of 0.001 and using the Adam optimizer.25 To mitigate learned bias due to class imbalance, we utilize training data generators designed specifically to class-balance with oversampling each batch of training. Models were trained from scratch on NVIDIA V100 GPUs made available through the Exacloud HPC resource at Oregon Health and Science University. The code used to generate the results and figures is available in GitHub repository: www.github.com/schaugf/NEMO.
3. Results
3.1. Quantitative Localization of Liver Cancer in Whole Slide Images
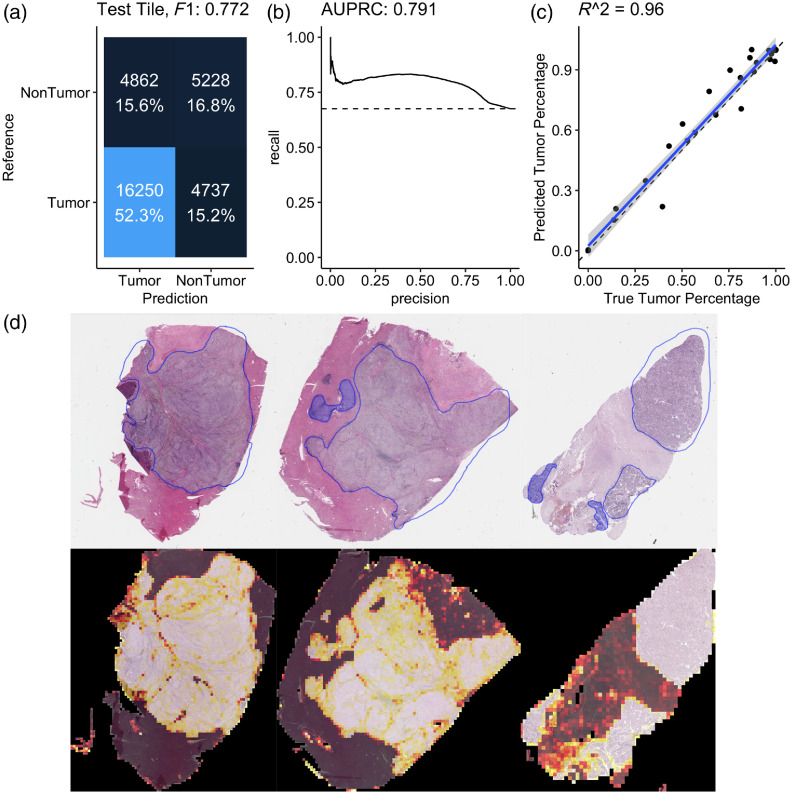
The first-stage model is a tumor tile binary classifier that generates a prediction between 0 and 1 for each tile in the dataset in which a 1 corresponded to perfect confidence that a tile was of tumor tissue and in which a 0 corresponded to perfect confidence that the tile was of normal or stromal tissue. This model achieved an area under the precision–recall curve of 0.791 under the receiver operator characteristics curve, which was sufficient to establish good correlation () between clinical estimation and our model’s estimates of tumor purity (percent tumor in the WSI) as shown in Fig. 3. Further, visual comparisons between the pathological tumor annotation and our model’s predictions illustrate spatial concordance between the drawn tumor-bounding mask and our model’s predictions. Once trained, the tumor-region identifying model was deployed on the entire remaining dataset to include only tiles containing cancerous tissue. Several practical considerations contribute to our model’s failure to perfectly reflect pathological annotation, including damaged tissue, necrosis, and stromal regions in the WSI. Because our approach in this case is limited to 28 WSIs, we anticipate greater data volume would improve robustness of our model to these and other tissue-specific morphological features.
Fig. 3.
(a) Confusion matrix from the held-out testing set for a tumor/nontumor predictive model illustrating score of 0.772 in the classification task. (b) Precision–recall curve with area under the curve of 0.791. (c) Comparison between the true tumor purity in the sample inferred from the pathological annotation (-axis) versus the inferred tumor purity from the model’s output (-axis) with strong correlation (). (d) Three examples from the held-out testing set with pathological annotation of tumor regions outlined in blue (top) and corresponding model predictions estimating regions of WSIs that contain tumor tissue (bottom) illustrating concordance between the pathological annotation of tumor region with the outcome of our model. In these illustrations, a brighter color intensity corresponds to higher probability that the underlying tile was labeled as being of tumor by the trained model.
3.2. Quantitative Whole Slide Image Classification of Metastatic Origin
After the first stage identifies regions of the H&E images that are tumor, the second-stage model learns to classify those tiles according to their metastatic origin. A second inception v4 deep neural network was designed to generate a three-class prediction for each tile in the training set as belonging to either a colonic adenocarcinoma, gastrointestinal stromal, or neuroendocrine carcinoma. WSI predictions aggregated across all corresponding tumor tiles achieved an score of 0.875 on the held-out testing set of WSIs, having failed to correctly classify 5 out of the 51 held-out testing samples. Class-specific statistics shown in Table 1 quantify classification performance metrics for the metastatic origin prediction model. Confusion matrices of both WSI and per-tile predictions are shown in Fig. 4.
Table 1.
Class-specific statistics of both the tumor identification and three-way origin classification task.
| Sensitivity | Specificity | Pos Pred value | Neg Pred value | Precision | Recall | ||
|---|---|---|---|---|---|---|---|
| Tumor identification | 0.77 | 0.52 | 0.77 | 0.53 | 0.77 | 0.77 | 0.77 |
| Colonic adenocarcinoma | 1.00 | 0.83 | 0.88 | 1.00 | 0.88 | 1.00 | 0.93 |
| Neuroendocrine carcinoma | 0.79 | 1.00 | 1.00 | 0.92 | 1.00 | 0.79 | 0.88 |
| Gastrointestinal stromal | 0.78 | 0.98 | 0.87 | 0.95 | 0.88 | 0.78 | 0.82 |
Fig. 4.
(a) Confusion matrix of WSI prediction on a held-out test set. (b) Confusion matrix of tile-based predictions. (c) Failure cases with respect to the inferred tumor purity (percentage of the WSI that contains tumor tissue) in the sample on the -axis (fraction of tiles predicted to be tumor) and the model’s output confidence in its prediction on the -axis.
Several technical factors were associated with incorrect predictions, including slide blurring, tissue folding, and low tumor purity. Our model’s confidence was lower for samples that it incorrectly classified, as shown in Fig. 4, though one sample was incorrectly classified with 86% confidence, which was driven by misclassified stromal tissue present in the H&E slide. Individual tiles associated with highly confident predictions for each class are shown in Fig. 5. Pathological inspection of these tiles suggests that tiles associated with highly confident class predictions present pathological features that guide diagnoses, as the first row contains tiles presenting features associated with primarily spindle-type gastrointestinal stromal tumors and the third row presenting typical well-differentiated neuroendocrine carcinomas. The first two images in the second row represent dirty necrotic tissue, which, among the three diseases under consideration, tends to be associated with colonic adenocarcinomas. However, this type of feature is not explicitly associated with cancer and so should be interpreted with caution. Importantly, this approach obviates the need for pathological region annotation beyond what was required to train the first-stage model.
Fig. 5.
Example tiles correctly classified by the model with high confidence in which each row is a distinct class (gastrointestinal stromal, colonic adenocarcinoma, and neuroendocrine carcinoma in rows 1, 2, and 3, respectively).
3.3. Clinical Benchmark Comparison Study
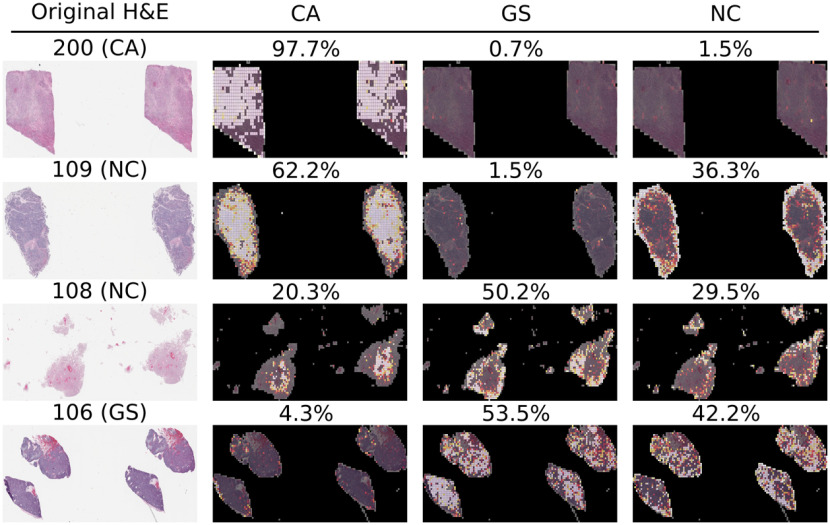
A study was developed to benchmark our approach to clinical practitioners. This study recruited three board-certified pathologists to independently classify each of the 51 WSI samples in the held-out test set according to their metastatic origin. Each participant independently incorrectly classified 3, 4, and 5 samples each, and our neural network model missed five samples from the held-out test set. Table 2 summarizes the 11 samples that were missed by either the model or by at least one pathologist and their respective predictions. Interestingly, only two of the misclassified samples by the model were correctly classified by all three pathologists. Figure 6 illustrates a selected sample classified correctly by the model and all three pathologists, a sample missed by the model that the pathologists all got correct, a sample missed by both the model and at least one pathologist, and a sample for which the model was correct but at least one pathologist made an incorrect classification. All examples illustrate the raw H&E image and three heatmaps generated by the model for each of the three-way predictions in which a brighter color corresponds to a higher confidence in the model’s prediction for each class. Importantly, predictions are only available for tiles that the first-stage of our model classified as tumor tissue, as nontumor tiles were filtered out of the metastatic origin prediction task. Although the failure cases are diverse, probabilistic overlays of metastatic origin prediction may facilitate faster and more efficient examination of these tissue sections in clinical decision making processes.
Table 2.
Slides misclassified by either the model or at least one pathologist. GS, gastrointestinal stromal; CA, colonic adenocarcinoma; NC, neuroendocrine carcinoma. Misclassifications are highlighted in bold text.
| Slide alias | Ground truth | Model | Path1 | Path2 | Path3 |
|---|---|---|---|---|---|
| 101 | CA | CA | CA | CA | NC |
| 102 | CA | CA | CA | CA | NC |
| 103 | CA | CA | CA | NC | GS |
| 104 | CA | CA | NC | NC | CA |
| 105 | GS | CA | GS | GS | GS |
| 106 | GS | GS | GS | GS | NC |
| 107 | GS | CA | GS | GS | GS |
| 108 | NC | GS | GS | NC | GS |
| 109 | NC | CA | NC | NC | NC |
| 110 | NC | NC | NC | CA | NC |
| 111 | NC | CA | CA | CA | NC |
Fig. 6.
Example misclassified H&E slides with associated annotations from the second-stage model illustrating spatially resolved localized predictions of metastatic origin. In these example images, brighter colors are associated with more confident class-specific predictions. First row: Sample correctly predicted by the model and all three pathologists. Second row: Sample missed by the model that all three pathologists got correct. Third row: Example missed by both the model and at least one pathologist. Fourth row: Example missed by at least one pathologist that the model got correct. GS, gastrointestinal stromal; CA, colonic adenocarcinoma; NC, neuroendocrine carcinoma. The complete dataset of all high-resolution WSIs and their associated colored prediction heatmaps are available upon request.
4. Discussion
This work presents a deep learning-based approach designed to predict the origin of metastatic liver cancer using a two-stage serial model composed of a first model trained to identify tumor from nontumor within H&E sections of metastatic liver tissue based on pathologists annotation and a second-stage model that learns to predict the metastatic origin of individual patches of tumor tissue and aggregates those results into predictions over WSIs. We illustrate through a clinical benchmark comparison that our approach is within performance criteria of board-certified pathologists, suggesting that these types of systems may be capable of generating rapid, first-pass assessments of metastatic origin in the absence of detailed clinical information or comprehensive molecular profiling assay. We believe this type of data-driven visualization augmentation provides an additional layer of information that may facilitate the speed and ease of generating final decisions by clinical care providers.
Although these results illustrate feasibility of our approach, several significant limitations remain. Principally, this analysis was data-limited to only three most-prevalent sources of metastatic origin when in practice metastases can and do originate from a broad variety of biological sources. A future direction will seek to leverage H&E-stained tissue sections of primary disease site and impose a transfer learning approach to predict the primary site of liver cancer in situ, without relying on training data drawn exclusively from liver metastases. Second, we observe that the first-stage model may be inflexible to alternative sites of metastatic tissue. Instead of training a model to identify tiles containing cancer tissue in liver, a more generalizable model may be trained on a broad diversity of primary cancers and regularized appropriately to identify cancer independently of the host tissue. Third, although our model was shown to perform similarly to board-certified pathologists, we have not thoroughly considered the manner by which these types of deep learning models might optimally improve current workflows of practicing pathologists. We believe that robust translation of deep learning systems such as the one presented in this paper may continue to supplement and augment clinical decision-making processes dependent on medical image analysis.
The generalizability of both first- and second-stage models would likely be improved with the additional training data. Currently, this study was limited to a few hundred WSIs in total for which pathological annotations were made available for only a few dozen. Although practical logistical issues prevent high-throughput annotation collection and processing, we believe that for this and similar types of systems to reach their full potential, robust integration of current biobank and other data repositories with engineered data-processing pipelines must be established to facilitate rapid and reproducible research. Future directions will continue to widen the volume of data readily applicable to this type of approach while concurrently considering greater variety of metastatic origin classes. While this approach is still in early stages, we nevertheless remain optimistic that future developments of computer vision systems may significantly contribute to improving the efficiency and efficacy of pathological interrogation of metastatic patient tissue.
Acknowledgments
This work was supported in part by the National Cancer Institute (U54CA209988), the OHSU Center for Spatial Systems Biomedicine, the Knight Diagnostic Laboratories, and a Biomedical Innovation Program Award from the Oregon Clinical and Translational Research Institute. We extend our thanks to the staff at the OHSU Knight BioLibrary for their support in data access and dissemination. Further, we gratefully acknowledge the resources of the Exacloud high-performance computing environment developed jointly by OHSU and Intel and the technical support of the OHSU Advanced Computing Center.
Biography
Biographies of the authors are not available.
Disclosures
No conflicts of interest, financial or otherwise, are declared by the authors.
Contributor Information
Geoffrey F. Schau, Email: schau@ohsu.edu.
Erik A. Burlingame, Email: burlinge@ohsu.edu.
Guillaume Thibault, Email: thibaulg@ohsu.edu.
Tauangtham Anekpuritanang, Email: anekpuri@ohsu.edu.
Ying Wang, Email: wanyi@ohsu.edu.
Joe W. Gray, Email: grayjo@ohsu.edu.
Christopher Corless, Email: corlessc@ohsu.edu.
Young H. Chang, Email: chanyo@ohsu.edu.
References
- 1.Ananthakrishnan A., et al. , “Epidemiology of primary and secondary liver cancers,” Semin. Interventional Radiol. 23(1), 47–63 (2006). 10.1055/s-2006-939841 [DOI] [PMC free article] [PubMed] [Google Scholar]
- 2.Mohammadian M., et al. , “Liver cancer in the world: epidemiology, incidence, mortality and risk factors,” World Cancer Res. J. 5(2), 1–8 (2018). [Google Scholar]
- 3.Djuric U., et al. , “Precision histology: how deep learning is poised to revitalize histomorphology for personalized cancer care,” NPJ Precis. Oncol. 1, 22 (2017). 10.1038/s41698-017-0022-1 [DOI] [PMC free article] [PubMed] [Google Scholar]
- 4.Litjens G., et al. , “Deep learning as a tool for increased accuracy and efficiency of histopathological diagnosis,” Sci. Rep. 6, 26286 (2016). 10.1038/srep26286 [DOI] [PMC free article] [PubMed] [Google Scholar]
- 5.Kather J. N., “Predicting survival from colorectal cancer histology slides using deep learning: a retrospective multicenter study,” PLoS Med. 16, e1002730 (2019). 10.1371/journal.pmed.1002730 [DOI] [PMC free article] [PubMed] [Google Scholar]
- 6.Cruz-Roa A., et al. , “Accurate and reproducible invasive breast cancer detection in whole-slide images: a deep learning approach for quantifying tumor extent,” Sci. Rep. 7, 46450 (2017). 10.1038/srep46450 [DOI] [PMC free article] [PubMed] [Google Scholar]
- 7.Coudray N., et al. , “Classification and mutation prediction from non-small cell lung cancer histopathology images using deep learning,” Nat. Med. 24, 1559–1567 (2018). 10.1038/s41591-018-0177-5 [DOI] [PMC free article] [PubMed] [Google Scholar]
- 8.Wang D., et al. , “Deep learning for identifying metastatic breast cancer,” arXiv, 1–6 (2016).
- 9.Nirschl J. J., et al. , “A deep-learning classifier identifies patients with clinical heart failure using whole-slide images of H & E tissue,” PLoS One 13, e0192726 (2018). 10.1371/journal.pone.0192726 [DOI] [PMC free article] [PubMed] [Google Scholar]
- 10.Korbar B., et al. , “Deep learning for classification of colorectal polyps on whole-slide images,” J. Pathol. Inform. 8, 30 (2017). 10.4103/jpi.jpi_34_17 [DOI] [PMC free article] [PubMed] [Google Scholar]
- 11.Al-Milaji Z., et al. , “Integrating segmentation with deep learning for enhanced classification of epithelial and stromal tissues in H & E images,” Pattern Recognit. Lett. 119, 214–221 (2019). 10.1016/j.patrec.2017.09.015 [DOI] [Google Scholar]
- 12.Zheng Y., et al. , “Feature extraction from histopathological images based on nucleus-guided convolutional neural network for breast lesion classification,” Pattern Recognit. 71, 14–25 (2017). 10.1016/j.patcog.2017.05.010 [DOI] [Google Scholar]
- 13.Garcia-Garcia A., et al. , “A review on deep learning techniques applied to semantic segmentation,” arXiv, 1–23 (2017).
- 14.Angermueller C., et al. , “Deep learning for computational biology,” Mol. Syst. Biol. 12, 878 (2016). 10.15252/msb.20156651 [DOI] [PMC free article] [PubMed] [Google Scholar]
- 15.Dahab D. A., Ghoniemy S. S. A., Selim G. M., “Automated brain tumor detection and identification using image processing and probabilistic neural network techniques,” Int. J. Image Process. Vis. Commun. 1(2), 1–8 (2012). [Google Scholar]
- 16.Havaei M., et al. , “Brain tumor segmentation with deep neural networks,” Med. Image Anal. 35, 18–31 (2017). 10.1016/j.media.2016.05.004 [DOI] [PubMed] [Google Scholar]
- 17.Ching T., et al. , “Opportunities and obstacles for deep learning in biology and medicine,” bioRxiv (2017). [DOI] [PMC free article] [PubMed]
- 18.Khalid M., et al. , “Series digital oncology 1 digital pathology and artificial intelligence,” Lancet Oncol. 20(5), e253–e261 (2019). 10.1016/S1470-2045(19)30154-8 [DOI] [PMC free article] [PubMed] [Google Scholar]
- 19.Allan C., et al. , “OMERO: flexible, model-driven data management for experimental biology,” Nat. Methods 9, 245–253 (2012). 10.1038/nmeth.1896 [DOI] [PMC free article] [PubMed] [Google Scholar]
- 20.Goode A., et al. , “OpenSlide: a vendor-neutral software foundation for digital pathology,” J. Pathol. Inf. 4(1), 27 (2013). 10.4103/2153-3539.119005 [DOI] [PMC free article] [PubMed] [Google Scholar]
- 21.Macenko M., et al. , “A method for normalizing histology slides for quantitative analysis,” in Int. Symp. Biomed. Imaging, pp. 1107–1110 (2009). [Google Scholar]
- 22.Längkvist M., Karlsson L., Loutfi A., “Inception-v4, inception-ResNet and the impact of residual connections on learning,” Pattern Recognit. Lett. 42(1), 11–24 (2016). 10.1016/j.patrec.2014.01.008 [DOI] [Google Scholar]
- 23.Abadi M., et al. , “TensorFlow: a system for large-scale machine learning,” in 12th USENIX Symp. Operating Syst. Des. Implementation (OSDI ’16), pp. 265–284 (2016). [Google Scholar]
- 24.Smith L. N., “Cyclical learning rates for training neural networks,” in IEEE Winter Conf. Appl. Comput. Vision (WACV), pp. 464–472 (2015). 10.1109/WACV.2017.58 [DOI] [Google Scholar]
- 25.Kingma D. P., Ba J., “Adam: a method for stochastic optimization,” in Int. Conf. Learn. Represent., pp. 1–15 (2015). [Google Scholar]


