

Abstract
Objective:
Although previous studies have identified variation in quality lung cancer care, existing quality metrics may not fully capture the complexity of cancer care. The Thoracic Surgery Outcomes Research Network recently developed quality measures to address this. We evaluated baseline adherence to these measures and identified factors associated with adherence.
Methods:
Patients with pathologic stage I and II non-small cell lung cancer from 2010 to 2015 were identified in the National Cancer Database. Patient-level and hospital-level adherence to 7 quality measures was calculated. Goal hospital adherence threshold was 85%. Factors influencing adherence were identified using multilevel logistic regression.
Results:
We identified 253,182 patients from 1324 hospitals. Lymph node sampling was performed in 91% of patients nationally, but only 76% of hospitals met the 85% adherence mark. Similarly, 89% of T1b (seventh edition staging) tumors had anatomic resection, with 69% hospital-level adherence. Sixty-nine percent of pathologic stage II patients were recommended chemotherapy, with only 23% hospitals adherent. Eighty-three percent of patients had biopsy before primary radiation, with 64% hospitals adherent. Higher volume and academic institutions were associated with nonadherence to adjuvant chemotherapy and radiation therapy measures. Conversely, lower volume and nonacademic institutions were associated with inadequate nodal sampling and nonanatomic resection.
Conclusions:
Significant gaps continue to exist in the delivery of quality care to patients with early-stage lung cancer. High-volume academic hospitals had higher adherence for surgical care measures, but lower rates for coordination of care measures. This requires further investigation, but suggests targets for quality improvement may vary by institution type.
Keywords: lung cancer, quality, process measure, outcomes
Lung cancer continues to be the leading cause of cancer-related death in the United States, with 228,150 new cases and 142,670 deaths estimated in 2019.1 Modern lung cancer care is increasingly multidisciplinary and complex, with patients exposed to a variety of specialists, tests, and treatments. Many organizations and societies have published evidence-based guidelines and recommendations for lung cancer care. However, patients frequently do not receive care that is in line with these best practices.2–6 To ensure patients are receiving guideline-appropriate care, certain quality measures have been proposed, such as the Commission on Cancer’s (CoC) Quality of Care Measures.7,8 While these measures identify some gaps in the care of lung cancer, they may not completely capture the complexity of lung cancer care in a clinically meaningful way.
The Thoracic Surgery Outcomes Research Network (ThORN) is a multi-institutional collaborative dedicated to advancing the practice of general thoracic surgery through health services and outcomes research. To address limitations of existing quality metrics, this group developed a list of quality measures for the treatment of non–small cell lung cancer (NSCLC) (Table E1).9 These were developed through a national modified-Delphi expert consensus process,10 with experts from multiple disciplines including thoracic surgery, medical oncology, and radiation oncology. Candidate measures were developed from existing clinical care guidelines, published quality measures, and review of the published and gray literature. A modified-Delphi process was used to identify quality measures of greatest importance to the provision of care to patients with NSCLC. The measures encompass all aspects and phases of care, from diagnosis and staging, through treatment, to follow-up and surveillance.9
Because these measures are newly developed, baseline adherence is unknown. Identifying gaps in baseline measure adherence is the necessary first step in effective quality improvement to increase guideline-concordant care. Thus, we sought to evaluate baseline adherence to these newly developed quality measures. We focused specifically on those measures pertaining to the care of patients with stage Ia through IIb lung cancer that could be assessed using the National Cancer Database (NCDB). Additionally, we evaluated institutional factors associated with adherence to each measure.
METHODS
We retrospectively reviewed the NCDB from 2010 to 2015 to identify all patients with a primary diagnosis of NSCLC. The NCDB is the world’s largest cancer registry, containing all cases of cancers diagnosed in the United States at CoC-accredited facilities, representing about 82% of lung cancer diagnoses.11 Data are entered into the NCDB by specifically trained certified tumor registrars, who systematically review institutional records and query treating physicians for missing data. Data undergoe extensive quality assurance and review.11 All treatment variables pertaining to the first course of therapy are recorded, including neoadjuvant and adjuvant therapies, but not including recurrences.12 From the NCDB, we identified all patients with stage Ia and IIb NSCLC based on the seventh edition of the American Joint Committee on Cancer (AJCC) staging manual.13 Pathologic staging was used preferentially when available, with clinical staging used otherwise. Patients without staging data and patients with metastatic cancer to the lung were excluded. From this baseline group, subgroups for analysis were created based on additional inclusion and exclusion criteria for each measure.
Quality Measures
Of the 18 ThORN quality measures for early stage NSCLC, 7 could feasibly be assessed using existing data in the NCDB (Table 1).9 The first 2 are categorized as patient evaluation measures. Measure 1 evaluates documentation of clinical stage before treatment for NSCLC. All patients who received any form of treatment were included in this measure. Measure 2 assesses pre- or intraoperative tissue diagnosis in patients undergoing lobectomy or larger resection. All patients who undergo lobectomy or larger (eg, bilobectomy or pneumonectomy) are included in assessing that measure.
TABLE 1.
Thoracic Surgery Outcomes Research Network quality measures for stage I and II non–small cell lung cancer (NSCLC)
| Measure | Description |
|---|---|
| 1 | If a patient has known/suspected NSCLC, clinical American Joint Committee on Cancer stage* should be documented before initiation of treatment. |
| 2 | If a patient undergoes lobectomy or larger resection, pre- or intraoperative tissue diagnosis should be confirmed or reasons for not achieving documented. |
| 3 | If a resection is performed, there should be an attempt at lymph node sampling. |
| 4 | If a patient undergoes resection for stage T1b† or greater tumor, an anatomic pulmonary resection should be performed. |
| 5 | If surgical resection is performed, an R0 resection should be achieved. |
| 6 | If a patient has pathologic stage II or higher, chemotherapy should be recommended or reason for no recommendation documented. |
| 7 | If a patient receives radiation therapy to the lung (excluding adjuvant radiation), then pathologic diagnosis should be confirmed or attempted before treatment. |
NSCLC, Non–small cell lung cancer
American Joint Committee on Cancer seventh edition staging was used in this study.13
Tumors 2 to 3 cm.
The next 3 measures evaluate surgical care of patients with early-stage NSCLC. Measure 3 evaluates lymph node sampling at the time of resection, and includes all patients who undergo any type of lung resection. Of note, the original measure called for at least 2 N2 stations and any N1 station to be sampled; however, specific information on nodal stations is not available in NCDB. Measure 4 evaluates whether an anatomic resection (eg, segmentectomy, lobectomy, bilobectomy, or pneumonectomy) was performed for patients with pathologic stage T1b or greater disease. We performed sensitivity analyses using size criteria (>2 cm or >3 cm) in place of documented T1b staging for this measure. Measure 5 assesses R0 resection in all patients who undergo surgery with curative intent.
The final 2 measures address multidisciplinary coordination of care for early-stage NSCLC. Measure 6 evaluates whether patients with pathologic stage II cancers were appropriately referred for adjuvant chemotherapy. Whereas the NCDB does not document referrals, it does record whether chemotherapy was recommended to a patient. In evaluating this measure, patients documented not to be candidates for chemotherapy due to comorbidities or patient refusal are considered compliant. Measure 7 assesses whether patients had an attempted biopsy before definitive ablative radiotherapy. This was determined by comparing the start date of radiation and the date of diagnostic or staging procedure reported in the NCDB. For this measure, patients who received external beam radiation to the lung parenchyma only (ie, excluding chest wall and mediastinal radiation) are included.
Patient and Hospital Factors
Patient factors abstracted from the NCDB include age, sex, race, insurance status, Charlson comorbidity score, and treatment at multiple facilities. Age was categorized into 4 groups (18-55 years, 56-65 years, 66-75 years, and >75 years). Race was categorized as White, Black, or other. Insurance status was categorized as private, Medicare, Medicaid or other government insurance, and uninsured. The Charlson comorbidity score is recorded as 0, 1, 2, or ≥3. Treatment at more than one facility was included as a predictor due to its potential effects on processes of care.
Hospital factors evaluated included yearly institutional lung cancer volume, academic status, geographic location, and metropolitan or nonmetropolitan area. Distance patients traveled to treating hospital was also included (<5 miles, 5-10 miles, or >10 miles) as an additional measure of hospital location and patient population. Average yearly lung cancer volume was included as quartiles. Geographic location is reported as 9 categories by the NCDB, which were consolidated into 4 regions (South Atlantic, North Atlantic, Central, and Mountain/Pacific).
Statistical Analysis
Adherence with patient-level measures was calculated as the percentage of all patients nationwide who met the measure over all eligible for that particular measure. Hospital-level adherence was calculated as the percentage of patients treated at a hospital who met the measure criteria over all eligible patients at that hospital. Hospitals were considered to pass the measure if they provided measure-adherent care in at least 85% of cases, corresponding to the threshold used by the CoC to assess adherence to Quality of Care Measures for program accreditation.8
We developed a model for each of the 7 measures, with the outcome being adherence to the measure for each patient eligible for evaluation for that particular measure. Multilevel mixed-effect models (SAS PROC GLIMMIX), including hospital as a random effect were used, including all hospital and patient factors listed above as fixed effects (Appendix E1). These factors were all determined a priori to be clinically important. As a sensitivity analysis, the same models were constructed without categorizing continuous predictors (ie, age, distance, and volume). Interactions between patient risk factors (ie, age and comorbidities) and institutional factors (ie, academic or not and volume) were evaluated for significant effects with regard to measure adherence. In addition, we calculated intraclass correlation and proportional change of variance using estimates of the between-hospital variance from each of the 7 hierarchical models, to quantify the proportion of observed variability attributable to hospital-level differences.14–16
Finally, we evaluated the associations between adherence to each measure and survival using Cox proportional hazards modeling with robust sandwich covariance matrix estimates to account for intracluster dependence, with adjustment for all prespecified patient and hospital factors. All analyses were performed in SAS version 9.4 (SAS Institute, Inc, Cary, NC), using a threshold of P < .05 for significance.
RESULTS
A total of 253,182 patients treated at 1324 hospitals for pathologic stage I or II NSCLC from 2010 to 2015 were identified in the NCDB. The majority of our cohort was White (88.0%), and older than age 65 years (69.6%) (Table 2). Most patients had either Medicare (68.7%) or private insurance (23.1%), with a small minority having Medicaid (6.5%) or no insurance (1.6%). Only 15.6% of patients had 2 or more comorbidities. Patient and hospital characteristics by adherence to each measure is reported in Table E2.
TABLE 2.
Overall patient and hospital characteristics
| Characteristic | n (%) |
|---|---|
| Patient (N = 253,182) | |
| Age (y) | |
| 18-55 | 21,413 (8.5) |
| 56-65 | 55,712 (22.0) |
| 66-75 | 97,126 (38.4) |
| >75 | 78,931 (31.2) |
| Race | |
| White | 221,484 (88.0) |
| Black | 23,083 (9.2) |
| Other | 7050 (2.8) |
| Sex | |
| Male | 122,685 (48.5) |
| Female | 130,497 (51.5) |
| Charlson comorbidity score | |
| 0 | 133,167 (52.6) |
| 1 | 80,484 (31.8) |
| 2 | 28,884 (11.4) |
| ≥3 | 10,647 (4.2) |
| Insurance status | |
| Medicare | 171,281 (68.7) |
| Uninsured | 4024 (1.6) |
| Private | 57,651 (23.1) |
| Medicaid | 16,261 (6.5) |
| Cancer stage | |
| I | 185,161 (73.1) |
| II | 68,021 (26.9) |
| Treatment at multiple facilities | |
| No | 212,109 (83.8) |
| Yes | 41,073 (16.2) |
| Distance traveled to hospital (miles) | |
| <5 | 72,339 (28.6) |
| 5-10 | 52,223 (20.6) |
| >10 | 128,620 (50.8) |
| Yearly volume (quartile*) | |
| 1 | 10,392 (4.1) |
| 2 | 29,664 (11.7) |
| 3 | 60,319 (23.8) |
| 4 | 152,807 (60.4) |
| Institution type | |
| Community | 162,468 (64.3) |
| Academic | 90,136 (35.7) |
| Geographic location | |
| South Atlantic | 57,853 (22.9) |
| North Atlantic | 55,742 (22.1) |
| Central | 88,231 (34.9) |
| Mountain/Pacific | 50,778 (20.1) |
| Metropolitan area | |
| Nonmetro | 44,171 (17.9) |
| Metro | 202,651 (82.1) |
|
| |
| Hospital (n = 1324) | |
| Yearly volume (quartile*) | |
| 1 | 354 (26.7) |
| 2 | 324 (24.5) |
| 3 | 326 (24.6) |
| 4 | 320 (24.2) |
| Institution type | |
| Community | 1096 (82.8) |
| Academic | 228 (17.2) |
| Geographic location | |
| South Atlantic | 274 (20.7) |
| North Atlantic | 266 (20.1) |
| Central | 452 (34.1) |
| Mountain/Pacific | 332 (25.1) |
Quartiles were 1 (1-10), 2 (11-23), 3 (22-44), and 4 (≥45).
Eighty-two percent of patients lived in a metropolitan area, and approximately half of all patients (50.8%) traveled more than 10 miles to their treating hospital. Only 4.1% of patients were treated at hospitals in the lowest quartile of lung cancer volume, whereas 60.6% were treated at hospitals in the highest volume quartile (Figure E1). The majority of treating hospitals (82.8%) were nonacademic medical centers (Table 2).
Patient-Level Adherence
Overall patient-level adherence with the listed measures was high (Table 3). Adherence was highest for measures related to patient evaluation, with 93.0% of 235,642 patients treated for pathologic stage I and II NSCLC having documented clinical stage, and 99.0% of the 120,937 patients undergoing lobectomy (or larger) having a tissue diagnosis. Patient-level adherence to each of 3 surgical measures assessed was also relatively high. Conversely, adherence to measures assessing various aspects of care coordination was significantly lower. Adjuvant chemotherapy was recommended for only 69.3% of 38,790 patients with pathologic stage II or higher disease and only 83.1% of the 49,373 patients who received primary radiotherapy had an attempted biopsy before therapy.
TABLE 3.
Patient- and hospital-level adherence to Thoracic Surgery Outcomes Research Network quality measures
| Patient-level |
Hospital-level |
||||
|---|---|---|---|---|---|
| Measure No. | Measure | Measure-adherent | Patients eligible | Measure-adherent | Hospitals eligible |
| 1 | If a patient has known/suspected non–small cell lung cancer, clinical American Joint Committee on Cancer stage should be documented before initiation of treatment | 219,181 (93.0) | 235,642 | 1164 (87.9) | 1324 |
|
| |||||
| 2 | If a patient undergoes lobectomy or larger resection, pre- or intraoperative tissue diagnosis should be confirmed or reasons for not achieving documented | 119,757 (99.0) | 120,937 | 1292 (98.7) | 1309 |
|
| |||||
| 3 | If a resection is performed, there should be an attempt at lymph node sampling | 140,852 (90.5) | 155,565 | 996 (76.0) | 1311 |
|
| |||||
| 4 | If a patient undergoes resection for stage T1b or greater tumor, an anatomic pulmonary resection should be performed | 68,573 (88.6) | 77,387 | 906 (69.4) | 1305 |
|
| |||||
| 5 | If surgical resection is performed, an R0 resection should be achieved | 148,085 (96.2) | 153,976 | 1259 (96.1) | 1310 |
|
| |||||
| 6 | If a patient has pathologic stage II or higher, chemotherapy should be recommended or reason for no recommendation documented | 26,898 (69.3) | 38,790 | 297 (23.2) | 1279 |
|
| |||||
| 7 | If a patient receives radiation therapy to the lung (excluding adjuvant radiation), then pathologic diagnosis should be confirmed or attempted before treatment | 41,031 (83.1) | 49,373 | 808 (64.4) | 1255 |
Values are presented as n (%) or n. Number of patients eligible reflects the number of patients in any hospital nationally who met inclusion criteria for that specific measure. A hospital was eligible for the hospital-level analysis if at least 1 patient treated at that hospital met inclusion criteria for a specific measure. Total cohort: N = 253,182 patients and N = 1324 hospitals. American Joint Committee on Cancer seventh edition staging was used (T1b = tumors 2-3 cm).13
Hospital-Level Adherence
Examination of hospital-level performance identified significant variability in adherence across almost all measures (Figure 1). Adherence was above the 85% threshold used by the CoC in assessment of cancer programs for only 3 measures (2 evaluation and 1 surgical) (Table 3).
FIGURE 1.
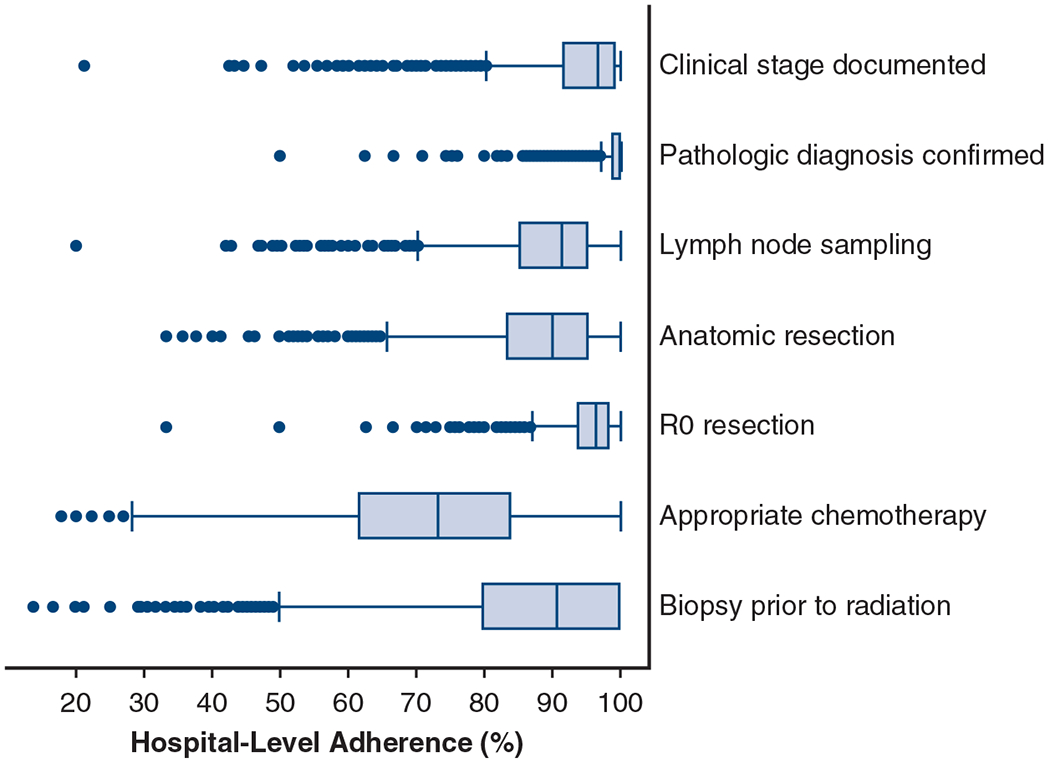
Distribution of hospital-level adherence to Thoracic Surgery Outcomes Research Network quality measures for stage I and II non–small cell lung cancer. Box-and-whiskers plots depicting median, interquartile range, and outliers of hospital-level adherence to each quality measure. The whiskers extend to ±1.5 times the interquartile range. Hospital-level adherence refers to the percentage of patients in a given hospital that were adherent to the measure. Any hospital with at least 1 eligible case for each measure is included, with each point representing a single hospital. Eligible hospitals for each measure, respectively: n = 1324, n = 1309, n = 1311, n = 1305, n = 1310, n = 1279, and n = 1255.
Factors Associated With Adherence
A hierarchical multivariable logistic regression model was constructed for each of the measures to identify predictors of adherence (Table 4). An evaluation of components of variance derived from the hierarchical regression models revealed that between-hospital variation was responsible for differing degrees of total variation in measure adherence (Table E3). Notably, hospital factors were responsible for 14% of the variation in adherence to lymph node sampling, 12% for anatomic resection, and 26% for biopsy before radiation (Appendix E2).
TABLE 4.
Factors associated with adherence to Thoracic Surgery Outcomes Research Network quality measures for stage I and II non–small cell lung cancer
| Measure 1: Clinical stage documented |
Measure 2: Confirm pathologic diagnosis |
Measure 3: Lymph node sampling |
Measure 4: Anatomic resection for T1b |
|||||
|---|---|---|---|---|---|---|---|---|
| Factor | OR (95% CI) | P value | OR (95% CI) | P value | OR (95% CI) | P value | OR (95% CI) | P value |
| Average yearly volume (quartile*) | .01 | <.01 | <.01 | <.01 | ||||
| 1 | 1.46 (1.13-1.88) | 0.44 (0.30-0.65) | 0.56 (0.48-0.66) | 0.63 (0.53-0.75) | ||||
| 2 | 1.12 (0.89-1.39) | 0.79 (0.57-1.09) | 0.70 (0.62-0.80) | 0.81 (0.71-0.93) | ||||
| 3 | 0.99 (0.80-1.21) | 0.97 (0.72-1.30) | 0.77 (0.68-0.87) | 0.87 (0.77-0.99) | ||||
| 4 | Ref | Ref | Ref | Ref | ||||
|
| ||||||||
| Academic hospital | 0.66 (0.54-0.81) | <.01 | 1.03 (0.76-1.38) | .87 | 1.05 (0.92-1.19) | .48 | 0.94 (0.83-1.06) | .32 |
|
| ||||||||
| Distance traveled to hospital (mi) | <.01 | <.01 | .79 | .66 | ||||
| <5 | Ref | Ref | Ref | Ref | ||||
| 5-10 | 0.91 (0.87-0.96) | 1.20 (1.01-1.43) | 1.00 (0.95-1.06) | 0.97 (0.90-1.04) | ||||
| 11-25 | 0.85 (0.81-0.90) | 1.35 (1.14-1.60) | 1.01 (0.96-1.07) | 1.01 (0.94-1.08) | ||||
| >25 | 0.75 (0.71-0.80) | 1.67 (1.34-2.08) | 0.98 (0.92-1.04) | 0.98 (0.90-1.07) | ||||
|
| ||||||||
| Treatment at multiple facilities | 1.12 (1.06-1.17) | <.01 | 0.67 (0.58-0.78) | <.01 | 1.53 (1.44-1.61) | <.01 | 1.17 (1.10-1.25) | <.01 |
|
| ||||||||
| County type | .07 | .31 | .95 | .42 | ||||
| Nonmetro | 0.94 (0.89-1.01) | 0.89 (0.72-1.11) | 1.00 (0.94-1.07) | 0.97 (0.89-1.05) | ||||
| Metro | Ref | Ref | Ref | Ref | ||||
|
| ||||||||
| Geographic location | <.01 | .32 | <.01 | <.01 | ||||
| South Atlantic | 0.63 (0.51-0.78) | 0.97 (0.71-1.33) | 0.80 (0.71-0.91) | 0.77 (0.68-0.88) | ||||
| North Atlantic | 0.65 (0.52-0.81) | 1.23 (0.90-1.68) | 1.04 (0.91-1.19) | 1.04 (0.91-1.18) | ||||
| Central | Ref | Ref | Ref | Ref | ||||
| Mountain/Pacific | 0.49 (0.40-0.59) | 1.23 (0.91-1.67) | 0.94 (0.83-1.06) | 1.14 (1.00-1.29) | ||||
|
| ||||||||
| Female sex | 0.97 (0.94-1.01) | .13 | 1.13 (1.00-1.27) | .06 | 0.95 (0.92-0.99) | .01 | 0.94 (0.90-0.99) | .01 |
|
| ||||||||
| Age (y) | <.01 | .58 | <.01 | <.01 | ||||
| 18-55 | 0.81 (0.76-0.87) | 0.92 (0.73-1.15) | 1.29 (1.20-1.40) | 1.60 (1.44-1.78) | ||||
| 56-65 | 0.97 (0.92-1.02) | 0.98 (0.82-1.17) | 1.09 (1.03-1.15) | 1.20 (1.12-1.29) | ||||
| 66-75 | Ref | Ref | Ref | Ref | ||||
| >75 | 1.45 (1.39-1.52) | 0.90 (0.77-1.06) | 0.75 (0.72-0.78) | 0.69 (0.66-0.73) | ||||
|
| ||||||||
| Race | <.01 | <.01 | <.01 | <.01 | ||||
| White | Ref | Ref | Ref | Ref | ||||
| Black | 1.13 (1.06-1.21) | 0.69 (0.57-0.84) | 0.96 (0.90-1.03) | 0.98 (0.90-1.08) | ||||
| Other | 0.93 (0.84-1.03) | 1.35 (0.89-2.06) | 1.36 (1.21-1.54) | 1.45 (1.23-1.70) | ||||
|
| ||||||||
| Insurance | <.01 | .04 | <.01 | <.01 | ||||
| Uninsured | 1.13 (0.97-1.30) | 0.67 (0.44-1.01) | 1.06 (0.90-1.24) | 0.94 (0.77-1.14) | ||||
| Private | 0.92 (0.88-0.97) | 0.88 (0.74-1.05) | 1.19 (1.13-1.26) | 1.20 (1.12-1.29) | ||||
| Medicaid | 1.21 (1.12-1.31) | 0.73 (0.57-0.94) | 1.01 (0.92-1.10) | 0.95 (0.85-1.06) | ||||
| Medicare | Ref | Ref | Ref | Ref | ||||
|
| ||||||||
| Charlson comorbidity score | <.01 | .01 | <.01 | <.01 | ||||
| 0 | Ref | Ref | Ref | Ref | ||||
| 1 | 1.00 (0.96-1.04) | 1.26 (1.09-1.45) | 0.87 (0.84-0.91) | 0.82 (0.77-0.86) | ||||
| 2 | 1.11 (1.05-1.18) | 1.05 (0.86-1.29) | 0.81 (0.76-0.85) | 0.70 (0.65-0.75) | ||||
| ≥3 | 1.34 (1.21-1.48) | 0.98 (0.71-1.36) | 0.70 (0.64-0.77) | 0.60 (0.53-0.67) | ||||
| Measure 5: R0 resection achieved |
Measure 6: Chemotherapy for stage II |
Measure 7: Biopsy before radiation |
||||||
| OR (95% CI) | P value | OR (95% CI) | P value | OR (95% CI) | P value | |||
|
| ||||||||
| Yearly volume (quartile*) | <.01 | .18 | .15 | |||||
| 1 | 0.75 (0.63-0.89) | 1.19 (1.01-1.41) | 1.23 (0.95-1.59) | |||||
| 2 | 0.78 (0.69-0.88) | 1.09 (0.96-1.23) | 1.00 (0.81-1.24) | |||||
| 3 | 0.90 (0.81-1.00) | 1.03 (0.93-1.15) | 1.19 (0.98-1.46) | |||||
| 4 | Ref | Ref | Ref | |||||
|
| ||||||||
| Academic hospital | 1.09 (0.98-1.21) | .12 | 0.90 (0.81-1.00) | .06 | 0.68 (0.56-0.83) | .01 | ||
|
| ||||||||
| Distance traveled to hospital (mi) | .09 | <.01 | .01 | |||||
| <5 | Ref | Ref | Ref | |||||
| 5-10 | 1.02 (0.94-1.10) | 1.00 (0.93-1.08) | 1.07 (0.99-1.16) | |||||
| 11-25 | 1.08 (1.00-1.16) | 1.00 (0.93-1.07) | 1.04 (0.97-1.13) | |||||
| >25 | 1.11 (1.01-1.22) | 0.83 (0.77-0.90) | 0.92 (0.84-1.01) | |||||
|
| ||||||||
| Treatment at multiple facilities | 0.74 (0.69-0.79) | <.01 | 1.38 (1.29-1.47) | <.01 | 1.53 (1.41-1.65) | <.01 | ||
|
| ||||||||
| County type | .01 | .52 | .53 | |||||
| Nonmetro | 0.89 (0.81-0.97) | 1.03 (0.95-1.11) | 1.03 (0.94-1.13) | |||||
| Metro | Ref | Ref | Ref | |||||
|
| ||||||||
| Geographic location | .01 | <.01 | <.01 | |||||
| South Atlantic | 1.14 (1.01-1.28) | 0.92 (0.81-1.03) | 0.58 (0.47-0.72) | |||||
| North Atlantic | 1.12 (1.00-1.26) | 0.76 (0.67-0.85) | 0.88 (0.71-1.09) | |||||
| Central | Ref | Ref | Ref | |||||
| Mountain/Pacific | 0.94 (0.84-1.05) | 0.65 (0.58-0.73) | 0.60 (0.50-0.74) | |||||
|
| ||||||||
| Female sex | 1.28 (1.22-1.36) | <.01 | 1.03 (0.99-1.08) | .18 | 1.01 (0.96-1.07) | .65 | ||
|
| ||||||||
| Age (y) | <.01 | <.01 | .01 | |||||
| 18-55 | 0.89 (0.80-0.99) | 1.73 (1.56-1.91) | 0.98 (0.84-1.15) | |||||
| 56-65 | 0.97 (0.89-1.05) | 1.35 (1.26-1.45) | 1.06 (0.97-1.16) | |||||
| 66-75 | Ref | Ref | Ref | |||||
| >75 | 0.85 (0.79-0.91) | 0.48 (0.45-0.51) | 1.10 (1.04-1.17) | |||||
|
| ||||||||
| Race | .35 | .56 | <.01 | |||||
| White | Ref | Ref | Ref | |||||
| Black | 0.95 (0.86-1.05) | 1.05 (0.96-1.15) | 1.18 (1.07-1.31) | |||||
| Other | 1.08 (0.91-1.29) | 1.01 (0.87-1.16) | 1.02 (0.84-1.25) | |||||
|
| ||||||||
| Insurance | .15 | <.01 | .03 | |||||
| Uninsured | 0.89 (0.73-1.10) | 1.03 (0.86-1.24) | 1.18 (0.89-1.56) | |||||
| Private | 1.05 (0.97-1.13) | 1.30 (1.21-1.39) | 1.04 (0.95-1.14) | |||||
| Medicaid | 0.94 (0.83-1.06) | 1.07 (0.96-1.20) | 0.88 (0.79-0.98) | |||||
| Medicare | Ref | Ref | Ref | |||||
|
| ||||||||
| Charlson comorbidity score | <.01 | <.01 | <.01 | |||||
| 0 | Ref | Ref | Ref | |||||
| 1 | 0.90 (0.84-0.95) | 0.96 (0.91-1.01) | <.01 | 1.05 (0.98-1.12) | ||||
| 2 | 0.85 (0.78-0.92) | 0.89 (0.83-0.97) | 1.14 (1.04-1.24) | |||||
| ≥3 | 0.88 (0.76-1.01) | 0.82 (0.72-0.94) | 1.24 (1.09-1.42) | |||||
Results derived from hierarchical multivariable logistic regression models with hospital-level random intercepts, with adherence to each measure as the outcome. All predictors reported were determined a priori to be clinically relevant and included in the models. The total N for each model was equal to all of the patients eligible for that particular measure. Specifically: Measure 1 included 235,642 patients from 1324 hospitals, Measure 2 included 120,937 patients from 1309 hospitals, Measure 3 included 155,565 patients from 1311 hospitals, Measure 4 included 77,387 patients from 1305 hospitals, Measure 5 included 153,976 patients from 1310 hospitals, Measure 6 included 38,790 patients from 1279 hospitals, and Measure 7 included 49,373 patients from 1255 hospitals. American Joint Committee on Cancer seventh edition staging was used.13 OR, Odds ratio; CI, confidence interval; Ref, reference level.
Quartiles were 1 (1-10), 2 (11-23), 3 (22-44), and 4 (≥45).
Adherence to the lymph node sampling measure was less likely in hospitals with lower lung cancer volume (odds ratio [OR], 0.56; 95% confidence interval [CI], 0.48-0.66 for lowest vs highest quartile). In addition, treatment at multiple facilities, which may indicate treatment at a referral center, was associated with higher odds of adherence.
Similar trends were seen for anatomic resection of pathologic stage T1b or greater NSCLC. Decreased adherence was associated with low-volume centers (OR, 0.63; 95% CI, 0.53-0.75 for lowest vs highest quartile). Treatment at multiple facilities was again associated with higher odds of adherence.
Some factors associated with improved adherence to surgical quality measures were conversely found to be negatively associated with the recommendation of adjuvant chemotherapy. For this measure, the lowest volume quartile was significantly associated with higher odds of adherence compared with the highest (OR, 1.19; 95% CI, 1.01-1.41). Academic institutions tended to have lower odds of adherence than non-academic (OR, 0.90; 95% CI, 0.81-1.00). Patients traveling further for treatment had lower odds of adherence (OR, 0.83; 95% CI, 0.77-0.90 for >25 miles vs <5 miles). However, treatment at multiple facilities had higher odds of adherence (OR, 1.38; 95% CI, 1.29-1.47).
Factors associated with failure to confirm pathologic diagnosis before definitive radiotherapy mirrored those for the chemotherapy measure. Although there was a trend toward higher volume hospitals having lower odds of adherence, this did not reach the threshold for statistical significance (OR, 1.23; 95% CI, 0.95-1.59). Academic institutions again had lower odds of adherence (OR, 0.68; 95% CI, 0.56-0.83). Similar to the chemotherapy measure, a trend toward lower adherence was seen among patients who traveled farther for treatment, whereas treatment at multiple institutions was associated with higher odds of adherence (OR, 1.53; 95% CI, 1.41-1.65).
Sensitivity Analyses
Models predicting measure adherence including noncategorized continuous age, distance, and volume gave the same results with respect to significance and direction of associations (Table E4). To address potential for tumor size to bias decision making, a sensitivity analysis was performed to evaluate anatomic resection for tumors larger than 2 cm (in place of T1b tumors). In this group, adherence was only slightly higher at both the patient (89.2%) and hospital (73.6%) levels. Similarly, a 3-cm threshold resulted in higher patient-level (92.2%) adherence. However, at the hospital level, although adherence improved to 83.9% it still did not exceed the 85% threshold commonly used in quality assessment.
A further evaluation of interaction effects between factors indicating a higher-risk patient population and institutional factors revealed no significant interactions for measure adherence. These institutional factors all have independent effects on adherence that do not differ based on patient population.
Association of Adherence With Survival
On Cox proportional hazards modeling, adherence to measures 1, 3, 4, 5, and 6 were found to be significantly associated with survival in fully adjusted models (Table 5). Measure 7 (biopsy before radiation) was just above the threshold for statistical significance (hazard ratio, 1.05; 95% CI, 1.00-1.10; P = .07).
TABLE 5.
Association of measure adherence with survival on adjusted Cox proportional hazards modeling
| Measure | Hazard ratio (95% CI) | P value |
|---|---|---|
| Measure 1: Clinical stage documented | 1.46 (1.40-1.53) | <.01 |
| Measure 2: Confirm pathologic diagnosis | 0.90 (0.81-1.02) | .09 |
| Measure 3: Lymph node sampling | 0.65 (0.63-0.68) | <.01 |
| Measure 4: Anatomic resection for T1b | 0.69 (0.66-0.72) | <.01 |
| Measure 5: R0 resection achieved | 0.56 (0.54-0.59) | <.01 |
| Measure 6: Chemotherapy for stage II | 0.77 (0.74-0.80) | <.01 |
| Measure 7: Biopsy before radiation | 1.05 (1.00-1.10) | .07 |
Each measure was evaluated with a separate regression model, using patient-level adherence to that specific measure as the primary exposure. All models were fully adjusted for patient age, sex, race, insurance status, Charlson comorbidity score, cancer stage, treatment at multiple facilities, distance traveled to treating facility, geographic location, metropolitan area, academic institution, and average annual hospital lung cancer volume. American Joint Committee on Cancer seventh edition staging was used.13 CI, Confidence interval.
DISCUSSION
Although previous studies have demonstrated variation in adherence to lung cancer quality measures, existing measures address only limited aspects of lung cancer care.9 To address this potential blind spot in cancer care, the ThORN collaborative developed a series of quality measures through a modified Delphi process.9 The goal of this exercise was to provide more specific and actionable targets for improvement in cancer care delivery. The ThORN measures thus represent a unique opportunity to examine processes of care delivery across the range of lung cancer care. Our study identified several quality gaps based on these measures and assessed the association of institutional factors with measure compliance.
We identified 4 measures with poor rates of compliance nationally: 2 surgical (lymphadenectomy and anatomic resection) and 2 coordination (adjuvant chemotherapy and biopsy before radiation) measures. Whereas all 4 had low adherence at the hospital-level, the coordination of care measures had the lowest adherence rates at both hospital and patient levels. This suggests that, nationally, the largest quality gaps exist in coordination of care outside the operating room.
When examining factors associated with adherence, institutional factors had differential effects based on the category of the measure. For example, there was a stepwise decrease in the odds of adherence for surgical care measures as hospital volume decreased. The odds of adherence also increased when patients were treated at more than one hospital. Conversely, for coordination of care measures, higher volume academic centers and longer distance traveled tended to have lower odds of adherence. Together, these results suggest that smaller, nonacademic hospitals have lower adherence to measures related to surgical care, whereas larger academic referral centers have lower adherence on coordination of care.
Multiple studies have demonstrated that lymph node sampling during resection is a key prognostic factor in NSCLC.17,18 However, rates of lymph node staging have repeatedly been shown to fall short of guidelines.19 Our group previously evaluated adherence to CoC quality measures and found that only 27.3% of cases had adequate (>10) lymph node sampling.5 Similarly, Samson and colleagues20 evaluated a quality measure recommending at least 10 lymph nodes sampled among 241,146 patients with clinical stage I NSCLC and found patient-level adherence to be 34.2% in 2013. Although our study examined any lymph node sampling and therefore had a higher adherence rate, predictors of adherence to both our and the CoC’s measures were resections performed in academic and high-volume centers. Samson and colleagues20 also found that academic and high-volume centers had lower likelihood of performing anatomic resections. This differs from our analysis, where we found that academic and high-volume centers were more likely to perform anatomic resections in patients with tumors categorized at T1b or higher. This difference may be due to our refinement of the measure to include only T1b tumors, as opposed to all stage I NSCLC.
In an analysis of patients with pathologic stage Ib to IIIa NSCLC, Rajaram and colleagues6 found that only 37.5% of patients received perioperative chemotherapy, and that patients treated at academic facilities were less likely to receive chemotherapy.6 Other studies have reported patient-level factors such as age and access to care that influence chemotherapy administration.21,22 Our findings demonstrate that hospital-level factors may contribute to this variation, with the combination of high-volume, academic centers and treatment at multiple facilities suggesting that patients treated at referral centers may be less likely to receive adjuvant chemotherapy.
We also found significant variability in the rates of biopsy confirmation of cancer before radiation treatment. Although there are no previous studies reporting on biopsy rates before radiation therapy, 1 group found that among 2566 patients with NSCLC, 18% had no biopsy before treatment.23 These results approximate our finding that 16.9% of patients who received primary radiotherapy did not have a biopsy. Higher likelihood for nonadherence was again associated with referral center characteristics.
A surprising result of our analysis is the finding that high-volume academic centers tended to have lower adherence to coordination of care measures. Although we are unable to determine the underlying cause from the available data, there are several plausible explanations. Academic centers frequently treat patients referred from other centers due to disease complexity or lack of appropriate resources locally. For many of these patients, postsurgical care reverts to the local institution. The greater difficulty in coordination of care for these patients across multiple institutions and disciplines may contribute to nonadherence. Treatment at multiple institutions also increases the potential that a patient may be lost to follow-up. These patients may have received adjuvant therapy at non-CoC facilities not captured in the NCDB, representing an additional blind spot. Further, academic centers may be more willing to empirically treat patients with primary radiotherapy based on experience, or tumor board discussions, which may not be captured in the dataset. Finally, although the quality measures were developed through an expert consensus process10 within the thoracic oncology community, there will inevitably be some warranted variation in practice, and hence measure adherence, because care is individualized to specific patients. Regardless of the underlying causes, these findings should draw attention to potentially important quality gaps as areas for further investigation at the institutional level.
The analysis of intraclass correlation and variance derived from the hierarchical regression models shows the degree of variability in adherence attributable to hospital-level effects. Adjusting for patient and hospital factors accounted for a fraction of the variability seen between hospitals; however, the majority is due to unmeasured factors. These results highlight the importance of institutional factors in influencing adherence, and the need to further investigate hospital factors not included in the NCDB.
We found that adherence to most quality measures, with the exception of pathologic diagnosis before radiation, was significantly associated with survival. Of particular note, adherence to the surgical measures was associated with survival when adjusting for cancer pathologic stage and other patient factors. For these measures, the volume-process relationship mirrored the surgical volume-outcome relationship suggested in the literature.24–26 On the other hand, the volume-process relationship for the chemotherapy measure was reversed in our data. We do not believe this undermines the volume–outcome relationship because the measures of surgical care may have a more dominant effect on survival; however, these findings highlight areas where high-volume centers can potentially further improve outcomes by addressing the process of care delivery.
Our study has limitations given the data source and study design. The NCDB is continually updated with the latest information each year, and establishing the chronology of events is not always possible. A key example of this is pathologic confirmation of diagnosis. Any patient who underwent a resection is expected to have pathologic examination of the resected specimen, which would prompt registrars to code that pathologic diagnosis had been confirmed, regardless of whether this was true before resection. These factors may lead to some misclassification of cases as adherent. Another limitation inherent to the use of any large database is the risk of unmeasured confounding. Although we have some information regarding hospital characteristics, not all structural factors can be captured. This also extends to provider characteristics, such as surgeon specialty. Because we have no information on referrals and other specific processes of care, we must infer these from information such as the treatment a patient ultimately received. Although this allows examination of some of the decision-making processes involved in a patient’s care, the picture remains incomplete. Finally, whereas the NCDB captures >80% of lung cancers diagnosed in the United States, it only contains data from CoC-designated facilities. It is possible that some patients may have been diagnosed at non-CoC facilities before referral to a CoC facility, in which case we would not have data from their initial hospital encounter.
CONCLUSIONS
Significant gaps exist in the delivery of quality lung cancer care in the United States (Figure 2). These gaps vary at the institutional level, which may be the most effective level to target them for improvement. We found that the largest gaps at lower-volume nonacademic centers were in providing guideline-adherent surgical care. Conversely, high-volume, academic, and referral centers should seek to improve multidisciplinary coordination of care for these complex patients. There is no single type of quality institution that performs highly across all quality measures. Effective quality improvement requires deep assessment of institutional structures and processes that facilitate or impede the delivery of care in the context of where it is provided. Future work should focus on understanding the underlying drivers of this unwanted variation, enabling the development of contextually appropriate interventions to improve the quality of lung cancer care across institutions.
FIGURE 2.

In this national evaluation of adherence to quality measures for early-stage non–small cell lung cancer, significant quality gaps were found in various domains. Adherence below an 85% threshold was seen for 2 surgical and 2 coordination of care measures, shown in red. Hospital-level differences are responsible for a significant proportion of the variability in adherence. American Joint Committee on Cancer 7th edition staging was used for this analysis.13
Supplementary Material
CENTRAL MESSAGE.
Significant gaps in the delivery of lung cancer care continue to exist in the United States. Hospital infrastructure and volume may influence the delivery of appropriate lung cancer care.
PERSPECTIVE.
Significant gaps in the delivery of lung cancer care continue to exist. These differ by structural factors at the hospital level. Our findings suggest different specific deficiencies for small nonacademic hospitals and large academic centers, highlighting the need for targeted quality improvement efforts that account for the unique characteristics of hospital environments.
Discussion Presenter: Dr Rhami Khorfan.

Dr Haiquan S. Chen (Shanghai, China). Thank you for this interesting study. I have several questions regarding this study. As you mentioned, high-volume academic hospitals had higher adherence for the surgical care measured, but according to your results, the low-volume and nonacademic hospitals did better in the coordination of care measures. This surprised me. Large centers should do better in multidisciplinary treatment treatment because they always have more advanced equipment and more expertise for the treatment. It seems to go the opposite way, so which reason do you think caused this problem?

Dr Rhami Khorfan (Chicago, Ill). That’s a very good question. I agree; the results were surprising at first to me as well. There are a few possible reasons why we see that that trend in academic centers. One possibility is that a lot of patients might travel somewhere for their surgery and then have their adjuvant treatment at a local facility. The possibilities there are potential loss to follow-up—maybe the patient doesn’t actually get their adjuvant therapy. Another possibility, and it’s a limitation of the database, if they have their adjuvant therapy at a facility that doesn’t report to the National Cancer Data Base, then we won’t have that information.
Otherwise, like you said, academic and high-volume centers have more expertise and more experience in dealing with these patients. For example, for the radiation measure, there may be a group of radiation oncologists that are more comfortable treating with stereotactic body radiation therapy without a biopsy in a patient that has a high likelihood of cancer, or a high pretest probability. But if that’s the case, I think that’s a conversation that needs to be had, because these measures were developed from an expert consensus process that included all specialists, not just surgeons. So, these are things that the thoracic oncologic community has deemed important. So, if there is a subset of practitioners that practice in a different way, then I think that’s a conversation that needs to be had about the measures and about the way these patients should be treated.
Dr Chen. My second question is: The health providers in large-volume academic centers tend to adhere to the guidelines. So, do you think that’s because there is something wrong with our guidelines, and guidelines are renewed as time passes and things change. Because of the results of several recent studies, the number of early-stage lung cancer patient presenting as ground-glass opacity (GGO) on the computed tomography scan is increasingly enormously in both Western and Eastern society. We also found that mixed GGO should be identified a new subtype. Because the patients presenting as mixed GGOs have different characteristics and survival outcomes. So, as an academic center, they should take the responsibility to not only follow the guidelines, but also of creating the new guidelines based on the new evidence. Do you think health care providers should be more adherent to the guidelines, or is time for the guidelines to be revised?
Dr Khorfan. Indeed, as I said, these measures were very recently developed. In my opinion, they do represent kind of what the thoracic oncologic community thinks is important, and they are reflected by the evidence. So, if there’s a discrepancy in the way certain centers are treating patients, then it could be a reason to revisit the measures and the guidelines and update them. But, like I said, our study was to point out this variation at the national level and understanding the underlying reasons for this variation is impossible from just the National Cancer Center Data Base. We probably need to look at either institutional studies or qualitative or mixed-methods studies to try to understand why there’s this variation in practice.
Dr Chen. Guidelines are evidence-based and the major evidence is always the survival outcome of cancer patients. Do you do any analysis on the influence on survival outcomes for the surgical matters? Coordination of care matters, will this matter significantly affect patient survival outcomes?
Dr Khorfan. Yes. That’s an excellent point. Here we’re looking just at the processes, and we didn’t look at outcomes in this specific study, but that’s certainly something that’s important and kind of the next step. I think the previously established volume-outcome relationship that we’re all aware of, mostly is focused on surgical measures, things like lymph node harvest and extent of resection, we know these things are associated with outcomes, and in our study, the volume–process relationship matches that volume–outcome relationship that is well established.
Whereas for the coordination-of-care measures, the volume-process relationship seems to go in the opposite way, but we don’t really know the effect those measures have on outcomes yet, and it’s possible that the surgical measures just have a much higher bearing on outcomes, and that’s why we see that volume–outcome relationship.
Dr Chen. Thank you for your excellent presentation.
Dr Khorfan. Thank you very much.
Dr Benjamin Kozower (St Louis, Mo). It’s interesting that when you looked at your quartiles, you decided the high-volume group—top 25%—was about 45 lung cancer resections a year. Given that the American Association for Thoracic Surgery meeting is in Toronto this year, it’s important to note that their volume standard per Cancer Care Ontario 150 lung resections. So, we’re an order of magnitude off of what they’re doing here in Ontario. I think your point about trying to make your next study to determine the association between these process measures and long-term outcomes like survival is going to be critical.
As we know, in clinical databases such as the Society of Thoracic Surgeons Adult Cardiac Database, which also at this meeting was heavily criticized, if you do a wedge resection with a positive margin and no nodes, and the patient goes home on postoperative day 1, that could be considered a success in the current registry if the patient goes home on postoperative day 1 without any complications. So, we need to do better. Do you have any thoughts about that?
Dr Khorfan. I think that, for example, the clinical scenario you brought up was kind of among the reasons for developing these quality measures that were a little bit more clinically relevant, and not just driven by either the data itself or by other societies. Like you said, I think that the outcome relationship is still unknown and that’s the next step in evaluating these measures.

Dr Todd L. Demmy (Buffalo, NY). Some of your outcome measurements relate to documentation. Documentation for us, is many times coordinated or driven by the electronic health record. It seems to me to be a big opportunity here when an organization comes up with things to be implemented. Do you have specific recommendations on where that should be built into health records, and what would be the optimal load point for doing these last-minute checks—is it on your postoperative note? I don’t think we’ve driven down to that level of detail, but that’s really what the software providers, or the hospital administrators would really need to ask: What is the most optimal time to get a high percentage of capture for these things? So, the question is going forward, can you think of a way of getting best practices for helping to take these health care records that control our work lives and actually make them function better for us to get better guideline compliance?
Dr Khorfan. That’s an excellent question. Unfortunately, I don’t have a solution to solve the problems of the electronic medical record, but that’s definitely a concern. All of these measures that we have from the National Cancer Data Base are reliant on documentation. So, I think that’s part of the reason why we term those last two measures coordination of care, because they really are an issue of continuity of care and communication. Like the example I gave of patients being treated at a referral center for their surgery and then going elsewhere for their adjuvant therapy. A patient could kind of fall through the cracks there just based on an error or miscommunication or an errant documentation. So, I think that’s a really big problem and I’m not sure at this point what the best solution for that is, unfortunately.

Dr Felix G. Fernandez (Atlanta, Ga). Just as a final closing comment, this is now 1 of several studies from the National Cancer Database and other registries that do demonstrate that there is variability across the country in adherence to quality metrics however we choose to define them. Really the next step we need to take is to implement measures to increase adherence to these metrics, however we define them. True variability does exist, as you’ve defined.
Acknowledgments
The authors thank Jeanette W. Chung, PhD, for providing invaluable statistical expertise.
Dr Khorfan is partially supported by a National Institutes of Health grant (No. 5T32HL094293). Dr Odell receives support from the National Cancer Institute (award No. K07CA216330). This work was also supported by the American Association for Thoracic Surgery Graham Foundation, the Thoracic Surgery Foundation, and the American College of Surgeons.
Abbreviations and Acronyms
- CoC
Commission on Cancer
- NCDB
National Cancer Database
- NSCLC
non–small cell lung cancer
- ThORN
Thoracic Surgery Outcomes Research Network
Footnotes
Read at the 99th Annual Meeting of The American Association for Thoracic Surgery, Toronto, Ontario, Canada, May 4-7, 2019.
Webcast
You can watch a Webcast of this AATS meeting presentation by going to: https://aats.blob.core.windows.net/media/19%20AM/Sunday_May5/203BD/203BD/S62%20-%20Doing%20the%20right%20thing%20I/S62_8_webcast_053401935.mp4.
Conflict of Interest Statement
The authors reported no conflicts of interest.
The Journal policy requires editors and reviewers to disclose conflicts of interest and to decline handling or reviewing manuscripts for which they may have a conflict of interest. The editors and reviewers of this article have no conflicts of interest.
References
- 1.Siegel RL, Miller KD, Jemal A. Cancer statistics, 2019. CA Cancer J Clin. 2019; 69:7–34. [DOI] [PubMed] [Google Scholar]
- 2.Backhus LM, Farjah F, Zeliadt SB, Varghese TK, Cheng A, Kessler L, et al. Predictors of imaging surveillance for surgically treated early-stage lung cancer. Ann Thorac Surg. 2014;98:1944–51. [DOI] [PMC free article] [PubMed] [Google Scholar]
- 3.Farjah F, Detterbeck FC. What is quality, and can we define it in lung cancer? The case for quality improvement. Transl Lung Cancer Res. 2015;4:365–72. [DOI] [PMC free article] [PubMed] [Google Scholar]
- 4.Little AG, Rusch VW, Bonner JA, Gaspar LE, Green MR, Webb WR, et al. Patterns of surgical care of lung cancer patients. Ann Thorac Surg. 2005;80: 2051–6. [DOI] [PubMed] [Google Scholar]
- 5.Odell DD, Feinglass J, Engelhardt K, Papastefan S, Meyerson SL, Bharat A, et al. Evaluation of adherence to the commission on cancer lung cancer quality measures. J Thorac Cardiovasc Surg. 2019;157:1219–31. [DOI] [PMC free article] [PubMed] [Google Scholar]
- 6.Rajaram R, Paruch JL, Mohanty S, Holl JL, Bilimoria KY, Ko CY, et al. Patterns and predictors of chemotherapy use for resected non–small cell lung cancer. Ann Thorac Surg. 2016;101:533–40. [DOI] [PubMed] [Google Scholar]
- 7.Brandt WS, Isbell JM, Jones DR. Defining quality in the surgical care of lung cancer patients. J Thorac Cardiovasc Surg. 2017;154:1397–403. [DOI] [PubMed] [Google Scholar]
- 8.Commission on Cancer. CoC quality of care measures. Available at: https://www.facs.org/quality-programs/cancer/ncdb/qualitymeasures.Accessed April 16, 2019.
- 9.Odell DD, Cooke DT, Meguid RA, et al. Thoracic Surgery Outcomes Research Network consensus measures of lung cancer care: results of a modified Delphi study. Presented at: Society of Thoracic Surgeons 55th Annual Meeting. January27-29, 2019; San Diego, CA. [Google Scholar]
- 10.Dalkey NC. The Delphi Method: an experimental study of group opinion. Available at: https://www.rand.org/pubs/research_memoranda/RM5888.html.Accessed July 29, 2020.
- 11.Bilimoria KY, Stewart AK, Winchester DP, Ko CY. The national cancer data base: a powerful initiative to improve cancer care in the United States. Ann Surg Oncol. 2008;15:683–90. [DOI] [PMC free article] [PubMed] [Google Scholar]
- 12.American College of Surgeons. National Cancer Data Base - data dictionary. Treatment. Available at: http://ncdbpuf.facs.org/node/408.Accessed August 28, 2019.
- 13.American Joint Committee on Cancer. AJCC Cancer Staging Manual. 7th ed. Chicago, IL: American Joint Committee on Cancer; 2010. [Google Scholar]
- 14.Austin PC, Merlo J. Intermediate and advanced topics in multilevel logistic regression analysis. Stat Med. 2017;36:3257–77. [DOI] [PMC free article] [PubMed] [Google Scholar]
- 15.Ene M, Leighton EA, Blue GL, Bell BA. Multilevel models for categorical data using SAS PROC GLIMMIX: the basics. Available at: https://support.sas.com/resources/papers/proceedings15/3430-2015.pdf.Accessed July 29, 2020.
- 16.Merlo J, Chaix B, Ohlsson H, Beckman A, Johnell K, Hjerpe P, et al. A brief conceptual tutorial of multilevel analysis in social epidemiology: using measures of clustering in multilevel logistic regression to investigate contextual phenomena. J Epidemiol Community Health. 2006;60:290–7. [DOI] [PMC free article] [PubMed] [Google Scholar]
- 17.Osarogiagbon RU, Yu X. Nonexamination of lymph nodes and survival after resection of non–small cell lung cancer. Ann Thorac Surg. 2013;96:1178–89. [DOI] [PubMed] [Google Scholar]
- 18.Ou SH, Zell JA. Prognostic significance of the number of lymph nodes removed at lobectomy in stage IA non–small cell lung cancer. J Thorac Oncol. 2008;3:880–6. [DOI] [PubMed] [Google Scholar]
- 19.Farjah F, Flum DR, Ramsey SD, Heagerty PJ, Symons RG, Wood DE. Multi-modality mediastinal staging for lung cancer among Medicare beneficiaries. J Thorac Oncol. 2009;4:355–63. [DOI] [PMC free article] [PubMed] [Google Scholar]
- 20.Samson P, Crabtree T, Broderick S, Kreisel D, Krupnick AS, Patterson GA, et al. Quality measures in clinical stage I non–small cell lung cancer: improved performance is associated with improved survival. Ann Thorac Surg. 2017;103:303–11. [DOI] [PMC free article] [PubMed] [Google Scholar]
- 21.Salloum RG, Smith TJ, Jensen GA, Lafata JE. Factors associated with adherence to chemotherapy guidelines in patients with non–small cell lung cancer. Lung Cancer. 2012;75:255–60. [DOI] [PMC free article] [PubMed] [Google Scholar]
- 22.Wang J, Kuo YF, Freeman J, Markowitz AB, Goodwin JS. Temporal trends and predictors of perioperative chemotherapy use in elderly patients with resected non–small cell lung cancer. Cancer. 2008;112:382–90. [DOI] [PMC free article] [PubMed] [Google Scholar]
- 23.Faris NR, Smeltzer MP, Lu F, Fehnel CL, Chakraborty N, Houston-Harris CL, et al. Evolution in the Surgical care of patients with non–small cell lung cancer in the mid-south quality of surgical resection cohort. Semin Thorac Cardiovasc Surg. 2017;29:91–101. [DOI] [PMC free article] [PubMed] [Google Scholar]
- 24.Bach PB, Cramer LD, Schrag D, Downey RJ, Gelfand SE, Begg CB. The influence of hospital volume on survival after resection for lung cancer. N Engl J Med. 2001;345:181–8. [DOI] [PubMed] [Google Scholar]
- 25.Birkmeyer JD, Siewers AE, Finlayson EV, Stukel TA, Lucas FL, Batista I, et al. Hospital volume and surgical mortality in the United States. N Engl J Med. 2002;346:1128–37. [DOI] [PubMed] [Google Scholar]
- 26.Meguid RA, Brooke BS, Chang DC, Sherwood JT, Brock MV, Yang SC. Are surgical outcomes for lung cancer resections improved at teaching hospitals? Ann Thorac Surg. 2008;85:1015–24. [DOI] [PubMed] [Google Scholar]
Associated Data
This section collects any data citations, data availability statements, or supplementary materials included in this article.