

Abstract
Background:
The aim of the study was to determine the effect of an educational intervention on the use of trend arrows of a real-time continuous glucose monitoring (rt-CGM) to manage daily therapy decisions in a group of adolescents with type 1 diabetes attending a camp. The secondary aim was to evaluate the variations in total daily dose (TDD) of insulin requirement.
Methods:
Twenty patients (15-17 years) on multiple insulin injections (n = 8) or continuous subcutaneous insulin infusion (n = 12) attended a training session at the beginning of the camp to learn our algorithm for the management of therapy depending on trend arrows. TDD, time in range (TIR), time above range (TAR), and time below range (TBR) (in the 24 hours and in the three hours after breakfast) before the training session (run-in) and at the end of the camp (T1) were analyzed.
Results:
Data showed a reduction of TAR (run-in 42.6%, T1 32.05%, P = .036) and an increase in TIR (run-in 52.9%, T1 62.4%, P = .013). Reduction of TBR (run-in 42.5%, T1 37.5%, P = .05) and improvement in TIR (run-in 49.0%, T1 57.0%, P = .02) were also observed in the post-breakfast period. Data showed a significant reduction in the TDD (run-in 52.02 ± 17.44 U/die, T1 46.49 ± 12.39 U/die, P = .024).
Conclusions:
Statistically significant improvement of glycemic control and reduction of TTD were observed in all patients regardless of therapy type. The improvement between run-in and T1 demonstrates the importance of patients’ education on the correct use of rt-CGM with simple algorithms for the management of therapy.
Keywords: real-time continuous glucose monitoring, insulin dose adjustments, trend arrows, fine-tuning, type 1 diabetes
Introduction
Since the accuracy of real-time continuous glucose monitoring (rt-CGM) has significantly improved recently, it is gradually replacing traditional self-monitoring of blood glucose (SMBG) and it is becoming an essential technological support to achieve better glycemic control in patients affected by type 1 diabetes (T1D). Randomized clinical trials, predominantly including continuous subcutaneous insulin infusion (CSII) users, have demonstrated rt-CGM benefits in improving glycemic control as measured by clinical reduction of glycosylated hemoglobin (HbA1c) levels and episodes of hypoglycemia.1-5 Furthermore, rt-CGM has been clearly recognized as an extremely useful tool to improve glycemic control also in T1D patients treated with multiple daily injection (MDI) therapy.6-9 It is well established that parameters indicating a good metabolic control are no longer limited to the concept of HbA1c, but they are extended also to time in range (TIR = 70-180 mg/dL), time below range (TBR < 70 mg/dL), and time above range (TAR > 180 mg/dL).
For patients with diabetes, rt-CGM provides more “static” information than SMBG, since glucose measurements are updated every five minutes; it also gives “dynamic” information with trend arrows, which indicate the predicted variation of glycemic values over time. The correct interpretation of trend arrow information is crucial to fully take advantage of this technology for the management of diabetes. In December 2016, the US Food and Drug Administration approved the Dexcom G5 Mobile as the first rt-CGM system (Dexcom G5, Dexcom, Inc., San Diego, CA, USA) for nonadjunctive insulin dosing. Though many patients can now measure out insulin without confirmatory fingerstick, there is little guidance on how to use trend arrow information to manage therapy. In the literature, there are only few practical indications and general treatment recommendations about it10-17 and no clinical data related to the application of these methods in children are reported. The amount of data available with rt-CGM greatly exceeds than that with SMBG, but there are no clear guidelines on the interpretation of all these data.
We developed and applied a new protocol for therapy management based on rt-CGM Dexcom G5 Mobile information in a camp setting with a group of T1D teenagers. The aim of our study was to demonstrate that patients’ training on the correct use of a simple protocol and on data interpretation are the main key elements of successful management of diabetes. We compared glycemic control at the beginning of the camp, before the one-day training session, and at the end of the camp.
Methods
Aims of the Study
The primary endpoint was to identify the percentage of TIR (70-180 mg/dL), TAR (>180 mg/dL), and TBR (<70 mg/dL) at the beginning of the camp and at the end of the camp, both in the 24 hours and in the post-breakfast period (three hours). The secondary endpoint was to evaluate total daily dose (TDD) of insulin requirement (U/kg/die) at the beginning of the camp and at the end of the camp.
Inclusion and Exclusion Criteria
The study was conducted on 20 adolescents recruited at G. Gaslini Diabetology Center, attending a seven-day diabetes educational camp. Eligibility criteria included: age 15-17 years, T1DM diagnosis at least one year prior, and treatment with MDI or CSII for at least three months. Exclusion criteria were: diabetes ketoacidosis events, hypoglycemic seizure or coma in the preceding three months, pregnancy, seizure disorders, and medical or psychiatric conditions considered as possible interferences with protocol completion. There were no exclusion criteria related to HbA1c levels. The new protocol of management of T1D in adolescents was developed from accepted optimization of standard therapies. Written informed consent was obtained for participation to the educational camp with the newly proposed protocol. Local ethics committee approved the retrospective analysis of data acquired during the camp.
Run-in (beginning of the camp period) and T1 (end of the camp period)
A Dexcom G5 Mobile rt-CGM sensor was inserted three days before the arrival at the camp by the Center’s medical staff. No patient had ever used rt-CGM before. Participants calibrated the sensor twice per day, prior to breakfast and dinner, following the initial calibration two hours after insertion. The first day of the camp every participant attended a one-day training session with a medical team composed of: diabetologists, nurses, a nutritionist, a psychologist, and a physical fitness instructor. The training session provided rt-CGM sensor basic information: lag-time, calibrations, alerts/alarms functions, as well as how to be proactive to fine-tune therapy, taking advantage of the predictive information of rt-CGM trend arrows. Our new protocol was shown and explained to all participants. Patients used this protocol to measure out insulin therapy and take therapeutic decisions during the camp with medical staff support and supervision. We divided the observational period in: run-in (beginning of the camp period: day 2 and day 3 after first sensor insertion, the two days before the camp) and T1 (end of the camp period: day 2 and day 3 after second sensor insertion, the last two days of the seven-day camp).
Study Protocol
The therapy management algorithm developed and applied for both insulin bolus decisions and hyperglycemia/hypoglycemia corrections was based on the predicted glucose value. The glycemic value reported by the rt-CGM was corrected for trend arrow directionality and measured in a 15-minute time frame, instead of 30 minutes as reported by Laffel et al.16
Interpretation of trend arrows as from the technical IFU of Dexcom G5 Mobile rt-CGM system is briefly reported (30-minute time frame):
↑↑: glucose increasing >3 mg/dL/min or >90 mg/dL in 30 minutes.
↑: glucose increasing 2-3 mg/dL/min or 60-90 mg/dL in 30 minutes.
↗: glucose increasing 1-2 mg/dL/min or 30-60 mg/dL in 30 minutes.
→: glucose not increasing or decreasing >1 mg/dL/min.
↘: glucose decreasing 1-2 mg/dL/min or 30-60 mg/dL in 30 minutes.
↓: glucose decreasing 2-3 mg/dL/min or 60-90 mg/dL in 30 minutes.
↓↓: glucose decreasing >3 mg/dL/min or >90 mg/dL in 30 minutes.
Indication on how to calculate the predicted glucose values (based on trend arrow directionality in 15-minute time frame) was as follows:
↑↑: predicted glucose value = current glycemic value + 50 mg/dL.
↑: predicted glucose value = current glycemic value + 30 mg/dL.
↗: predicted glucose value = current glycemic value + 20 mg/dL.
→: predicted glucose value = current glycemic value.
↘: predicted glucose value = current glycemic value − 20 mg/dL.
↓: predicted glucose value = current glycemic value − 30 mg/dL.
↓↓: predicted glucose value = current glycemic value − 50 mg/dL.
Pre-meal insulin bolus calculation was therefore adjusted on patients’ specific correction factor (CF), on insulin to carbohydrates ratio (I/CHO), and on rt-CGM predicted glucose value. Corrections between meals were made only three hours from a previous bolus.
We applied the following indications for pre-meal insulin bolus calculation and corrections:
Pre-meal bolus dose adjustment (105 mg/dL was the glucose target for pre-meal bolus): CHO coverage insulin dose + (predicted glucose value − 105)/CF. Bolus dose adjustments based on trend arrow directionality were made only if the predicted glucose value was >105 mg/dL; in all other cases (ie, predicted glucose value <105 mg/dL) glycemia was corrected according to our hypoglycemia correction scheme (as reported below) and according to the pre-meal bolus dose, calculated to cover CHO amount of each meal. No reverse corrections were proposed for pre-meal bolus calculation as pre-meal boluses have to cover the CHO amount of the meal. Hypoglycemia events, immediately preceding meal, were treated following the hypoglycemia correction scheme; in this way, pre-meal bolus calculations were not affected.
Correction dose adjustment for high glucose values between meals (140 mg/dL was the glucose target for correction adjustment): (predicted glucose value − 140)/CF. High glucose value was referred to predicted glucose value >180 mg/dL for CSII users or predicted glucose value >300 mg/dL for MDI patients.
Hypoglycemia correction scheme for CSII users:
Predicted glucose value <70 mg/dL: 15 grams glucose intake + 30 minutes stop of basal insulin;
Predicted glucose value 70-80 mg/dL: 10 grams glucose intake + 30 minutes stop of basal insulin if symptomatic or 30 minutes stop of basal insulin if no symptoms;
Predicted glucose value 81-99 mg/dL: 30 minutes stop of basal insulin.
Hypoglycemia correction scheme for MDI users:
Predicted glucose value <70 mg/dL: 15 grams glucose intake;
Predicted glucose value 70-80 mg/dL: 10 grams glucose intake if symptomatic or 5 grams glucose intake if no symptoms;
Predicted glucose value 81-99 mg/dL: 5 grams glucose intake if symptomatic or no action if no symptoms.
We also retrained patients on some aspects of therapy management that are already periodically remarked at our outpatient visits, as CHO count and correct timing of bolus before meal. During the camp, meals were always scheduled at the same time and indications on the proper timing of bolus were the following:
Italian breakfast (simple sugars):
Predicted glucose value <80 mg/dL: bolus at meal;
Predicted glucose value >80 mg/dL: bolus 30 minutes before the meal;
Lunch and dinner (complex sugars):
Predicted glucose value <80 mg/dL: bolus at meal;
Predicted glucose value 80-180 mg/dL: bolus 15 minutes before the meal;
Predicted glucose value >180 mg/dL: bolus 30 minutes before the meal.
Statistical Analysis
Data were analyzed using R software version 3.5.1. (R Foundation for Statistical Computing, Vienna, Austria, https://www.R-project.org/). Results were expressed as mean/median and standard deviation values. Student’s t test was used for continuous variables with a normal distribution. Continuous variables that did not show a normal distribution were compared using a Wilcoxon test; tests were analyzed per paired variables. All P values were two-tailed and P < .05 was considered statistically significant. Entries from the Dexcom G5 rt-CGM were automatically collected by the Clarity web-based software.
Results
Our study was conducted on 20 adolescents recruited from G. Gaslini Diabetology Center attending a seven-day diabetes camp. The mean age of participants was 15.6 ± 0.8 years (range 15.0-17.0 years), diabetes duration was 6.9 ± 3.8 years, and HbA1c was 8.3 ± 1.1% (range 7.2%-10.7%, 55-93 mmol/mol). Characteristics of the recruited subjects are shown in Table 1.
Table 1.
Characteristics of the Camp Participants.
| Variable | Sample N = 20 |
MDI n = 8 |
Patch pump n = 8 |
Others pump n = 4 |
|---|---|---|---|---|
| Age (years) | 15.6 ± 0.8 | 15.5 ± 0.75 | 15.125 ± 0.35 | 16.5 ± 0.57 |
| Diabetes duration (μm) | 6.9 ± 3.8 | 5.125 ± 3.6 | 6.875 ± 2.99 | 10.75 ± 3.59 |
| Weight (kg) | 63.65 ± 9.89 | 61.55 ± 11.21 | 61.375 ± 7.61 | 72.4 ± 8.01 |
| HbAlc (μm) | 8.3 ± 1.1 | 8.05 ± 1.107 | 8.4375 ± 1.002 | 8.475 ± 1.49 |
Abbreviation: HbA1c, glycosylated hemoglobin; MDI, multiple daily injection.
The mean percentage of TIR increased from 52.9% at run-in to 62.4% at T1 (P = .013, W = 40, relative median increase 17.95%), which corresponded to +9.5 percentage points; this mean difference amounted to 2.3 hours per day spent in TIR. The mean difference in the percentage of TAR (>180 mg/dL) was −10.5 percentage points (42.6% at run-in, 32.05% at T1, P = .036, W = 161, with a relative mean decrease of 24.76%), a difference that amounted to 2.5 hours per day (Figure 1).
Figure 1.
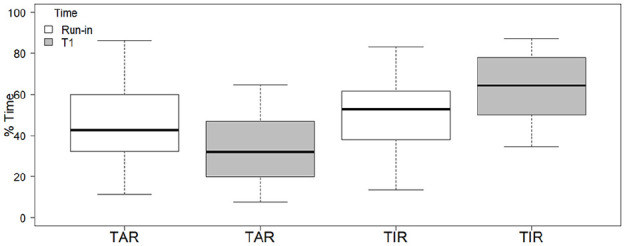
TIR and TAR in the 24 hours at run-in and at T1. TAR, time above range; TIR, time in range.
The same significant trend between the beginning of the camp and the end of the camp was observed when TIR analysis was performed on the post-breakfast period (three hours after the meal): TAR at run-in was 42.5% and it was 37.5% at T1 (P = .05, W = 157) with a relative median decrease of 11.8%. There was an increase in TIR from 49.0% at run-in to 57.0% at T1 (P = .02, W = 45.5) with a relative median increase of 16.32% (Figure 2).
Figure 2.
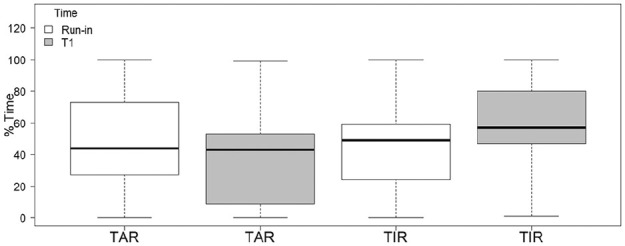
TIR and TAR in the three hours post-meal at run-in and T1. TAR, time above range; TIR, time in range.
The mean difference in the percentage of TBR (<70 mg/dL) was −0.9 percentage points (5.1% at run-in, 4.2% at T1, P-value = .48), a difference that amounted to 13 minutes per day. No severe hypoglycemic event occurred.
Data also showed a significant reduction in the TDD (P = .019, t = 2.56) between the beginning of the camp (mean = 0.81 ± 0.133 U/die/kg) and the end of the camp (mean = 0.72 ± 0.214 U/die/kg) (Figure 3).
Figure 3.
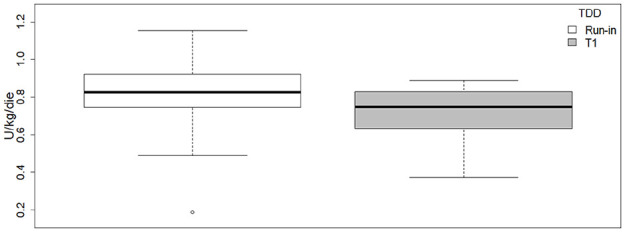
TDD in the 24 hours at run-in and at T1. TDD, total daily dose.
Discussion
In this article, we evaluated the impact of using rt-CGM trend arrows on the management of therapeutic decisions before and after training on the correct interpretation of data given by the device. We compared glycemic control at the beginning of the camp and at the end of the camp. At the beginning of the camp patients used the instrument without information on rt-CGM data interpretation, while at the end of the camp they had received proper education on trend arrow interpretation, data unloading, and use of the proposed algorithm.
The developed therapy management algorithm was based on trend arrow interpretation as reported previously by Laffel et al.,16 considering a 15-minute prediction time frame instead of 30 minutes. In fact, during a time frame of 30 minutes, glycemic values could be excessively variable; therefore, a possibly misleading predicted glucose value could result in too aggressive corrections. The predicted glucose value based on the interpretation of trend arrow directionality in a 15-minute time frame is a more prudential approach compared to the previously reported one.16
Data showed the proposed protocol effectiveness and safety, as it was successful in improving glycemic control without increasing TBR or severe hypoglycemic events. Presented results showed a significant reduction of TAR, with a simultaneous increase of TIR and a reduction of TBR from the beginning to the end of the camp.
Statistical significance was also maintained observing time in hyperglycemia and TIR in the post-breakfast period at run-in and T1. These data and post-meal glycemic trends analysis showed the impact not only of the use of trend arrows but also of the correct timing of bolus (on which patients already received periodic education) on glycemic control. We chose to adapt timing of bolus to the Italian breakfast, characterized by a high content of simple sugars, since in our experience we frequently noticed a massive glycemic increase after simple sugars assumption when bolus timing is not properly considered. This aspect is very important, though we believe it could be underestimated by patients in their daily therapy management. We believe that it is essential, in case of poor glycemic control, to suspect a lack of adherence to the correct timing of bolus. We conclude that it’s very important to educate patients and their families in understanding the importance of this aspect for therapy management.
We also reported a statistically significant reduction in TDD between the beginning and the end of the camp. This is probably due to therapy optimization and to the lower number of postprandial corrections needed. During the camp we also detected less hypoglycemic episodes compared to the average of previous camps (with a very lower number of patients wearing a rt-CGM), but we refer only to our experience, so this might be considered just as a circumstantial not supported by data. We recognize, however, that hypoglycemic episodes could be overestimated in duration. Indeed, if patients are not properly informed on the meaning of rt-CGM lag-time and on the meaning of capillary blood glucose measurement in the period immediately following a hypoglycemic episode, there can be an excessive alarmism and overcorrection.
Clear improvements in glycemic control between the beginning and the end of the camp, observed in every patient regardless of therapy type (CSII or MDI), supported once again that rt-CGM is the tool of choice for a better management of diabetes therapy. These results also showed that the relationship between patients and a dedicated team is a crucial factor for success in therapeutic education.
Moreover, it is important to remark patient satisfaction in the use of the device and in the desire to try the proposed protocol. All participants seemed immediately curious about the device, though initially slightly hesitant in the approach of the protocol. By the end of the camp they became very independent in instrument management and in taking therapeutic decisions based on what they learnt. Patient satisfaction is always a success for medical teams and, even if we did not use quality of life questionnaires, we can confirm that 17/20 patients are still using the device six months after the camp. This fact likely reflects not only the willingness to use rt-CGM, but also the satisfaction with the system, in the interest of obtaining a better glycemic control in daily diabetes management.
Our trial had certain limitations as the restricted number of patients involved (not sufficient to conclude absolute guidelines, but sufficient to have statistical significance), the camp setting which in itself constitutes a favorable element for improvement of glycemic control (attention to CHO count and correct timing to bolus), and the lack of a control group.
The strength of this study is that it is the first experience dealing with trend arrows using data analysis. Other available studies about this topic were all based on clinical experience and not on glycemic data analysis. Moreover, the camp setting is a guarantee of the algorithm correct application because every patient’s choice was examined and confirmed by the diabetes team.
Conclusion
Results showed significant improvements of glycemic control and a reduction of TDD in all participants attending the seven-day diabetes camp, regardless of therapy type. As we pointed out, to fully take advantage of rt-CGM and daily proactively fine-tune therapy, patients’ knowledge of proper timing to bolus, data, and trend arrow interpretation is one of the key elements of success. Furthermore, we think that our training course should be long lasting with periodic follow-ups and that retrospective data analysis would further improve patients’ therapy management and therapy satisfaction.
Further studies are required with a larger population and with a control group to confirm our data. It might be interesting to compare our protocol with a protocol based on 30-minute prediction trend arrows and such study is currently being planned at our institution, in collaboration with other diabetological Italian centers. We believe that our findings could facilitate further discussion and possibly have an influence on the development of new therapy management algorithms for diabetes care.
Acknowledgments
We want to thank Dr. Lorenzo Landino and Dr. Marco Mammi for their contribution in writing this article.
Footnotes
Declaration of Conflicting Interests: The author(s) declared no potential conflicts of interest with respect to the research, authorship, and/or publication of this article.
Funding: The author(s) received no financial support for the research, authorship, and/or publication of this article.
ORCID iDs: Marta Bassi  https://orcid.org/0000-0002-9166-1079
Nicola Minuto
https://orcid.org/0000-0002-5280-6319
References
- 1.Szypowska A, Ramotowska A, Dzygalo K, Golicki D.Beneficial effect of real-time continuous glucose monitoring system on glycemic control in type 1 diabetic patients: systematic review and meta-analysis of randomized trials. Eur J Endocrinol. 2012;166(4):567-574. [DOI] [PubMed] [Google Scholar]
- 2.Battelino T, Conget I, Olsen B, et al. The use and efficacy of continuous glucose monitoring in type 1 diabetes treated with insulin pump therapy: a randomised controlled trial. Diabetologia. 2012; 55(12):3155-3162. [DOI] [PMC free article] [PubMed] [Google Scholar]
- 3.Bergenstal RM, Tamborlane WV, Ahmann A, et al. Effectiveness of sensor-augmented insulin-pump therapy in type 1 diabetes. N Engl J Med. 2010;363(4):311-320. [DOI] [PubMed] [Google Scholar]
- 4.Slover RH, II. Continuous glucose monitoring in children and adolescents. Curr Diab Rep. 2012;12(5):510-516. [DOI] [PubMed] [Google Scholar]
- 5.Kordonouri O, Pankowska E, Rami B, et al. Sensor-augmented pump therapy from the diagnosis of childhood type 1 diabetes: results of the Paediatric Onset Study (ONSET) after 12 months of treatment. Diabetologia. 2010;53(12):2487-2495. [DOI] [PubMed] [Google Scholar]
- 6.Lind M, Polonsky W, Hirsch IB, et al. Continuous glucose monitoring vs conventional therapy for glycemic control in adults with Type 1 diabetes treated with multiple daily insulin injections: the GOLD randomized clinical trial. JAMA. 2017;317(4):379-387. [DOI] [PubMed] [Google Scholar]
- 7.Beck RW, Riddlesworth T, Ruedy K, et al. Effect of continuous glucose monitoring on glycemic control in adults with Type 1 diabetes using insulin injections: the DIAMOND randomized clinical trial. JAMA. 2017;317(4):371-378. [DOI] [PubMed] [Google Scholar]
- 8.Heinemann L, Freckmann G, Ehrmann D, et al. Real-time continuous glucose monitoring in adults with type 1 diabetes and impaired hypoglycaemia awareness or severe hypoglycaemia treated with multiple daily insulin injections (HypoDE): a multicentre, randomised controlled trial. Lancet. 2018;391(10128):1367-1377. [DOI] [PubMed] [Google Scholar]
- 9.Cherubini V, Bonfanti R, Casertano A, et al. Time in Range in Children with Type 1 Diabetes Using Treatment Strategies Based on Nonautomated Insulin Delivery Systems in the Real World [published online ahead of print March 11, 2020]. Diabetes Technol Ther. 10.1089/dia.2020.0031 [DOI] [PubMed]
- 10.Hirsch IB, Abelseth J, Bode BW, et al. Sensor-augmented insulin pump therapy: results of the first randomized treat-to-target study. Diabetes Technol Ther. 2008;10(5):377-383. [DOI] [PubMed] [Google Scholar]
- 11.JDRF CGM Study Group. JDRF randomized clinical trial to assess the efficacy of real-time continuous glucose monitoring in the management of type 1 diabetes: research design and methods. Diabetes Technol Ther. 2008;10(4):310-321. [DOI] [PubMed] [Google Scholar]
- 12.Buckingham B, Xing D, Weinzimer S, et al. Diabetes Research In Children Network (DirecNet) Study Group. Use of the DirecNet Applied Treatment Algorithm (DATA) for diabetes management with a real-time continuous glucose monitor (the FreeStyle Navigator). Pediatr Diabetes. 2008;9(2):142-147. [DOI] [PMC free article] [PubMed] [Google Scholar]
- 13.Scheiner G.Practical CGM: Improving Patient Outcomes Through Continuous Glucose Monitoring. 4th ed.Alexandria, VA: American Diabetes Association; 2015. [Google Scholar]
- 14.Pettus J, Edelman SV.Recommendations for using real-time continuous glucose monitoring (rtCGM) data for insulin adjustments in type 1 diabetes. J Diabetes Sci Technol. 2017;11(1):138-147. [DOI] [PMC free article] [PubMed] [Google Scholar]
- 15.Klonoff DC, Kerr D.A simplified approach using rate of change arrows to adjust insulin with real-time continuous glucose monitoring. J Diabetes Sci Technol. 2017;11(6):1063-1069. [DOI] [PMC free article] [PubMed] [Google Scholar]
- 16.Laffel LM, Aleppo G, Buckingham BA, et al. A practical approach to using trend arrows on the Dexcom G5 CGM system to manage children and adolescents with diabetes. J Endocr Soc. 2017;1(12):1461-1476. [DOI] [PMC free article] [PubMed] [Google Scholar]
- 17.Ziegler R, von Sengbusch S, Kröger J, et al. Therapy adjustments based on trend arrows using continuous glucose monitoring systems. J Diabetes Sci Technol. 2019;13(4):763-773. [DOI] [PMC free article] [PubMed] [Google Scholar]