

Abstract
Graft‐versus‐host disease (GVHD) is a major complication of allogeneic haematopoietic stem cell transplantation (allo‐HSCT) that develops when donor T cells in the graft become reactive against the host. Post‐transplant cyclophosphamide (PTCy) is increasingly used in mismatched allo‐HSCT, but how PTCy impacts donor T cells and reduces GVHD is unclear. This study aimed to determine the effect of PTCy on reactive human donor T cells and GVHD development in a preclinical humanized mouse model. Immunodeficient NOD‐scid‐IL2Rγnull mice were injected intraperitoneally (i.p.) with 20 × 106 human peripheral blood mononuclear cells stained with carboxyfluorescein succinimidyl ester (CFSE) (day 0). Mice were subsequently injected (i.p.) with PTCy (33 mg kg−1) (PTCy‐mice) or saline (saline‐mice) (days 3 and 4). Mice were assessed for T‐cell depletion on day 6 and monitored for GVHD for up to 10 weeks. Flow cytometric analysis of livers at day 6 revealed lower proportions of reactive (CFSElow) human (h) CD3+ T cells in PTCy‐mice compared with saline‐mice. Over 10 weeks, PTCy‐mice showed reduced weight loss and clinical GVHD, with prolonged survival and reduced histological liver GVHD compared with saline‐mice. PTCy‐mice also demonstrated increased splenic hCD4+:hCD8+ T‐cell ratios and reduced splenic Tregs (hCD4+ hCD25+ hCD127lo) compared with saline‐mice. This study demonstrates that PTCy reduces GVHD in a preclinical humanized mouse model. This corresponded to depletion of reactive human donor T cells, but fewer human Tregs.
Keywords: graft‐versus‐host disease, humanized mice, post‐transplant cyclophosphamide, reactive T cells, regulatory T cells, xenogeneic
Graft‐versus‐host disease is a life‐threatening complication of bone marrow transplantation. Post‐transplant cyclophosphamide (PTCy) reduces clinical GVHD, but the mechanism is unclear. Using a humanized mouse model of GVHD, we demonstrate that PTCy not only reduces GVHD alongside reactive donor T cells in the liver, but also reduces human regulatory T cells, which are protective against disease.

Abbreviations
- allo‐HSCT
allogeneic haematopoietic stem cell transplantation
- cDNA
complementary DNA
- CFSE
carboxyfluorescein succinimidyl ester
- CM
central memory
- EM
effector memory
- GVHD
Graft‐versus‐host disease
- h
human
- hPBMC
human peripheral blood mononuclear cell
- i.p
intraperitoneal
- IFN
interferon
- IL
interleukin
- MHC
major histocompatibility complex
- MST
median survival time
- NSG
NOD‐scid‐IL2Rγnull
- PTCy
post‐transplant cyclophosphamide
- qPCR
quantitative real‐time PCR
- TEMRA
terminally differentiated effector memory
- TNF
tumour necrosis factor
- Treg
regulatory T cell
INTRODUCTION
Allogeneic haematopoietic stem cell transplantation (allo‐HSCT) is often the only curative therapy for haematological malignancies such as leukaemia and lymphoma. However, when a related or unrelated matched donor is unavailable, the effectiveness of allo‐HSCT is restricted by the development of graft‐versus‐host disease (GVHD) in up to 50% of mismatched allo‐HSCT recipients [1]. GVHD has a complex and multifaceted pathophysiology and can develop as either chronic or acute based on the timing of onset and cytokine and cellular profiles [2], and whilst there are many models for acute GVHD, no models fully recapitulate chronic GVHD pathogenesis. Murine models have implicated the activation and proliferation of reactive donor T cells, including CD4+ and CD8+ T cells, as central in acute GVHD development [3, 4]. These cells migrate to host target tissues (liver, small intestine and skin) and initiate severe inflammatory tissue damage through the release of pro‐inflammatory cytokines, such as interferon (IFN)‐γ [5] and interleukin (IL)‐17 [6]. Consequently, the depletion of reactive donor T cells is currently used as a therapeutic strategy against GVHD. This can be performed in vivo post‐transplant or pre‐emptively with depletion of specific T‐cell subsets (e.g. αβ T‐cell depletion) from the graft [7, 8]. However, in its current state, T‐cell depletion does not completely mitigate GVHD and is associated with increased risk of infection and cancer relapse [9].
Cyclophosphamide is an alkylating agent that reduces the severity of GVHD in allogeneic mouse models [10] and human clinical trials [11, 12] when administered post‐transplant (PTCy). As a result, cyclophosphamide is currently used clinically to treat GVHD at a dosage between 10 and 50 mg kg−1 on day 3, or on days 3 and 4 post‐allo‐HSCT [8]. Importantly, at this dosage PTCy is not associated with increased rates of cancer relapse or malignancy [13] and is relatively inexpensive [14]. Additionally, PTCy treatment promotes the reconstitution of regulatory T cells (Tregs) [15], which protect against GVHD [16, 17]. However, despite its clinical use, the mechanism of how PTCy impacts reactive donor T cells and reduces GVHD is poorly understood.
PTCy metabolism occurs in the liver by cytochrome P450 and results in the production of phosphoramide mustard and acrolein, which intercalate with DNA to disrupt cell division [18]. Therefore, cells undergoing rapid proliferation, such as reactive donor T cells in GVHD, are more susceptible to PTCy than non‐proliferating cells. Early work in preclinical major histocompatibility complex (MHC)‐mismatched skin allograft models indicated that PTCy could reduce allograft rejection [19, 20] and induce tolerance [21, 22] by eliminating reactive CD4+ T cells [23]. This led to a long‐accepted notion that PTCy prevents GVHD by depleting reactive donor T cells. However, until recently, MHC‐mismatched allo‐HSCT was not commonly performed clinically and skin allograft mouse models may not reflect the true mechanisms of GVHD in humans. As a result, this paradigm has been recently challenged [14].
Recent studies in MHC‐matched allogeneic mouse models of GVHD have demonstrated that PTCy impairs the proliferation of reactive CD4+ and CD8+ T cells, but does not eliminate them [14]. Moreover, PTCy was able to reduce GVHD severity in these models by impairing T‐cell function. Other studies have demonstrated that Tregs are also crucial for the beneficial effects of PTCy against GVHD [10, 14, 24]. Tregs are resistant to the effects of PTCy in vitro, because of their expression of aldehyde dehydrogenase [24]. Furthermore, Tregs rapidly recover following PTCy treatment [14] and their depletion from donor grafts prevents PTCy from reducing GVHD [10, 24]. Despite a large number of studies investigating PTCy and GVHD in allogeneic mouse models, there are limited studies investigating this in preclinical humanized mouse models of GVHD, which may provide insight into clinical disease. Therefore, the current study aimed to investigate how PTCy impacts reactive human donor T cells and reduces GVHD in this preclinical model.
RESULTS
PTCy reduces the proportions of reactive human donor T cells in humanized mice
PTCy reduces GVHD in mice [14, 25] and humans [26, 27]; however, there are conflicting data regarding the mechanism behind this effect. PTCy has been shown to reduce proliferating (reactive) donor T cells [28, 29, 30]; however, other studies suggest that PTCy induces reactive T‐cell dysfunction, but not their elimination [14]. To determine whether PTCy reduces reactive human donor T cells in a humanized mouse model of GVHD, NOD‐scid‐IL2Rγnull (NSG) mice were injected intraperitoneally (i.p.) with human peripheral blood mononuclear cells (hPBMCs) labelled with carboxyfluorescein succinimidyl ester (CFSE), to track reactive donor T cells. Mice were subsequently injected (i.p.) with PTCy (33 mg kg−1) or saline on days 3 and 4 post‐hPBMC injection. The liver and spleen are known to be infiltrated with human T cells in humanized NSG mice [31]; therefore, these tissues were immunophenotyped for reactive (CFSElow) human donor T cells on day 6 (Figure 1a–h).
FIGURE 1.

PTCy depletes proliferating reactive human donor T cells in NSG mice. (a–h) NSG mice were injected (i.p.) with 20 × 106 CFSE‐stained hPBMCs and subsequently injected (i.p.) with 33 mg kg−1 PTCy or saline on days 3 and 4 post‐hPBMC injection. Mice were assessed for the depletion of reactive human donor T cells on day 6 by flow cytometry of the liver and spleen using (a–f) a consistent gating strategy. (a) Viable cells were gated based on forward scatter area (FSC‐A) and side scatter area (SSC‐A), and (b) live cells were gated based on Zombie NIR staining. (c) hCD45+ leucocytes and (d) hCD3+ T cells were then identified. (e,f) Reactive hCD3+ T cells were identified based on CFSE fluorescence in (e) saline‐mice and (f) PTCy‐mice. Example flow cytometric plots from the spleen are shown as an example. (g,h) Reactive (CFSElow) hCD3+ T cells are expressed as a percentage of total hCD3+ T cells in the (g) liver and (h) spleen. Data are presented as group means ± SEM (n = 11 saline‐mice, n = 9 PTCy‐mice); symbols represent individual mice. (g) *P < 0·05, compared with PTCy‐mice. CFSE, carboxyfluorescein succinimidyl ester, hPBMCs, human peripheral blood mononuclear cells, i.p, intraperitoneal, NSG, NOD‐scid‐IL2Rγnull, PTCy, post‐transplant cyclophosphamide
In the liver, PTCy‐mice displayed significantly reduced proportions (18·2% reduction) of reactive hCD3+ T cells (66·9 ± 2·4% hCD45+ hCD3+ CFSElow cells, n = 9) compared with saline‐mice (82·0 ± 1·5% hCD45+ hCD3+ CFSElow cells, n = 8) (P = 0·045) (Figure 1g). In the spleen, proportions of reactive hCD3+ T cells were reduced (14.4% reduction) in PTCy‐mice (47·3 ± 7·1%, n = 7) compared with saline‐mice (61·5 ± 4·0%, n = 9), which approached statistical significance (P = 0·0753) (Figure 1h). Day 6 analysis of peripheral blood had inadequate numbers to quantify hCD3+ T cells (data not shown).
PTCy reduces the proportion of human Tregs in NSG mice at end‐point
To determine the therapeutic effect of PTCy on the development of GVHD in this humanized mouse model, NSG mice were injected (i.p.) with hPBMCs and subsequently injected (i.p.) with either PTCy (33 mg kg−1) or saline on days 3 and 4 post‐hPBMC injection. Mice were monitored for clinical GVHD for up to 10 weeks, with human lymphocyte engraftment checked by flow cytometry at 3 weeks post‐hPBMC injection (blood) and end‐point (spleen) using a consistent gating strategy (Figure 2a–g).
FIGURE 2.

PTCy reduces the engraftment of human Tregs in NSG mice at end‐point. (a–q) NSG mice were injected (i.p.) with 20 × 106 hPBMCs and subsequently injected (i.p.) with 33 mg kg−1 PTCy or saline on days 3 and 4 post‐hPBMC injection. Mice were checked for the engraftment of human leucocyte subsets by flow cytometry with a consistent gating strategy (a–g) in (h–k) tail blood at 3 weeks post‐injection and (l–q) spleen at end‐point. (a) Single cells were gated by forward scatter area (FSC‐A) and height (FSC‐H), and (b) viable single lymphocytes were gated within this population using FSC‐A and side scatter (SSC‐A). (c) hCD45+ leucocytes, (d) hCD3+ T cells, (e) hCD3+ hCD4+ and hCD3+ hCD8+ T cells and (f) hCD3+ hCD4+ hCD25+ hCD127lo Tregs were then identified. (g) hCD39+ Tregs amongst total Tregs were also identified. (h, l) hCD45+ leucocytes are shown as a percentage of total mCD45+ and hCD45+ leucocytes. (i, m) hCD3+ T cells are shown as a percentage of total hCD45+ leucocytes. (j, n) hCD3+ hCD4+ and hCD3+ hCD8+ T cells are expressed as a percentage of hCD3+ T cells with the calculated (k, o) hCD4+:hCD8+ T‐cell ratio. (p) hCD3+ hCD4+ hCD25+ hCD127lo Tregs are shown as a percentage of hCD3+ hCD4+ T cells (q) hCD39+ Tregs are shown as a percentage of hCD3+ hCD4+ hCD25+ hCD127lo Tregs. (h–q) Data are presented as group means ± SEM; (h–k) n = 13 saline‐mice, n = 16 PTCy‐mice; and (l–q) n = 16 saline‐mice, n = 17 PTCy‐mice. Symbols represent individual mice: (j) *P < 0·05, compared with hCD3+ hCD4+ T cells in PTCy‐mice; (n) **P < 0·01 compared with hCD3+ hCD4+ T cells in PTCy‐mice, †† P < 0·01 compared with hCD3+ hCD8+ T cells; (o) *P < 0·05 compared with saline‐mice; and (p) ***P < 0·001 compared with PTCy‐mice. hPBMCs, human peripheral blood mononuclear cells, i.p, intraperitoneal, NSG, NOD‐scid‐IL2Rγnull, PTCy, post‐transplant cyclophosphamide, Tregs, regulatory T cells
At 3 weeks, PTCy‐ and saline‐mice demonstrated similar proportions of hCD45+ leucocytes (32·9 ± 5·1% hCD45+ mCD45− cells, n = 16 vs. 40·9 ± 4·2% hCD45+ mCD45− cells, n = 13, respectively) (P = 0·2492) (Figure 2h), which were predominantly hCD3+ T cells (PTCy: 97·4 ± 0·6%, n = 16; saline: 97·5 ± 0·5%, n = 13) (P = 0·89) (Figure 2i). Moreover, PTCy‐ and saline‐mice demonstrated comparable frequencies of hCD3+ hCD4+ T cells (35·8 ± 3·6%, n = 16 vs. 43·2 ± 3·3%, n = 13, respectively) (P = 0·23) and hCD3+hCD8+ T cells (57·1 ± 4·1%, n = 16 vs. 49·2 ± 3·7%, n = 13) (P = 0·25) (Figure 2j). Whilst the proportions of hCD3+ hCD4+ T cells were significantly lower than those of hCD3+ hCD8+ T cells in PTCy‐mice (P = 0·004), but not saline‐mice (P = 0·2365) (Figure 2j), both groups demonstrated similar hCD4+:hCD8+ T‐cell ratios (PTCy: 0·8 ± 0·1, n = 16; saline: 1·0 ± 0·1, n = 13) (P = 0·47) (Figure 2k).
At end‐point, the proportions of splenic hCD45+ leucocytes were similar between PTCy‐mice (77·4 ± 3·1%, n = 16) and saline‐mice (72·3 ± 3·0%, n = 17) (P = 0·25) (Figure 2l) and hCD3+ T cells comprised the majority of this population in both groups (PTCy: 86·4 ± 2·1%, n = 16; saline: 85·0 ± 2·1%, n = 17) (P = 0·99) (Figure 2m). However, PTCy‐mice displayed significantly higher proportions of hCD3+ hCD4+ T cells (68·2 ± 4·6%, n = 16) and significantly lower proportions of hCD3+ hCD8+ T cells (28·3 ± 3·5%, n = 16) compared with saline‐mice (hCD3+ hCD4+ cells: 50·1 ± 4·6%, n = 17, P = 0·0088; hCD3+ hCD8+ cells: 68·2 ± 4·6%, n = 17, P = 0·006) (Figure 2n). As a result, PTCy‐mice demonstrated significantly higher hCD4+:hCD8+ T‐cell ratios than saline‐mice (3·1 ± 0·5, n = 16 vs. 1·5 ± 0·5, n = 17) (P = 0·006) (Figure 2o).
In addition to the reduction in hCD3+ hCD8+ T cells, Tregs were also reduced with PTCy‐mice that demonstrated significantly reduced proportions of hCD3+ hCD4+ hCD25+ hCD127lo Tregs (2·5 ± 0·3%, n = 16) compared with saline‐mice (5·3 ± 0·6%, n = 17) (P = 0·002) (Figure 2p). Previous studies have identified an important role of CD39 in GVHD progression in humanized mice [32, 33]. In the current study, PTCy‐mice and saline‐mice demonstrated similar proportions of hCD39+ Tregs (62·4 ± 2·2%, n = 16 vs. 55·7 ± 1·4%, n = 17, respectively) (P = 0·71) (Figure 2q).
PTCy does not impact the proportions of human memory cell subsets in NSG mice at end‐point
In human allo‐HSCT recipients, increases in CD4+ and CD8+ memory T cells are associated with an increased risk for GVHD [34, 35]. Therefore, in the current study, the proportions of splenic hCD4+ and hCD8+ memory T‐cell subsets were assessed at end‐point by flow cytometry [36]. Human CD4+ and CD8+ memory T cells were classified into four subsets based on CD45‐RA and CCR7: naïve (hCD45‐RA+ hCCR7+), effector memory (EM) (hCD45‐RA− hCCR7−), central memory (CM) (hCD45‐RA− hCCR7+) and terminally differentiated effector memory (TEMRA) (hCD45‐RA+hCCR7−) [36].
PTCy‐ and saline‐mice engrafted similar proportions of hCD4+ EM T cells (PTCy: 93·0 ± 1·4%, n = 16; saline: 96·4 ± 0·7%, n = 13) (P = 0·06), which was significantly higher than all other CD4+ memory T‐cell subsets in both groups (P < 0·0001 for all) (Figure 3i). Similarly, both mouse groups demonstrated similar engraftment of hCD4+ naive (PTCy: 0·1 ± 0·1%, n = 16; saline: 0·21 ± 0·1%, n = 13) (P = 0·15), hCD4+ CM (PTCy: 0·6 ± 0·2% cells, n = 16; saline: 2·4 ± 1·2%, n = 13) (P = 0·39) and hCD4+ TEMRA (PTCy: 2·3 ± 0·8% cells, n = 16; saline: 2·9 ± 0·9% cells, n = 13) (P = 0·18) cells (Figure 3i).
FIGURE 3.

PTCy lowers the proportion of hCD38+ hCD8+ EM cells in NSG mice. (a–l) NSG mice were injected (i.p.) with 20 × 106 hPBMCs and subsequently injected (i.p.) with 33 mg kg−1 PTCy or saline on days 3 and 4 post‐hPBMC injection. Mice were checked for the engraftment of splenic human memory T‐cell subsets at end‐point using flow cytometry with a consistent gating strategy (a–h). (a) Single cells were gated by forward scatter area (FSC‐A) and height (FSC‐H), and (b) viable single lymphocytes were gated within this population using FSC‐A and side scatter (SSC‐A). (c) hCD3+ T cells, (d) hCD3+ hCD4+ and hCD3+ hCD8+ T cells were then identified. (e, g) hCD45‐RA− hCCR7− EM, hCD45‐RA+ hCCR7− TEMRA, hCD45‐RA+ hCCR7+ naïve and hCD45‐RA− hCCR7+ CM memory T‐cell subsets were then identified within (e) hCD3+ hCD4+ and (g) hCD3+ hCD8+ T‐cell subsets. (f, h) hCD38+ (f) hCD4+ and (h) hCD8+ EM cells were then identified. (i, j) Memory T‐cell subsets are expressed as a percentage of total (i) hCD3+ hCD4+ T cells and (j) hCD3+ hCD8+ T cells. (k, l) CD38+ EM cells are expressed as a percentage of (k) hCD4+ and (l) hCD8+ EM cells. (i–l) n = 13 saline‐mice, n = 17 PTCy‐mice. (i, j) *P < 0·0001 compared with naïve, CM and TEMRA cells in PTCy‐mice; † P < 0·0001 compared with naïve, CM and TEMRA cells in saline‐mice. CM, central memory; EM, effector memory; hPBMCs, human peripheral blood mononuclear cells; i.p, intraperitoneal; NSG, NOD‐scid‐IL2Rγnull; PTCy, post‐transplant cyclophosphamide; TEMRA, terminally differentiated effector memory
hCD8+ EM T cells were also found at significantly higher proportions than all other CD8+ memory T‐cell subsets in both PTCy‐ and saline‐mice (P < 0·0001 for all), with similar proportions of hCD8+ EM T cells in both groups (94·3 ± 1·4%, n = 13 vs. 93·6 ± 1·4%, n = 16, respectively) (P = 0·6935) (Figure 3k). Additionally, both groups demonstrated small, but similar, proportions of hCD8+ naive (PTCy: 0·87 ± 0·5%, n = 16; saline: 0·10 ± 0·1%, n = 13) (P = 0·54), hCD8+ CM (PTCy: 0·70 ± 0·3%, n = 16; saline: 2·03 ± 1·1%, n = 13) (P = 0·35) and hCD8+ TEMRA (PTCy: 2·12 ± 0·8%, n = 16; saline: 4·63 ± 1·2%, n = 13) (P = 0·32) cells (Figure 3k).
In human allo‐HSCT recipients, the proportions of CD38bright EM cells may predict GVHD severity [37]. Therefore, hCD38 was assessed on hCD4+ and hCD8+ EM T cells. hCD38+ hCD4+ EM cells were present in both PTCy‐ (19·0 ± 3·3%, n = 16) and saline‐mice (23·5 ± 6·1%, n = 13), at similar levels (P = 0·62) (Figure 3j). In contrast, PTCy‐mice demonstrated lower proportions of hCD38+ hCD8+ EM cells (39·6 ± 7·2%, n = 16) than saline‐mice (53·8 ± 10·3%, n = 13), but this was not significant (P = 0·22) (Figure 3l).
PTCy significantly reduces the development of GVHD in humanized NSG mice
GVHD development in humanized NSG mice was assessed by monitoring weight loss and GVHD clinical symptoms [38] for up to 10 weeks (Figure 4a–c). Weight loss was first observed from day 33 in PTCy‐mice and day 17 in saline‐mice (Figure 4a). Overall weight loss was significantly reduced in PTCy‐mice compared with saline‐mice (P = 0·0447). Both mouse groups first exhibited clinical GVHD symptoms from day 14; however, PTCy‐mice demonstrated significantly reduced mean clinical scores over 10 weeks compared with saline‐mice (P = 0·048) (Figure 4b). Finally, PTCy‐mice began to exhibit GVHD‐related mortality from day 28; however, 21% of PTCy‐mice survived to day 70 with a median survival time (MST) of 58 days. Conversely, saline‐mice exhibited GVHD‐related mortality from day 13 and all saline‐mice succumbed to GVHD by day 68, with a MST of 30·5 days. Therefore, PTCy‐mice demonstrated significantly greater overall survival than saline‐mice (P = 0·004) (Figure 4c).
FIGURE 4.

PTCy reduces the development of clinical GVHD in humanized NSG mice. (a–c) NSG mice were injected (i.p.) with 20 × 106 hPBMCs and subsequently injected (i.p.) with 33 mg kg−1 PTCy or saline on days 3 and 4 post‐hPBMC injection. Mice were monitored for the development of clinical GVHD for up to 10 weeks for (a) weight loss, (b) GVHD clinical score and (c) survival. Data represent (a, b) group means ± SEM or (c) percentage survival, (a, b) *P < 0·05 compared with PTCy‐mice. (a–c) n = 16 saline‐mice, n = 17 PTCy‐mice. (c) **P < 0·01 compared with PTCy‐mice. GVHD, graft‐versus‐host disease, hPBMCs, human peripheral blood mononuclear cells, i.p, intraperitoneal, NSG, NOD‐scid‐IL2Rγnull, PTCy, post‐transplant cyclophosphamide
PTCy‐mice demonstrate significantly reduced histological damage to the liver compared with saline‐mice
GVHD damages the liver, small intestine and skin of NSG mice injected with hPBMCs [31]. Therefore, histological assessment of these tissues was performed in the current study (Figure 5a–f). Leucocyte infiltration was reduced in the livers of PTCy‐mice (Figure 5d) compared with saline‐mice (Figure 5a). In addition, PTCy‐mice demonstrated greater preservation of hepatic structures including portal veins and bile ducts, which was not apparent in saline‐mice. Both mouse groups showed little signs of GVHD in the small intestines (Figure 5b,e). Mild GVHD was apparent in the skin from both PTCy‐ (Figure 5f) and saline‐mice (Figure 5c, with similar amounts of leucocyte infiltration and dermis detachment.
FIGURE 5.

PTCy reduces histological damage to the liver in humanized NSG mice. (a–c) NSG mice were injected (i.p.) with 20 × 106 hPBMCs and subsequently injected (i.p.) with 33 mg kg−1 PTCy or saline on days 3 and 4 post‐hPBMC injection. (a–f) At end‐point, samples of (a, d) liver, (b, e) small intestines and (c, f) skin tissue from saline‐mice (a–c) and PTCy‐mice (d–f) were sectioned (5 µm) and assessed by haematoxylin and eosin staining. (g–l) Liver tissue from PTCy‐mice and saline‐mice was sectioned (5 µm) and assessed for infiltrating (g, h) hCD4+ (red arrows) and (j, k) hCD8+ T cells (yellow arrows) using immunohistochemistry by staining with anti‐human CD4 and anti‐human CD8, respectively. (i, l) Data represent the counts of (i) hCD4+ and (l) hCD8+ T cells around fields of vessel and interstitial tissue normalized to mm2 of tissue sections. Bars represent 50 μm. Images represent tissues from four mice per group. GVHD, graft‐versus‐host disease, hPBMCs, human peripheral blood mononuclear cells, i.p, intraperitoneal, NSG, NOD‐scid‐IL2Rγnull, PTCy, post‐transplant cyclophosphamide
hCD4+ T cells are known to infiltrate the liver of humanized NSG mice with GVHD [38]. Therefore, mice in the current study were assessed for infiltrating hCD4+ and hCD8+ T cells in the liver by immunohistochemistry (Figure 5g–l). Infiltrating hCD4+ T cells and hCD8+ T cells were observed around the portal veins in both saline‐mice and PTCy‐mice. PTCy‐mice displayed a trend of reduced hCD4+ and hCD8+ T cells in the liver (hCD4+: 214·2 cells mm−2; hCD8+: 406·3 cells mm−2, n = 6 mice) compared with saline‐mice (hCD4+: 349·6 cells mm−2; hCD8+: 618·6 cells mm−2, n = 5 mice); however, this did not reach significance (hCD4+: P = 0·0992; hCD8+: P = 0·3717). A similar trend in hCD4+ T cells was also observed in the livers of PTCy‐mice and saline‐mice using immunofluorescence (Figure S1).
The proportion of human Tregs negatively correlates with survival in PTCy‐mice, but not saline‐mice
Tregs demonstrate poor survival following transplantation in clinical trials [39], but are thought to be necessary for PTCy‐mediated protection against GVHD [10, 14, 26]. Therefore, the proportion of human Tregs at end‐point were compared with mouse survival (Figure 6a,b). The proportion of human Tregs decreased over time in both groups, with these cells negatively correlating with mouse survival in PTCy‐mice (r 2 = 0·2577, P = 0·04) (Figure 6a) but not saline‐mice (r 2 = 0·1237, P = 0·18) (Figure 6b).
FIGURE 6.

PTCy reduces human Treg survival in humanized NSG mice. (a–f) NSG mice were injected (i.p.) with 20 × 106 hPBMCs and subsequently injected (i.p.) with 33 mg kg−1 PTCy or saline on days 3 and 4 post‐hPBMC injection. (a, b) Pearson's correlation of the percentage of hCD3+ hCD4+ hCD25+ hCD127lo Tregs vs. mouse survival for (a) saline‐mice and (b) PTCy‐mice. (c–f) The expression of hFOXP3 was assessed by qPCR in the (c) spleen, (d) liver, (e) small intestines and (f) skin and calculated relative to the expression of hFOXP3 in cDNA from freshly isolated hPBMCs from one human donor. (a–f) Symbols represent individual mice. Data represent (a–b) correlation of proportion of Tregs with mouse survival (n = 16 saline‐mice and n = 17 PTCy‐mice) or (c–f) group mean ± SEM (n = 4–11 per group). hFOXP3, human forkhead box protein 3, GVHD, graft‐versus‐host disease, hPBMCs, human peripheral blood mononuclear cells, i.p, intraperitoneal, NSG, NOD‐scid‐IL2Rγnull, PTCy, post‐transplant cyclophosphamide, Treg, regulatory T cell
Human Tregs are reported to be protected against PTCy depletion [10]; therefore, the relative expression of human Treg marker forkhead box protein 3 (hFOXP3) as a marker of Tregs [40] was assessed in spleens and GVHD target tissues from mice in the current study (Figure 6c–f). PTCy‐ and saline‐mice demonstrated similar relative hFOXP3 expression in the spleen (4·5 ± 2·1, n = 11 vs. 5·8 ± 2·4, n = 9, respectively) (P = 0·48) (Figure 6c), liver (PTCy: 0·6 ± 0·3, n = 9; saline: 1·0 ± 0·3, n = 7, respectively) (P = 0·32) (Figure 6d) and small intestines (PTCy: 1·5 ± 0·2, n = 11; saline: 1·4 ± 0·2, n = 11, respectively) (P = 0·98) (Figure 6e). Although hFOXP3 was detected in the skin of some PTCy‐mice (0·02 ± 0·01, n = 5) and not saline‐mice (0·0, n = 4), this difference was not significant (P = 0·12) (Figure 6f).
Relative hIL‐17A expression is significantly lower in the small intestines of PTCy‐mice compared with saline‐mice
IL‐17 and IFN‐γ are important inflammatory cytokines that can be released by CD4+ and CD8+ T cells, which drive GVHD pathogenesis [6, 41]. Therefore, the relative expression of human IL‐17A (hIL17A) and human IFN‐γ (hIFNG) was assessed in PTCy‐ and saline‐mice by qPCR (Figure 7a–h). Both PTCy‐ and saline‐mice demonstrated comparable relative hIL17A expression in the spleen (3·4 ± 0·7, n = 11 vs. 3·8 ± 1·2, n = 11, respectively) (P = 0·96) (Figure 7a) and liver (3·0 ± 1·0, n = 10 vs. 3·4 ± 0·9, n = 10, respectively) (P = 0·79) (Figure 7b). In contrast, the relative hIL17A expression in the small intestines of PTCy‐mice (3·3 ± 0·6, n = 11) was significantly reduced (60·8% reduction) compared with saline‐mice (8·4 ± 2·0, n = 9) (P = 0·02) (Figure 7c). Relative hIL17A expression was fourfold higher in the skin of saline‐mice (0·3 ± 0·3, n = 4) compared with PTCy‐mice (0·06 ± 0·03, n = 5), but this did not reach significance (P = 0·44) (Figure 7d).
FIGURE 7.

PTCy significantly reduces relative hIL17A expression in the small intestine of humanized NSG mice. (a–h) NSG mice were injected (i.p.) with 20 × 106 hPBMCs and subsequently injected (i.p.) with 33 mg kg−1 PTCy or saline on days 3 and 4 post‐hPBMC injection. The relative expression of (a–d) hIL17A and (e–h) hIFNG in the (a, e) spleen, (b, f) liver, (c, g) small intestine and (d, h) skin at end‐point was examined by qPCR. (a–h) Data represent group mean ± SEM (n = 4–11 mice per group). (c) * P < 0·05 compared with PTCy‐mice. GVHD, graft‐versus‐host disease, hPBMCs, human peripheral blood mononuclear cells, hIFNG, interferon‐gamma, hIL17A, human interleukin‐17A, i.p, intraperitoneal, NSG, NOD‐scid‐IL2Rγnull, PTCy, post‐transplant cyclophosphamide
Relative splenic hIFNG expression was twofold higher in PTCy‐mice (4·9 ± 1·3, n = 11) than in saline‐mice (2·4 ± 0·7, n = 9), which approached significance (P = 0·24) (Figure 7e). Relative hIFNG expression in the liver (PTCy: 2·6 ± 0·7, n = 9; saline: 2·5 ± 0·4, n = 10) (Figure 7f), small intestines (PTCy: 2·1 ± 0·8, n = 11; saline: 1·8 ± 0·5, n = 11) (Figure 7g) and skin (PTCy: 1·6 ± 1·0, n = 5; saline: 2·1 ± 1·7, n = 4) (Figure 7h) was not significantly different between groups (liver: P = 0·84; small intestines: P = 0·68; skin: P = 0·58). In the spleen and liver, similar trends for hIFNG expression were also observed with the alternative use of the housekeeping genes hC‐Cβ and hPOLR2A (Figure S2).
IL‐17 and IFN‐γ are released by GVHD effector T cells [42]; therefore, the relative expression of the human T‐cell transcription factors RORγ (hRORC), T‐bet (hTBX21) and GATA3 (hGATA3), representing Th17, Th1 and Th2 cells [43], was also assessed in mouse spleens and GVHD target tissue. Each of these transcription factors was present in spleen, liver, small intestines and skin of most mice. However, there were no statistically significant differences in the expression of these transcription factors between PTCy‐mice and saline‐mice in any tissue (Figure S3).
PTCy does not affect the concentration of serum T‐cell cytokines in humanized NSG mice at end‐point
T‐cell cytokines play crucial roles in GVHD pathogenesis [1] and are reduced in the sera of mice treated with PTCy in allogeneic models of GVHD [14]. Therefore, in the current study, a flow cytometric multiplex cytokine assay was performed to determine the serum concentrations of T‐cell cytokines (hIL‐2, hIL‐6, hIL‐10, hIFNγ and human tumour necrosis factor alpha (TNF‐α) in humanized NSG mice (Figure 8a–e). The hIL‐2 concentration in PTCy‐mice (4·1 ± 0·6 pg ml−1, n = 12) was 1·4‐fold higher than in saline‐mice (2·9 ± 0·2 pg ml−1, n = 12), and this approached statistical significance (P = 0·07) (Figure 8a). Both PTCy‐ and saline‐mice demonstrated similar concentrations of serum hIL‐6 (9·5 ± 3·8 pg ml−1, n = 14 vs. 5·9 ± 1·6 pg ml−1, n = 15, respectively) (P = 0·37) (Figure 8b), hIL‐10 (32·9 ± 5·6 pg ml−1, n = 15 vs. 50·1 ± 11·9 pg ml−1, n = 14, respectively) (P = 0·19) (Figure 8c) and hTNF‐α (26·7 ± 3·4 pg ml−1, n = 14 vs. 28·8 ± 5·2 pg ml−1, n = 14, respectively) (P = 0·74) (Figure 8d). Finally, both groups demonstrated similar and relatively high concentrations of serum hIFN‐γ (19 500 ± 2078 pg ml−1, n = 14 vs. 15 934 ± 2371 pg ml−1, n = 14, respectively) (P = 0·27) (Figure 8e).
FIGURE 8.
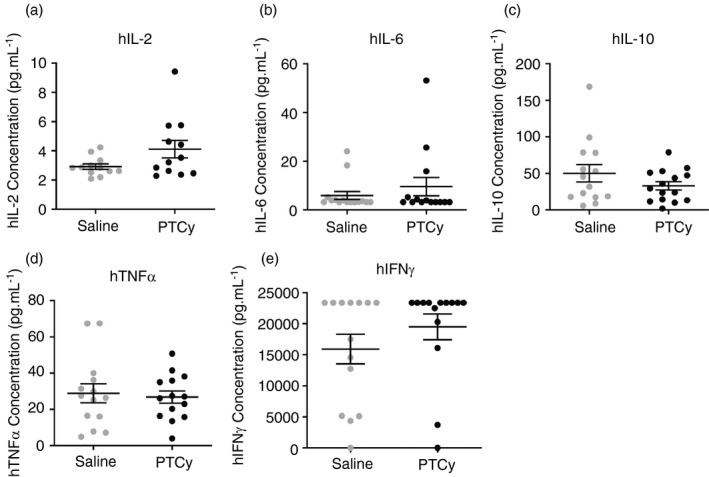
PTCy does not influence the concentrations of T‐cell cytokines in the serum of humanized NSG mice. (a–e) NSG mice were injected (i.p.) with 20 × 106 hPBMCs and subsequently injected (i.p.) with 33 mg kg−1 PTCy or saline on days 3 and 4 post‐hPBMC injection. (a–e) Concentrations of serum (a) hIL‐2, (b) hIL‐6, (c) hIL‐10, (d) hTNF‐α and (e) hIFN‐γ. (a–e) Data represent group mean ± SEM (n = 12–18 per group). Symbols represent individual mice. GVHD, graft‐versus‐host disease, h, human being, hPBMCs, human peripheral blood mononuclear cells, IFN‐γ, interferon‐gamma, IL, interleukin i.p, intraperitoneal, NSG, NOD‐scid‐IL2Rγnull, PTCy, post‐transplant cyclophosphamide, TNF‐α, tumour necrosis factor alpha
DISCUSSION
This study demonstrates that PTCy lowers the severity and delays the onset of GVHD in humanized NSG mice. This corresponded to a reduction in the proportions of reactive human donor T cells in the liver and, to a lesser extent, the spleen at an early time‐point. Notably, PTCy improved mouse survival and reduced histological liver damage. Moreover, the expression of IL‐17, a key cytokine in GVHD pathogenesis [6], was reduced in the small intestines of PTCy‐mice. In contrast to the less severe GVHD, PTCy‐mice demonstrated increased splenic hCD4+:hCD8+ T‐cell ratios and reduced proportions of human Tregs.
The current study demonstrates that PTCy depletes reactive human donor T cells in humanized NSG mice. This parallels allogeneic mouse models of GVHD where PTCy has been shown to deplete reactive donor T cells [23, 30, 44]. Other studies have reported that 25 mg kg−1 PTCy on days 3 and 4 post‐allo‐HSCT reduces proliferating CD3+ CD4+ effector T cells on day 7 [45]. In the current study, reactive human donor T cells in PTCy‐mice were significantly reduced in the liver and not the spleen, although this almost reached significance. This was most likely a result of PTCy being metabolized in the liver [46], but also provides the first demonstration of tissue‐specific effects of PTCy in GVHD. PTCy may be impacting chemotaxis and cell migration to the liver, but there are limited studies investigating this. CXCR6, a trafficking marker involved in the recruitment of human leucocytes to the liver [47], is upregulated on CD38+ CD8+ EM cells [48]. This may account for the increased liver leucocytes in saline‐mice compared with PTCy‐mice as we observed reduced splenic hCD38+ hCD8+ EM cells in PTCy‐mice, suggesting these cells were in other tissue. Interestingly, a recent allogeneic mouse study has suggested that PTCy reduces GVHD by inducing T‐cell functional impairment and not their depletion [14]. In the current study, in addition to the reduction in hCD3+CD8+ T cells and human Tregs, we have some evidence of loss of functionality with the reduction in IL‐17 production.
In allogeneic mouse models, PTCy has been shown to reduce GVHD by depleting GVHD effector T cells [44] and causing their dysfunction [14] (effector arm), or by enhancing Tregs [10]. Notably, in the current study, PTCy increased splenic hCD4+:hCD8+ T‐cell ratios in humanized NSG mice which is associated with clinical GVHD [49]. Therefore, our results may suggest that PTCy reduces GVHD in humanized NSG mice by functioning predominantly through the effector arm and depleting specific T‐cell subsets. Supporting this, in allogeneic mouse models of GVHD, PTCy has been shown to have differential effects on the proliferation of reactive CD4+ and CD8+ T cells [14]. This could be confirmed in future studies with our model by performing intracellular staining to measure the expression of cytokines or transcription factors on cells isolated from GVHD target organs.
In the current study, PTCy reduced splenic human Tregs. This was unexpected given the important role for Tregs in preventing GVHD [16, 17] and that Tregs are necessary for PTCy to reduce GVHD [10, 14, 26]. Moreover, Tregs are reported to be resistant to PTCy depletion [24] and inversely correlate with GVHD severity in humanized NSG mice [50, 51]. We hypothesize that the contrasting results between the current results and earlier clinical and preclinical work reflect the timing when Tregs were assessed and that PTCy is rarely used as sole GVHD prophylaxis, as was the case in the current study. These earlier studies typically assessed Tregs before day 30, whereas Tregs in the current study were only assessed at end‐point. As the MST of PTCy‐mice in our study was 58 days, the possibility remains that Tregs may have been preserved earlier but eventually succumb to death, possibly due to the absence of specific factors to maintain their survival [52]. This could be confirmed by performing time‐culled studies and examining how the levels of Tregs and other immune subsets (Th17 cells) alter over time. Further, IL‐2 is absolutely essential for the proliferation and maintenance of human Tregs, and T cells are prominent producers of IL‐2 in humans and mice [53]. As NSG mice are deficient in functional T cells, engrafted human T cells are likely to be the most prominent source of IL‐2 in our humanized mouse model. Given the rarity of human Tregs, it is possible that they may have been outcompeted for IL‐2 by other cells that highly express CD25, such as activated conventional T cells (Tcons) and natural killer (NK) cells, causing them to perish by end‐point. Moreover, as we used surface markers to detect Tregs it may be that these cells were still present but had downregulated CD25 or upregulated CD127. This is suggested by the equivalent levels of hFOXP3 by qPCR in all tissues except liver, implying the presence of Tregs in these tissues. Therefore, future studies could use immunohistochemistry to quantify tissue‐resident Tregs and, in the liver, see whether increased Tregs are associated with the reduced histological damage. Importantly, in the current study, PTCy reduced the percentages of Tregs; however, we did not assess splenic Treg numbers, which is an important indicator of immune function. PTCy can increase Treg number in allogeneic mouse models of GVHD [54], but there are limited data in humanized mice. We have previously observed human Tregs in humanized NSG mice with GVHD [31, 38, 49, 55]; however, PTCy is the first treatment in our laboratory to impact these cells in this model. This may validate the impact of PTCy on human Tregs in the current study.
Studies investigating PTCy in humanized mouse models of GVHD are limited, but the current results parallel previous reports [10, 24] that showed abrogated GVHD and reduced reactive donor T cells in humanized mice receiving 100 mg kg−1 PTCy on day 3. Although the current study used a lower dose of PTCy, 33mg kg−1 is a standard clinical dosage following allo‐HSCT [8]. Furthermore, administration of 33 mg kg−1 PTCy on days 3 and 4 is an optimal dosage in clinical settings [8], which also reduces the chances of toxicity that is associated with higher PTCy doses. Supporting the PTCy dose in the current study, a recent study using allogeneic allo‐HSCT mouse models demonstrated that 25–33 mg kg−1 PTCy on days 3 and 4 is an optimal dose to prevent GVHD in mice, compared with single doses up to 200 mg kg−1 on day 3 and up to 50 mg kg−1 on days 3 and 4 [45]. Finally, the lower GVHD severity and delayed onset in PTCy‐mice are consistent with clinical allo‐HSCT [59], as PTCy does not prevent GVHD in this setting.
In the current study, PTCy did not influence the concentration of serum cytokines or the expression of T‐cell transcription factors in humanized NSG mice. This suggests that PTCy does not impede the potential for immune responses and may account for why PTCy does not increase rates of cancer relapse or infection [13]. However, the reduced GVHD in PTCy‐mice was accompanied by a reduction in the relative expression of hIL17A in the small intestines. Consistent with this, hIL17A expression is reduced in the small intestines of humanized NSG mice with subclinical GVHD compared to those with clinical GVHD [49]. Furthermore, in allogeneic mouse models of GVHD Th17 cells are implicated in directing small intestine damage [60]. Whilst the reduced expression of hIL‐17 did not correspond to reduced histological gut GVHD, our results imply that PTCy reduced GVHD by reducing Th17 cells in tissue. In the current study, PTCy did not impact the final concentration of T‐cell cytokines in the serum, contrasting allogeneic mouse models [14] and perhaps reflecting an earlier cytokine surge in this model. This may warrant investigating serum cytokines at earlier times in this model.
In conclusion, this study has demonstrated that PTCy delays disease in a humanized mouse model of GVHD. Although this resulted in delayed GVHD, the majority of PTCy‐mice still developed GVHD by experimental end‐point. In this humanized mouse model, PTCy alone did not prevent GVHD. PTCy reduced GVHD in humanized NSG mice, which appeared to be through the effector arm, rather than through greater or more effective Tregs. As human Tregs are known to protect against GVHD [61], our results warrant investigation into strategies to increase Tregs alongside PTCy depletion. This could include combining PTCy with low‐dose interleukin‐2 [62] alone, or in combination with rapamycin [63, 64], to further reduce, or prevent, GVHD in this humanized mouse model and in clinical allo‐HSCT.
MATERIALS AND METHODS
Antibodies
R‐phycoerythrin (PE)‐conjugated mouse anti‐hCD25 (clone: M‐A251) and mouse anti‐hCD45‐RA (clone: HI100) monoclonal antibodies (mAb); PE‐cyanine 7 (PE‐Cy7)‐conjugated mouse anti‐hCD8 (clone: RPA‐T8); peridinin–chlorophyll–protein–cyanine 5.5 (PerCP‐Cy5.5)‐conjugated mouse anti‐hCD4 (clone: SK3) and rat anti‐mouse CD45 (clone: 30‐F11) mAb; allophycocyanin (APC)‐conjugated mouse anti‐hCD45 (clone: HI30), mouse anti‐hCD38 (clone: HIT2) and mouse anti‐hCD39 (clone: TU66) mAb; Brilliant Violet 711 (BV711)‐conjugated mouse anti‐hCD3 (clone: UCHT1) mAb; and Brilliant Violet 421 (BV421)‐conjugated mouse anti‐hCD127 (clone: HL‐7R‐M21) and mouse anti‐hCD197 (CCR7) (clone: 150503) were obtained from BD Biosciences (San Jose, USA).
Mice
All experiments involving mice were approved by the University of Wollongong Animal Ethics Committee (Wollongong, Australia). Female NSG mice (aged 6–7 weeks) were obtained from Australian BioResources (Moss Vale, Australia) and were acclimatized for one week prior to study. Mice were exposed to a 12‐h light/12‐h dark cycle and housed in individually ventilated cages (Tecniplast; Buguggiate, Italy) and provided with autoclaved food and water, ad libitum.
Isolation of hPBMCs
Experiments using human blood were conducted with approval from the University of Wollongong Human Ethics Committee (Wollongong, Australia). Peripheral blood was collected from consenting healthy human donors (n = 4 male and 2 female, 24–28 years of age) by venepuncture into VACUETTE® lithium heparin tubes (Greiner Bio‐One; Frickenhausen, Germany). hPBMCs were isolated from peripheral blood using density gradient centrifugation (560 × g for 30 min) with Ficoll–Paque PLUS (GE Healthcare; Uppsala, Sweden), as described [38]. hPBMCs were washed with sterile Dulbecco's phosphate‐buffered saline (PBS) (Thermo Fisher Scientific; Waltham, USA) (300 × g for 10 min) twice and resuspended at 10 × 106 cells ml−1 for staining with CFSE (Thermo Fisher Scientific).
CFSE staining
hPBMCs were stained with CFSE as per the manufacturer's instructions. Briefly, CFSE powder was reconstituted in DMSO to a concentration of 5 mm. hPBMCs (10 × 106 cells ml−1) were incubated with CFSE (final concentration of 5 μm CFSE) at 37°C for 20 min, protected from light. CFSE‐stained hPBMCs were incubated in RPMI‐1640 medium (Thermo Fisher Scientific) containing 10% fetal calf serum (FCS) (Bovogen Biologicals; Keilor East, Australia) for 5 min, washed with sterile PBS (300 × g for 10 min) and resuspended at 100 × 106 cells ml−1 for injection into NSG mice.
Humanized mouse model of GVHD
NSG mice were injected intraperitoneally (i.p.) with 20 × 106 CFSE‐stained hPBMCs and subsequently injected (i.p.) with either PTCy (33 mg kg−1) (Sigma‐Aldrich, St Louis, USA) or saline (PBS) (Thermo Fisher Scientific) on days 3 and 4 post‐hPBMC injection [30]. Mice were monitored for clinical GVHD development for up to 10 weeks as described [38], in a blinded fashion. Mice were assessed for the engraftment of hPBMCs at 3 weeks post‐hPBMC injection (tail blood) and at end‐point (spleen) by flow cytometric immunophenotyping [35]. In some mice, the proportion of reactive human donor T cells was assessed at day 6 post‐hPBMC injection by immunophenotyping of the spleen, liver and blood.
Immunophenotyping
Immunophenotyping was performed on cells isolated from mouse blood, liver and spleen. Cells were isolated from mouse tissue as previously described [31, 38, 58] and incubated with fluorochrome‐conjugated mAbs in PBS containing 2% FCS and washed once in PBS (300 × g for 3 min). Data were collected using a BD Biosciences LSRFortessa X‐20 flow cytometer (using the band pass filters 450/50 for BV421, 710/50 for BV711, 586/15 for PE, 780/60 for PE‐Cy7, 670/30 for APC and 695/40 for PerCP) and BD Biosciences FACSDiva software v8.0. Immune cell populations were analysed with FlowJo software v8.7.1 (BD).
Haematoxylin and eosin staining
Samples of liver, small intestine and skin from euthanized mice were fixed overnight in neutral buffered (10%) formalin (Sigma‐Aldrich) and embedded in paraffin. Tissues were sectioned (5 µm) using a Leica Biosystems (Wetzlar, Germany) RM2255 microtome and stained with haematoxylin and eosin (POCD; Artarmon, Australia) [58]. Histology was assessed using a Leica DM750 inverted light microscope at 20× objective and Leica application suite software version 4.7.
Immunohistochemistry
Immunohistochemical staining of hCD4+ and hCD8+ cells was performed on formalin‐fixed paraffin‐embedded liver sections (5 μm). After dewaxing and rehydration, antigen retrieval was performed, and sections were blocked in normal rabbit serum (16120‐099; Thermo Fisher Scientific). Primary antibodies used were rabbit anti‐human CD4 (1·42 μg ml−1, clone EPR6855, ab133616, Abcam) and mouse anti‐human CD8 (7·95 μg ml−1, clone C8/144B, M7103, Dako). Secondary antibodies used were anti‐mouse HRP (ready‐to‐use, K4001, Dako) and anti‐rabbit HRP (6·5 μg ml−1, P044801‐2, Dako). Slides were incubated in DAB (K3468, Dako) and counterstained with the Harris haematoxylin. Slides were imaged using the Hamamatsu NanoZoomer.
Cell counting of hCD4 and hCD8 was carried out using the Aperio ImageScope (v.12.4.3.5008; Leica Biosystem). Fields of vessel and interstitial tissue were randomly selected, and positive staining cells were manually counted. Total number of positive cells was calculated and normalized to mm2 for statistical analysis.
Immunofluorescence
Immunofluorescence staining of hCD4+ T cells was performed on sections (5 μm) of paraffin‐embedded liver tissue as previously described [64]. Sections were stained with rabbit anti‐human CD4 (clone: EPR6855) mAb (Abcam; Cambridge, UK) and donkey anti‐rabbit IgG (clone: TRITC) secondary antibody (JacksonImmuno; West Grove, USA) and counterstained using DAPI nuclear stain (Vector Laboratories; San Francisco, USA). Slides were assessed on an Olympus Life Science (Tokyo, Japan) FV 1000 confocal microscope and Olympus Life Science FV10‐ASW software.
Quantitative real‐time PCR
Quantitative real‐time PCR (qPCR) was performed on complementary DNA (cDNA) synthesized from RNA extracted from mouse tissue. Following euthanasia, samples of spleen, liver and small intestines were stored in RNAlater (Sigma‐Aldrich), and RNA was extracted using TRIzol reagent (Thermo Fisher Scientific), as per the manufacturer's instructions, and stored at −80°C. RNA was isolated from flank skin samples stored in RNAlater using ISOLATE II RNA Mini Kit (Bioline) as per the manufacturer's instructions. cDNA was synthesized from RNA using the qScript cDNA Supermix Kit (Quanta Biosciences; Beverly, USA), as per the manufacturer's instructions. cDNA quality was checked as described [38] and stored at −20°C. qPCR was conducted with TaqMan Universal Master Mix II (Thermo Fisher Scientific) according to the manufacturer's instructions with FAM‐labelled human FOXP3 (Hs01085834_m1), human IFNG (Hs00989291_m1), human IL‐17A (Hs00174383_m1), human RORC (Hs00172858_m1), human GATA3 (Hs00231122_m1) and human TBX21 (Hs00894392_m1) fluorescent primers, with VIC‐labelled human HPRT1 (Hs99999909_m1), human C‐CB (AIGJQLZ) or human POLR2A (Hs00172187_m1) as a housekeeping gene. qPCR was performed as previously described [33].
LEGENDplex™
Serum was isolated from mouse blood, collected by cardiac puncture and stored at −80°C as described [58]. The concentration of hIFN‐γ, hIL‐2, hIL‐6, hIL‐10 and hTNF‐α was measured in mouse sera using a BioLegend (San Diego, USA) LEGENDplex™ Human Th1 Panel (5‐plex) kit, as per the manufacturer's instructions. Data were collected using a BD LSRFortessa X‐20 flow cytometer and FACSDiva software version 8.0, and analysed using LEGENDplex™ data analysis software version 8.0.
Statistical analysis
All data are given as a mean ± standard error of the mean (SEM). All data were tested for normality (Shapiro–Wilk), and statistical differences were calculated using a two‐tailed Student t‐test (parametric) or Mann–Whitney test (non‐parametric) for single comparisons, or a one‐way analysis of variance (ANOVA) with Tukey's post hoc test for multiple comparisons. Comparisons of mouse weight and clinical score were completed using a two‐way ANOVA. Mouse survival was analysed using a log‐rank (Mantel–Cox) test. All statistical analysis and graphs were generated using the GraphPad Prism software version 8.0 (GraphPad Software; La Jolla, USA). For all analysis, differences were considered significant if P < 0·05.
CONFLICT OF INTEREST
Sam R. Adhikary, Peter Cuthbertson, Leigh Nicholson, Katrina M. Bird, Chloe Sligar, Min Hu, Philip J O'Connell, Ronald Sluyter, Stephen I. Alexander and Debbie Watson declare that they have no conflict of interest.
AUTHOR CONTRIBUTIONS
SRA, RS, DW and SA conceived and designed the project. SRA performed the majority of experiments. PC assisted with murine models. LN performed immunofluorescence and immunohistochemistry. KB and CS provided assistance with qPCR and performed experimental work. SRA drafted the manuscript. RS, DW and SA revised the manuscript. All authors edited the manuscript.
Supporting information
Figure S1
Figure S2
Figure S3
ACKNOWLEDGMENTS
The authors thank all blood donors who contributed to this study, and Jonathan Williams (University of Wollongong) and Diane Ly (University of Wollongong) for collecting donor blood. We also thank Nicholas Geraghty (University of Wollongong), the technical staff of the Illawarra Health and Medical Research Institute (Wollongong, Australia) and the animal staff of the University of Wollongong Rodent Facility for technical support.
Adhikary SR, Cuthbertson P, Nicholson L, Bird KM, Sligar C, Hu M, et al. Post‐transplant cyclophosphamide limits reactive donor T cells and delays the development of graft‐versus‐host disease in a humanized mouse model. Immunology. 2021;164:332–347. 10.1111/imm.13374
Funding information
This project was funded by the Cancer Council NSW, Molecular Horizons and the Faculty of Science, Medicine and Health, University of Wollongong. Sam R. Adhikary, Peter Cuthbertson and Katrina M. Bird are supported through Australian Government Research Training Program Scholarships. Debbie Watson was also supported by AMP’s Tomorrow Fund. Min Hu was a recipient of an early career fellowship from the NHMRC (GNT1013185) and a Deputy Vice Chancellor University of Sydney research fellowship (IRMA178768)
REFERENCES
- 1.Markey KA, MacDonald KP, Hill GR. The biology of graft‐versus‐host disease: experimental systems instructing clinical practice. Blood. 2014;124:354–62. [DOI] [PMC free article] [PubMed] [Google Scholar]
- 2.Schultz KR, Kariminia A, Ng B, Abdossamadi S, Lauener M, Nemecek ER, et al. Immune profile differences between chronic GVHD and late acute GVHD: results of the ABLE/PBMTC 1202 studies. Blood. 2020;135:1287–98. [DOI] [PMC free article] [PubMed] [Google Scholar]
- 3.Zhang Y, Joe G, Hexner E, Zhu J, Emerson SG. Alloreactive memory T cells are responsible for the persistence of graft‐versus‐host disease. J Immunol. 2005;174:3051–8. [DOI] [PubMed] [Google Scholar]
- 4.Gendelman M, Yassai M, Tivol E, Krueger A, Gorski J, Drobyski WR. Selective elimination of alloreactive donor T cells attenuates graft‐versus‐host disease and enhances T‐cell reconstitution. Biol Blood Marrow Transplant. 2003;9:742–52. [DOI] [PubMed] [Google Scholar]
- 5.Fowler DH. Shared biology of GVHD and GVT effects: potential methods of separation. Crit Rev Oncol Hematol. 2006;57:225–44. [DOI] [PubMed] [Google Scholar]
- 6.Kappel LW, Goldberg GL, King CG, Suh DY, Smith OM, Ligh C, et al. IL‐17 contributes to CD4‐mediated graft‐versus‐host disease. Blood. 2009;113:945–52. [DOI] [PMC free article] [PubMed] [Google Scholar]
- 7.Vadakekolathu J, Rutella S. T‐cell manipulation strategies to prevent graft‐versus‐host disease in haploidentical stem cell transplantation. Biomedicines. 2017;5:33. [DOI] [PMC free article] [PubMed] [Google Scholar]
- 8.Kanakry CG, Fuchs EJ, Luznik L. Modern approaches to HLA‐haploidentical blood or marrow transplantation. Nat Rev Clin Oncol. 2016;13:10–24. [DOI] [PMC free article] [PubMed] [Google Scholar]
- 9.Pierini A, Ruggeri L, Mancusi A, Carotti A, Falzetti F, Terenzi A, et al. T cell depletion and no post transplant immune suppression allow separation of graft versus leukemia from graft versus host disease. Bone Marrow Transplant. 2019;54:775–9. [DOI] [PubMed] [Google Scholar]
- 10.Ganguly S, Ross DB, Panoskaltsis‐Mortari A, Kanakry CG, Blazar BR, Levy RB, et al. Donor CD4+Foxp3+ regulatory T cells are necessary for posttransplantation cyclophosphamide‐mediated protection against GVHD in mice. Blood. 2014;124:2131–41. [DOI] [PMC free article] [PubMed] [Google Scholar]
- 11.McCurdy SR, Kanakry JA, Showel MM, Tsai HL, Bolaños‐Meade J, Rosner GL, et al. Risk‐stratified outcomes of nonmyeloablative HLA‐haploidentical BMT with high‐dose posttransplantation cyclophosphamide. Blood. 2015;125:3024–31. [DOI] [PMC free article] [PubMed] [Google Scholar]
- 12.Luznik L, O'Donnell PV, Symons HJ, Chen AR, Leffell MS, Zahurak M, et al. HLA‐haploidentical bone marrow transplantation for hematologic malignancies using nonmyeloablative conditioning and high‐dose, posttransplantation cyclophosphamide. Biol Blood Marrow Transplant. 2008;14:641–50. [DOI] [PMC free article] [PubMed] [Google Scholar]
- 13.Majzner RG, Mogri H, Varadhan R, Brown P, Cooke KR, Bolaños‐Meade J, et al. Post‐transplantation cyclophosphamide after bone marrow transplantation is not associated with an increased risk of donor‐derived malignancy. Biol Blood Marrow Transplant. 2017;23:612–7. [DOI] [PMC free article] [PubMed] [Google Scholar]
- 14.Wachsmuth LP, Patterson MT, Eckhaus MA, Venzon DJ, Gress RE, Kanakry CG. Post‐transplantation cyclophosphamide prevents graft‐versus‐host disease by inducing alloreactive T cell dysfunction and suppression. J Clin Invest. 2019;129:2357–73. [DOI] [PMC free article] [PubMed] [Google Scholar]
- 15.Wachsmuth LP, Patterson MT, Eckhaus MA, Venzon DJ, Kanakry CG. Optimized timing of post‐transplantation cyclophosphamide in MHC‐haploidentical murine hematopoietic cell transplantation. Biol Blood Marrow Transplant. 2020;26:230–41. [DOI] [PMC free article] [PubMed] [Google Scholar]
- 16.Di Ianni M, Falzetti F, Carotti A, Terenzi A, Castellino F, Bonifacio E, et al. Tregs prevent GVHD and promote immune reconstitution in HLA‐haploidentical transplantation. Blood. 2011;117:3921–8. [DOI] [PubMed] [Google Scholar]
- 17.Ruggeri L, Di Ianni M, Urbani E, Mancusi A, Falzetti F, Carotti A, et al. Tregs suppress GvHD at the periphery and unleash the Gvl effect in the bone marrow. Blood. 2014;124:842–51.25247213 [Google Scholar]
- 18.Al‐Homsi AS, Roy TS, Cole K, Feng Y, Duffner U. Post‐transplant high‐dose cyclophosphamide for the prevention of graft‐versus‐host disease. Biol Blood Marrow Transplant. 2015;21:604–11. [DOI] [PubMed] [Google Scholar]
- 19.Berenbaum MC, Brown IN. Dose‐response relationships for agents inhibiting the immune response. Immunology. 1964;7:65–71. [PMC free article] [PubMed] [Google Scholar]
- 20.Berenbaum MC, Brown IN. Prolongation of homograft survival in mice with single doses of cyclophosphamide. Nature. 1963;200:84. [DOI] [PubMed] [Google Scholar]
- 21.Nirmul G, Severin C, Taub RN. Mechanisms and kinetics of cyclophosphamide‐induced specific tolerance to skin allografts in mice. Transplant Proc. 1973;5:675–8. [PubMed] [Google Scholar]
- 22.Nirmul G, Severin C, Taub RN. Cyclophosphamide‐induced immunologic tolerance to skin homografts. Surg Forum. 1971;22:287–8. [PubMed] [Google Scholar]
- 23.Eto M, Mayumi H, Tomita Y, Yoshikai Y, Nishimura Y, Maeda T, et al. Specific destruction of host‐reactive mature T cells of donor origin prevents graft‐versus‐host disease in cyclophosphamide‐induced tolerant mice. J Immunol. 1991;146:1402–9. [PubMed] [Google Scholar]
- 24.Kanakry CG, Ganguly S, Zahurak M, Bolanos‐Meade J, Thoburn C, Perkins B, et al. Aldehyde dehydrogenase expression drives human regulatory T cell resistance to posttransplantation cyclophosphamide. Sci Transl Med. 2013;5:211ra157. [DOI] [PMC free article] [PubMed] [Google Scholar]
- 25.Luznik L, Bolaños‐Meade J, Zahurak M, et al. High‐dose cyclophosphamide as single‐agent, short‐course prophylaxis of graft‐versus‐host disease. Blood. 2010;115:3224–30. [DOI] [PMC free article] [PubMed] [Google Scholar]
- 26.Wang Y, Chang Y‐J, Chen L, Xu LP, Bian ZL, Zhang XH, et al. Low‐dose post‐transplant cyclophosphamide can mitigate GVHD and enhance the G‐CSF/ATG induced GVHD protective activity and improve haploidentical transplant outcomes. Oncoimmunology. 2017;6:e1356152. [DOI] [PMC free article] [PubMed] [Google Scholar]
- 27.Kanakry CG, Tsai HL, Bolanos‐Meade J, Smith BD, Gojo I, Kanakry JA, et al. Single‐agent GVHD prophylaxis with posttransplantation cyclophosphamide after myeloablative, HLA‐matched BMT for AML, ALL, and MDS. Blood. 2014;124:3817–27. [DOI] [PMC free article] [PubMed] [Google Scholar]
- 28.O'Donnell PV, Luznik L, Jones RJ, Vogelsang GB, Leffell MS, Phelps M, et al. Nonmyeloablative bone marrow transplantation from partially HLA‐mismatched related donors using posttransplantation cyclophosphamide. Biol Blood Marrow Transplant. 2002;8:377–86. [DOI] [PubMed] [Google Scholar]
- 29.Roberto A, Castagna L, Zanon V, Bramanti S, Crocchiolo R, McLaren JE, et al. Role of naive‐derived T memory stem cells in T‐cell reconstitution following allogeneic transplantation. Blood. 2015;125:2855–64. [DOI] [PMC free article] [PubMed] [Google Scholar]
- 30.Ross D, Jones M, Komanduri K, Levy RB. Antigen and lymphopenia‐driven donor T cells are differentially diminished by post‐transplantation administration of cyclophosphamide after hematopoietic cell transplantation. Biol Blood Marrow Transplant. 2013;19:1430–8. [DOI] [PMC free article] [PubMed] [Google Scholar]
- 31.Cuthbertson P, Adhikary SR, Geraghty NJ, Guy TV, Hadjiashrafi A, Fuller SJ, et al. Increased P2X7 expression in the gastrointestinal tract and skin in a humanised mouse model of graft‐versus‐host disease. Clin Sci. 2020;134:207–23. [DOI] [PubMed] [Google Scholar]
- 32.Gu J, Ni X, Pan X, Lu H, Lu Y, Zhao J, et al. Human CD39hi regulatory T cells present stronger stability and function under inflammatory conditions. Cell Mol Immunol. 2017;14:521–8. [DOI] [PMC free article] [PubMed] [Google Scholar]
- 33.Adhikary SR, Cuthbertson P, Turner RJ, Sluyter R, Watson D. A single‐nucleotide polymorphism in the human ENTPD1 gene encoding CD39 is associated with worsened graft‐versus‐host disease in a humanized mouse model. Immunol Cell Biol. 2020;98:397–410. [DOI] [PubMed] [Google Scholar]
- 34.de Latour RP, Porcher R, Vanneaux V, Vanneaux V, Robin M, Xhaard A, et al. High numbers of memory T cells are associated with higher risk of Grade II‐IV Acute Gvhd after human allogeneic transplantation. Blood. 2013;122:2061. [Google Scholar]
- 35.Loschi M, Porcher R, Peffault de Latour R, Vanneaux V, Robin M, Xhaard A, et al. High number of memory T cells is associated with higher risk of acute graft‐versus‐host disease after allogeneic stem cell transplantation. Biol Blood Marrow Transplant. 2015;21:569–74. [DOI] [PubMed] [Google Scholar]
- 36.Mullen KM, Gocke AR, Allie R, Ntranos A, Grishkan IV, Pardo C, et al. Expression of CCR7 and CD45RA in CD4+ and CD8+ subsets in cerebrospinal fluid of 134 patients with inflammatory and non‐inflammatory neurological diseases. J Neuroimmunol. 2012;249:86–92. [DOI] [PMC free article] [PubMed] [Google Scholar]
- 37.Khandelwal P, Lane A, Chaturvedi V, Owsley E, Davies SM, Marmer D, et al. Peripheral blood CD38brightCD8+ effector memory T cells predict acute graft‐versus‐host disease. Biol Blood Marrow Transplant. 2015;21:1215–22. [DOI] [PubMed] [Google Scholar]
- 38.Adhikary SR, Geraghty NJ, Cuthbertson P, Sluyter R, Watson D. Altered donor P2X7 activity in human leukocytes correlates with P2RX7 genotype but does not affect the development of graft‐versus‐host disease in humanised mice. Purinergic Signal. 2019;15:177–92. [DOI] [PMC free article] [PubMed] [Google Scholar]
- 39.Tang Q, Vincenti F. Transplant trials with Tregs: perils and promises. J Clin Invest. 2017;127:2505–12. [DOI] [PMC free article] [PubMed] [Google Scholar]
- 40.Wan YY, Flavell RA. Regulatory T‐cell functions are subverted and converted owing to attenuated Foxp3 expression. Nature. 2007;445:766–70. [DOI] [PubMed] [Google Scholar]
- 41.Zhao K, Ruan S, Yin L, Zhao D, Chen C, Pan B, et al. Dynamic regulation of effector IFN‐gamma‐producing and IL‐17‐producing T cell subsets in the development of acute graft‐versus‐host disease. Mol Med Report. 2016;13:1395–403. [DOI] [PubMed] [Google Scholar]
- 42.Yi T, Chen Y, Wang L, Du G, Huang D, Zhao D, et al. Reciprocal differentiation and tissue‐specific pathogenesis of Th1, Th2, and Th17 cells in graft‐versus‐host disease. Blood. 2009;114:3101–12. [DOI] [PMC free article] [PubMed] [Google Scholar]
- 43.Naito T, Tanaka H, Naoe Y, Taniuchi I. Transcriptional control of T‐cell development. Int Immunol. 2011;23:661–8. [DOI] [PubMed] [Google Scholar]
- 44.Eto M, Mayumi H, Tomita Y, Yoshikai Y, Nishimura Y, Nomoto K. Sequential mechanisms of cyclophosphamide‐induced skin allograft tolerance including the intrathymic clonal deletion followed by late breakdown of the clonal deletion. J Immunol. 1990;145:1303–10. [PubMed] [Google Scholar]
- 45.Wachsmuth LP, Patterson MT, Eckhaus MA, Venzon DJ, Kanakry CG. Optimized timing of post‐transplantation cyclophosphamide in MHC‐haploidentical murine hematopoietic cell transplantation. Biol Blood Marrow Transplant. 2020;26:230–41. [DOI] [PMC free article] [PubMed] [Google Scholar]
- 46.McDonald GB, Slattery JT, Bouvier ME, Ren S, Batchelder AL, Kalhorn TF, et al. Cyclophosphamide metabolism, liver toxicity, and mortality following hematopoietic stem cell transplantation. Blood. 2003;101:2043–8. [DOI] [PubMed] [Google Scholar]
- 47.Sato T, Thorlacius H, Johnston B, Staton TL, Xiang W, Littman DR, et al. Role for CXCR6 in recruitment of activated CD8+ lymphocytes to inflamed liver. J Immunol. 2005;174:277. [DOI] [PubMed] [Google Scholar]
- 48.Khandelwal P, Chaturvedi V, Owsley E, Lane A, Heyenbruch D, Lutzko CM, et al. CD38brightCD8+ T cells associated with the development of acute GVHD are activated, proliferating, and cytotoxic trafficking cells. Biol Blood Marrow Transplant. 2020;26:1–6. [DOI] [PubMed] [Google Scholar]
- 49.Geraghty NJ, Belfiore L, Adhikary SR, Alexander SI, Sluyter R, Watson D. Increased splenic human CD4+:CD8+ T cell ratios, serum human interferon‐gamma and intestinal human interleukin‐17 are associated with clinical graft‐versus‐host disease in humanized mice. Transpl Immunol. 2019;54:38–46. [DOI] [PubMed] [Google Scholar]
- 50.Bruck F, Belle L, Lechanteur C, de Leval L, Hannon M, Dubois S, et al. Impact of bone marrow‐derived mesenchymal stromal cells on experimental xenogeneic graft‐versus‐host disease. Cytotherapy. 2013;15:267–79. [DOI] [PubMed] [Google Scholar]
- 51.Achita P, Dervovic D, Ly D, Lee JB, Haug T, Joe B, et al. Infusion of ex‐vivo expanded human TCR‐alphabeta(+) double‐negative regulatory T cells delays onset of xenogeneic graft‐versus‐host disease. Clin Exp Immunol. 2018;193:386–99. [DOI] [PMC free article] [PubMed] [Google Scholar]
- 52.Sluyter R, Watson D. Use of humanized mouse models to investigate the roles of purinergic signaling in inflammation and immunity. Front Pharmacol. 2020;11:596357. [DOI] [PMC free article] [PubMed] [Google Scholar]
- 53.Betts BC, Pidala J, Kim J, Mishra A, Nishihori T, Perez L, et al. IL‐2 promotes early Treg reconstitution after allogeneic hematopoietic cell transplantation. Haematologica. 2017;102:948–57. [DOI] [PMC free article] [PubMed] [Google Scholar]
- 54.Ikegawa S, Meguri Y, Kondo T, Sugiura H, Sando Y, Nakamura M, et al. PTCy ameliorates GVHD by restoring regulatory and effector T‐cell homeostasis in recipients with PD‐1 blockade. Blood Advan. 2019;3:4081–94. [DOI] [PMC free article] [PubMed] [Google Scholar]
- 55.Geraghty NJ, Watson D, Sluyter R. Long‐term treatment with the P2X7 receptor antagonist Brilliant Blue G reduces liver inflammation in a humanized mouse model of graft‐versus‐host disease. Cell Immunol. 2019;336:12–9. [DOI] [PubMed] [Google Scholar]
- 56.Geraghty NJ, Adhikary SR, Watson D, Sluyter R. The A2A receptor agonist CGS 21680 has beneficial and adverse effects on disease development in a humanised mouse model of graft‐versus‐host disease. Int Immunopharmacol. 2019;72:479–86. [DOI] [PubMed] [Google Scholar]
- 57.Geraghty NJ, Watson D, Sluyter R. Pharmacological blockade of the CD39/CD73 pathway but not adenosine receptors augments disease in a humanized mouse model of graft‐versus‐host disease. Immunol Cell Biol. 2019;97:597–610. [DOI] [PubMed] [Google Scholar]
- 58.Geraghty NJ, Belfiore L, Ly D, Adhikary SR, Fuller SJ, Varikatt W, et al. The P2X7 receptor antagonist Brilliant Blue G reduces serum human interferon‐γ in a humanized mouse model of graft‐versus‐host disease. Clin Exp Immunol. 2017;190:79–95. [DOI] [PMC free article] [PubMed] [Google Scholar]
- 59.Nunes NS, Kanakry CG. Mechanisms of Graft‐versus‐Host Disease prevention by post‐transplantation cyclophosphamide: an evolving understanding. Front Immunol. 2019;10:2668–79. [DOI] [PMC free article] [PubMed] [Google Scholar]
- 60.Iclozan C, Yu Y, Liu C, Liang Y, Yi T, Anasetti C, et al. T helper17 cells are sufficient but not necessary to induce acute graft‐versus‐host disease. Biol Blood Marrow Transplant. 2010;16:170–8. [DOI] [PMC free article] [PubMed] [Google Scholar]
- 61.Lu Y, Giver CR, Sharma A, Li JM, Darlak KA, Owens LM, et al. IFN‐γ and indoleamine 2,3‐dioxygenase signaling between donor dendritic cells and T cells regulates graft versus host and graft versus leukemia activity. Blood. 2012;119:1075–85. [DOI] [PMC free article] [PubMed] [Google Scholar]
- 62.Kennedy‐Nasser AA, Ku S, Castillo‐Caro P, Hazrat Y, Wu MF, Liu H, et al. Ultra low‐dose IL‐2 for GVHD prophylaxis after allogeneic hematopoietic stem cell transplantation mediates expansion of regulatory T cells without diminishing antiviral and antileukemic activity. Clin Cancer Res. 2014;20:2215–25. [DOI] [PMC free article] [PubMed] [Google Scholar]
- 63.Battaglia M, Stabilini A, Roncarolo M‐G. Rapamycin selectively expands CD4+CD25+FoxP3+ regulatory T cells. Blood. 2005;105:4743–8. [DOI] [PubMed] [Google Scholar]
- 64.Hu M, Hawthorne WJ, Nicholson L, Burns H, Qian YW, Liuwantara D, et al. Low dose IL‐2 combined with Rapamycin led to an expansion of CD4+CD25+FOXP3+ Tregs and prolonged human Islet‐allograft survival in humanized mice. Diabetes. 2020;69:1735–48. [DOI] [PubMed] [Google Scholar]
Associated Data
This section collects any data citations, data availability statements, or supplementary materials included in this article.
Supplementary Materials
Figure S1
Figure S2
Figure S3