

Abstract
COVID-19 remains an ongoing issue across the globe, highlighting the need for a rapid, selective, and accurate sensor for SARS-CoV-2 and its emerging variants. The chemical specificity and signal amplification of surface enhanced Raman spectroscopy (SERS) could be advantageous for developing a quantitative assay for SARS-CoV-2 with improved speed and accuracy over current testing methods. Here we have tackled the challenges associated with SERS detection of viruses. As viruses are large, multicomponent species, they can yield different SERS signals but also other abundant biomolecules present in the sample can generate undesired signals. To improve selectivity in complex biological environments, we have employed peptides as capture probes for viral proteins and developed an angiotensin-converting enzyme 2 (ACE2) mimetic peptide-based SERS sensor for SARS-CoV-2. The unique vibrational signature of the spike protein bound to the peptide-modified surface is identified and used to construct a multivariate calibration model for quantification. The sensor demonstrates a 300 nM limit of detection and high selectivity in the presence of excess bovine serum albumin (BSA). This work provides the basis for designing a SERS-based assay for the detection of SARS-CoV-2, as well as engineering SERS biosensors for other viruses in the future.
Keywords: SERS, biosensor, COVID-19, SARS-CoV-2, peptide, virus, biomimetic
Graphical Abstract
The swift and accurate diagnosis of COVID-19 remains a critical factor in preventing the spread of the disease, which to date has surpassed 176 million cases worldwide.1 Current detection methods include polymerase chain reaction (PCR), which requires long run times and significant sample preparation, and antibody testing, which suffers from high false negative rates and detects an immune response from the virus, rather than the virus itself.2 In addition, diagnostic assays that are rapidly adaptable to virus mutations and variants are needed, as the rapid proliferation of the virus can alter the nucleic acid sequence or surface marker of the virus, rendering it undetectable by current methods. There remains a need for a quick, selective, and error-free sensor for SARS-CoV-2.
Surface enhanced Raman spectroscopy (SERS) is a rapid, sensitive vibrational spectroscopy technique that requires minimal sample preparation and gives a highly specific molecular fingerprint.3 Recognized in 1977,4 SERS takes advantage of the properties of noble metal nanostructures, which produce a localized electric field upon laser excitation, giving enhanced Raman signals from analytes on the surface. SERS provides a sensitive response, which allows for quantification, and can yield low limits of detection, even down to the single molecule level.5 The spectrum contains information about the identities of the absorbed species and their orientations on the nanostructure surface, providing chemically specific signals to identify analytes. SERS has emerged as a popular analytical method for sensing biomolecules, including proteins and viruses.6 This technique could be used to develop a quantitative assay for SARS-CoV-2 that would provide immediate and accurate COVID test results for patients around the world.
Engineering an effective SERS sensor requires tailoring surface chemistry to enhance the SERS response and ensure a reproducible, quantitative diagnostic. While SERS can detect trace amounts of target molecules, other components present in biological assays can generate interference and complicate detection.7 Proper modification of the nanostructured surface with a capture agent can increase affinity for a specific analyte in complex environments.8,9 Antibodies are a common recognition element for sensing virus particles with SERS,10 but they are large and bulky, producing complex SERS spectra with a great deal of signal resulting from the antibody itself, and also suffering from the same complications as existing immunosensing strategies.7 Instead, smaller motifs such as DNA aptamers or peptides can be utilized as capture probes to target viruses.11–13 These small capture agents are advantageous due to their facile synthesis and better stability compared to antibodies. Given the near-field enhancement of SERS signal, small capture molecules attached to the nanostructures can concentrate the analyte at the surface where the electric field enhancement is greatest, and thus, improve limits of detection. Additionally, the SERS signal depends on the orientation of the analyte on the substrate. Capture molecules can uniformly orient the analyte on the surface, improving signal reproducibility, increasing selectivity, and enabling quantitative models.14 Recently, this approach has successfully detected the influenza virus and HIV-1 DNA by SERS.12,13
Generating a reproducible response from a specific analyte enables machine learning algorithms to analyze the observed signal.15–18 As opposed to performing univariate analysis on a peak characteristic of the analyte, limits of detection and selectivity can be improved by utilizing multivariate analysis techniques, such as multivariate curve resolution (MCR), to create a calibration model based on the entire spectral signature.19 Using a simple capture agent reproducibly orients the desired analyte on the surface,14 giving rise to a conserved SERS signal that can be extracted from complex mixtures. With appropriate preprocessing, such as normalizing the SERS intensity to an internal standard, quantitative calibration models can be obtained.20–22 Building models based on a target spectrum can significantly enhance selectivity in the presence of similar, potentially interfering molecules.23,24
Here we present a peptide-based SERS sensor for SARS-CoV-2 that may provide faster, more accurate detection and aid in stopping the spread of COVID-19. SARS-CoV-2 binds to the ACE2 receptor through its spike surface proteins.25 The receptor binding domain of the spike protein and its interaction with ACE2 have been thoroughly characterized through cryo-electron microscopy and molecular dynamics simulations.26,27 We have synthesized a peptide sequence derived from the domain of ACE2 that binds the receptor binding domain (RBD)28 to selectively capture the SARS-CoV-2 spike protein on a SERS active substrate. We demonstrate that SERS can be used to detect the binding of the spike protein to this peptide. We use the resulting SERS signal from the peptide-modified substrate to identify the vibrational signature of the spike protein. This sensor enhances the selectivity and enables detection of the spike protein in heterogeneous samples. In addition, we were able to quantify the spike protein through the use of multivariate analysis, yielding limits of detection in the nanomolar range. This sensor offers a new approach that may be effective for rapid detection of SARS-CoV-2 and other future pathogens.
EXPERIMENTAL METHODS
Chemicals and Materials.
All purchased chemicals were used without further purification. Rink amide MBHA resin was purchased from Chem-Impex. Fmoc-(PEG)4-OH was purchased from PurePEG. Alginate, Fmoc-protected amino acids, Biotin, HBTU, PyBOP, Oxyma pure, DIC, TFA, TIPS, BSA, NaBH4, and 2-mercaptoethanol were purchased from Sigma-Aldrich. TCEP HCl, DMSO, and 1X PBS were purchased from Thermo Fisher. Baculovirus insect derived SARS-CoV-2 Spike RBD-His (Cat#: 40592-V08B), SARS-CoV-2 Spike S1+S2-His (Cat#: 40589-V08B1), SARS-CoV Spike RBD-His (Cat#: 40150-V08B2), and MERS-CoV Spike RBD-His (Cat#: 40071-V08B1) were purchased from SinoBiological.
Peptide Synthesis and Purification.
All peptides were synthesized using an automated standard fluoren-9-ylmethoxycarbonyl (Fmoc) solid-phase peptide synthesis method (Liberty Blue, CEM) on rink amide MBHA resin (100–200 mesh, 0.77 mmol/g). Peptides were cleaved from the resin using a solution of 95% trifluoroacetic acid (TFA), 2.5% triisopropylsilane (TIPS), and 2.5% dH2O. The acid was evaporated, and the crude peptide was purified using reverse-phase HPLC (Shimadzu UFLC, Ultra C18 5 μM, 100 × 10 mm column) with a gradient of 0.1% TFA in water (Solvent A) and acetonitrile (Solvent B) over 50 minutes. Purified peptides were lyophilized and stored at −20 °C. Purity was confirmed by electrospray ionization mass spectrometry and HPLC.
X-Ray Photoelectron Spectroscopy (XPS).
Gold-coated Silmeco SERS substrates were pre-cleaned by heating to 175 °C for 10 min under a stream of nitrogen gas. A 1 mM solution of cysteine-modified peptide (20% DMSO, 2 mM TCEP, in water) was reduced for one hour. The substrates were submerged in the reduced peptide solution overnight to functionalize the gold surface. Substrates were then washed with 1 mL sterile water and backfilled by exposure to 100 μM 2-mercaptoethanol for one hour. Substrates were rinsed in sterile water and dried before use. To assess protein binding, modified substrates were incubated for one hour with 1 μM RBD in PBS followed by three washes in water.
XPS spectra were recorded using a Kratos Axis Ultra DLD X-ray Photoelectron Spectrometer with a monochromatic Al K alpha source at 150 W. The spot size area was 300 μm × 700 μm. Survey scans over a binding energy range of 0–1200 eV were taken for each sample with a constant detector pass energy range of 80 eV, followed by a high-resolution XPS measurement (20 eV pass energy) for quantitative determination of binding energy and atomic concentration. Background subtraction, peak integration, and fitting were carried out using Kratos software. To convert peak areas to surface concentration, default instrument sensitivity factors were used (N=0.477, C=0.278, O=0.780, S=0.668, Si=0.328, Au=6.250).
Confocal Laser Scanning Microscopy (CLSM).
Surfaces were modified with peptide and RBD as described above and were then fixed with 2% paraformaldehyde, 2.5% glutaraldehyde in PBS for 20 minutes. The fixed substrates were blocked with 2% BSA for 30 min, washed with PBS and incubated with primary CR3022 antibody (recombinant anti SARS-CoV-2 spike chimeric rabbit monoclonal antibody, 10 μg/mL) at room temperature for one hour. The substrates were washed with PBS and incubated for another hour with goat anti-rabbit IgG-Alexa488 (4 μg/mL). The immunolabeled substrates were washed with sterile water before being mounted on a glass coverslip for imaging. Images were taken on a Zeiss 710 Laser Scanning Confocal Microscope.
Scanning Electron Microscopy (SEM).
For SEM, substrates were cleaned or modified with peptide as described above and were then dried under a stream of nitrogen gas. For immunolabeled SEM surfaces, substrates modified with SBP-PEG4 were incubated for one hour with 1 μM RBD in PBS and washed three times. The surface was blocked with 2% BSA for 30 min, followed by incubation with primary CR3022 anti-RBD antibody (recombinant anti SARS-CoV-2 spike chimeric rabbit monoclonal antibody, 10 μg/mL) for one hour at room temperature. Unbound primary antibody was washed away, and the surface was incubated with goat anti-rabbit IgG conjugated to 20 nm AuNPs for one hour. The AuNP labeled substrate was washed three times with sterile water before imaging. Substrates were mounted on SEM stubs using double-sided copper tape. Images were collected using a FEI Helios 600 Nanolab Dual Beam System operating at 5.00 kV accelerating voltage.
Bio-Layer Interferometry (BLI).
Dissociation constants (Kd) of peptides were measured by bio-layer interferometry (BLI; ForteBio Octet Red 384). Streptavidin BLI tips were functionalized with 2.5 μM of Biotin-SBP and Biotin-SBP-PEG4 in 1X kinetic buffer (1X PBS with 0.1% BSA and 0.05% Tween 20). Peptide modified tips were incubated with various concentrations of SARS-CoV-2 RBD from 0 to 5 μM for 400 sec. Then, dissociation was measured for 600 sec. Corresponding binding affinities of peptides were analyzed with steady-state analysis using the HT analysis software. The 95% confidence intervals for dissociation constants (Kd) for SBP and SBP-PEG4 were 4.4 ± 0.5 μM, and 2.9 ± 1.4 μM, respectively. Specificity measurements were carried out using the method described above with the SPB-PEG4 peptide. Each RBD (SARS-CoV-2, SARS-CoV-1, and MERS) was tested at 2 μM.
Circular Dichroism (CD).
Circular dichroism (CD) spectra were obtained on a Chirascan Plus Spectropolarimeter using a 1 mm path length cuvette. Cysteine-modified peptides were solubilized in PBS at 100 μM. Spectra were recorded from 200 nm to 300 nm.
Surface Enhanced Raman Spectroscopy (SERS).
SERS spectra were obtained using a Renishaw inVia Qontor confocal Raman microscope equipped with a CCD camera. A continuous wave laser at 785 nm, a 1200 grooves/mm grating, a 50x objective with NA = 0.50, and 1 s acquisition times were used for all measurements.
SERS substrates are advantageous for quantification because they can be designed to have homogenous properties, yielding more reproducible signal enhancement than nanoparticles.29 For SERS measurements, commercial gold Silmeco substrates were first cleaned by gently heating to 175°C on a hot plate for 10 minutes. The cleanliness of the substrates was then assessed before use by screening their initial SERS signal for unexpected peaks from contaminants. If necessary, they were cleaned through immersion in a series of solvents, including 1 mM NaBH4 for three minutes and DMSO or ethanol for 10 minutes. After cleaning, substrates were either used without modification, or they were functionalized with the cysteine-modified peptides described above. For peptide-functionalization, a 1 mM solution of peptide was prepared (20% DMSO, 2 mM TCEP in ultrapure water) and allowed to reduce for 30 minutes. Peptide solution was added to substrates and left overnight for functionalization. Substrates were rinsed with water, backfilled with 100 μM 2-mercaptoethanol for 30 minutes, and rinsed with water again before use.
SARS-CoV-2 spike protein, SARS-CoV-2 RBD, SARS-CoV-1 RBD, and MERS-CoV RBD lyophilized powders were reconstituted with water to 0.25 mg/mL in a buffer, and all solutions were kept frozen or on ice once thawed prior to use. Solutions of 0.1% BSA were prepared in 1X PBS. Spike/BSA mixtures were prepared by combining 0.1% BSA in 1X PBS with stock spike protein in equal parts. For all SERS experiments, 10 μL of protein solution was dropped onto the surface. For experiments on unmodified gold substrates, protein solution was added to the surfaces, and spectra were collected immediately. A power of 2 mW was used to acquire 20 μm × 20 μm spectral maps with a 1 μm step size in the xy-plane. Considering the significant heating of the local environment during SERS measurements, photothermal damage to the surface and the sample can be avoided by utilizing near-infrared wavelengths and low powers, along with imaging the surface while wet.30,31 Laser powers were optimized to avoid potential photodamage to the surfaces.31 All SERS measurements were taken on wet substrates. For peptide-functionalized substrates, protein solution was added and allowed to bind for 30 minutes before rinsing with water to remove any unbound protein, and SERS measurements were obtained at a power of 570 μW with a 10 μm × 10 μm map size.
SERS Data Processing and Analysis.
Cosmic rays were removed from SERS maps in Windows-based Raman Environment (WiRE) software (version 5.2.10411) from Renishaw. Spectral analysis was performed in MATLAB (R2019b, The Mathworks Inc.). Multivariate curve resolution (MCR) was performed using the PLS Toolbox version 8.7.1 (Eigenvector Research Inc.).
RESULTS AND DISCUSSION
Surface Modification and Characterization.
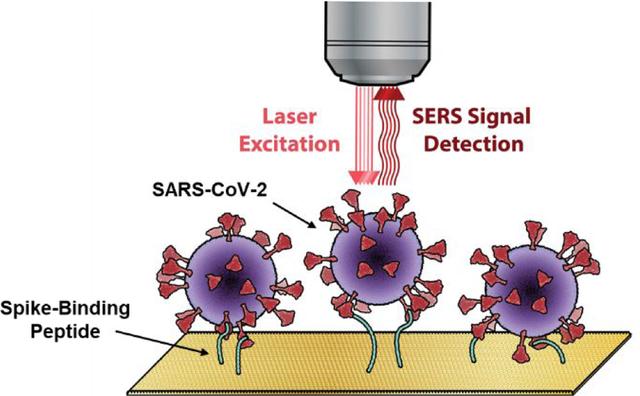
To design a SERS sensor to detect SARS-CoV-2, we modified SERS substrates with a peptide motif derived from the cell surface receptor, ACE2, which binds the RBD of the SARS-CoV-2 spike protein.25,28 Displaying the spike-binding peptide (SBP) on SERS substrates, will enable the selective capture of SARS-CoV-2 from complex media and its detection using SERS (Fig. 1A). By synthesizing the SBP with a cysteine residue at its N-terminus, (Fig. S1), a strong gold-thiol bond attached this sequence to the gold SERS substrates.
Figure 1. Characterization of peptide-modified sensor for detection of SARS-CoV-2.

A) Schematic of peptide-modified SERS substrates before (i) and after (ii) binding the spike protein of SARS-CoV-2. B) Sequence and chemical structure of ACE2 derived peptide used to modify surfaces and bind the spike protein. C) Normalized XPS spectra of SERS substrates showing peptide modification and RBD binding. D) Atomic composition of surfaces used in (c) showing successful modification and RBD binding. E) (i) CLSM 3D reconstructed side-view images of immunolabeled SERS surfaces modified with SBP-PEG4 before and after RBD binding (scale bar = 2 μm). (ii) Relative fluorescence from quantification of integrated density before and after RBD binding (n=4, area per n = 156 μm2).
It is ideal to achieve monolayer coverage of the capture molecule in a consistent orientation on the surface. With cysteine-terminated probes, reduction of disulfide bonds before surface modification ensures that the sulfur groups are free to bind to the substrate. Additionally, backfilling with a short-chain thiol can fill the empty spots between probe molecules, encouraging the probe to orient uniformly and in an upright position.32 This process can also displace any non-specifically adsorbed molecules, including contaminants that might remain after cleaning.
Binding of biomolecules to a surface is highly influenced by the chemical properties of the surface,33 suggesting that the distance between surface and the capture peptide recognition sequence could affect its binding affinity to the target molecule. We therefore also examined a second peptide, SBP-PEG4 (Fig. S2), with a PEG4 spacer between the N-terminal cysteine residue and the spike-binding motif (Fig. 1B).XPS measurements show successful modification of the substrates with the peptides and RBD binding to the SBP-PEG4 surface. From the XPS spectra (Fig. 1C) of unmodified versus modified substrates, peaks appear at 288, 399, and 531eV indicating amide bonds, primary amines, and C=O bonds, respectively. Interestingly, the more predominant amide peak and increased nitrogen to gold ratio for the SBP-PEG4 modified substrate compared to the SBP modified substrate indicate that the linker may facilitate better attachment to the surface (N:Au ratios are 0.85 and 0.99 for SBP and SBP-PEG4 respectively). Upon RBD binding to the SBP-PEG4 substrate, the XPS spectra maintains a strong amide peak while the N:Au ratio increases from 0.99 to 1.45, indicating protein is binding to the SBP-PEG4 modified substrate. RBD binding to the SBP modified substrate was also measured using XPS (Fig. S3) with the N:Au ratio increasing from 0.85 to 1.31. Overall, quantification of the atomic composition from the XPS (Fig. 1D) supports successful modification and RBD binding as indicated by the increasing N:Au ratio after both steps.
To further confirm RBD binding, SBP-PEG4 modified substrates with and without RBD were immunolabeled with anti-RBD fluorescent antibodies and imaged using a confocal laser scanning microscope (CLSM) to create a 3D reconstruction of the surface (Fig. S4). Side-view images of the substrates (Fig. 1E (i)) show minimal background signal for SBP-PEG4 substrates, but after incubation with RBD, increased emission is observed, indicating successful RBD binding. Quantification of the relative fluorescence shows a significant increase after RBD binding (Fig. 1E (ii)). SEM images of the substrates (Fig. S5) show clustering of pillars after peptide modification, consistent with the known behavior of the SERS substrate.34 RBD binding is visualized by immunolabeling with gold-nanoparticles conjugated antibodies (Fig. S6).
Enhancing Binding Affinity of the Capture Peptide.
We reasoned that introducing a spacer to the peptide between the surface-binding functional group and the analyte binding domain will enable better folding of the peptide-RBD complex and will therefore improve its binding affinity for the RBD. Indeed, biolayer interferometry (BLI) measurements of biotinylated versions of SBP (Fig. S7) and SBP-PEG4 (Fig. S8) attached to streptavidin coated BLI tips show a higher response to increasing spike-RBD concentration from SBP-PEG4 compared to the SBP sequence (Fig. S9). Steady-state analysis of the BLI response indicates the PEG4 spacer enhances the Kd of the peptide from 4.4 μM to 2.9 μM (Fig. 2A), indicating the importance of a spacer between the surface and the spike-binding motif to allow for effective binding of the viral spike protein.
Figure 2. Linker affects binding affinity of ACE2 derived peptides for RBD.
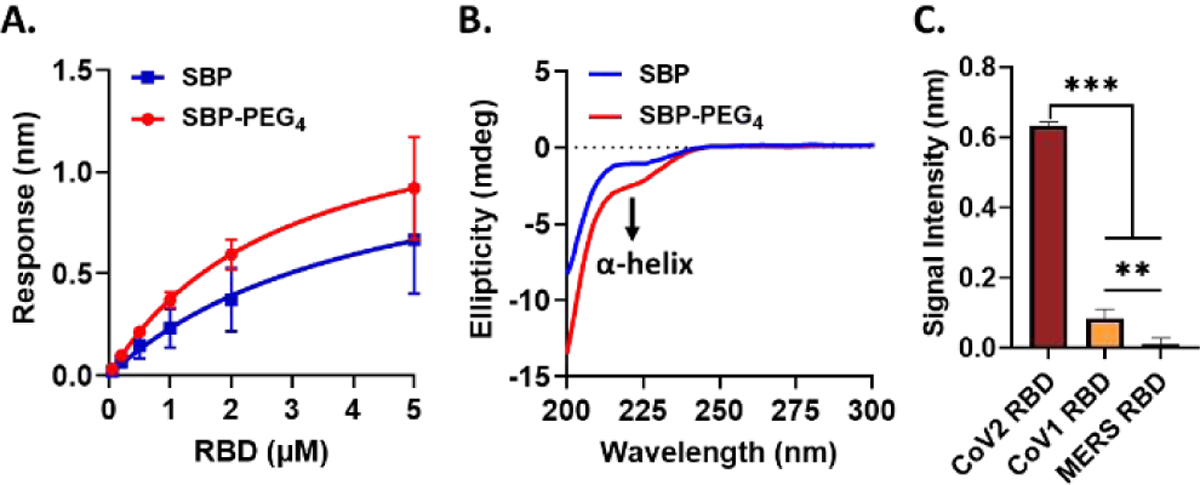
A) Steady-state analysis of BLI data to determine Kd values. B) CD spectra of cysteine-modified peptides with and without linker comparing the ability of each to form alpha-helical structures. C) BLI response of SBP-PEG4 showing specific binding to RBD from SARS-CoV-2 compared to SARS-CoV-1 and MERS.
As the native spike-binding motif adopts a ɑ-helix conformation when in the ACE2 protein, we speculate that the spacer might affect the secondary structure of the peptide.28,35 Circular dichroism (CD) measurements show that both SBP and SBP-PEG4 have a sharp negative peak at 200 nm indicating significant random coil formation (Fig. 2B). Interestingly, SBP-PEG4 shows a stronger shoulder around 222 nm, which indicates that the linker could promote ɑ-helix formation. This difference in helicity correlates with a significantly altered binding affinity, suggesting that secondary structure plays a critical role in binding the spike protein of SARS-CoV-2, and that enhancing the helicity of the peptide could provide even more improved binding affinity. Of note, the SBP-PEG4 peptide shows low affinity for other viruses. BLI was used to compare binding between the RBDs of SARS-CoV-2, SARS-CoV-1, and MERS (Fig. 2C, S10). The peptide shows selectivity for SARS-CoV-2 with significantly higher response compared to SARS-CoV-1, which also binds to the ACE2 receptor. Challenging the peptide with MERS, which does not have an ACE2 binding motif, shows negligible binding. This validates the use of mimetic peptides as capture agents for sensors.
Optimizing SERS Response of Substrates to SARS-CoV-2 Spike Protein.
SERS performance is dependent on successful peptide modification of the substrate, which requires a clean gold surface. Heating the substrates to 170°C helps remove unwanted contaminants before peptide modification, resulting in a reduced SERS background (Fig. S11). X-ray photoelectron spectroscopy (XPS) (Fig. S11) and scanning electron microscopy (SEM) images (Fig. S5) show that heating does not damage the substrates. Optimal surface functionalization conditions include the reduction of disulfide bonds between peptide molecules using TCEP and backfilling the surface with 2-mercaptoethanol to orient the peptide more uniformly32 on the surface and yield cleaner SERS spectra (Fig. S12). The SERS measurements of the SBP and SBP-PEG4 peptide-modified gold SERS substrates confirm successful attachment of the peptides to the surfaces (Figure 3A). The SERS spectra of peptide-modified surfaces exhibit SERS peaks corresponding to the amino acids in the peptides (Fig. 3A). SBP-PEG4 shows bands at 635, 1002, 1032, 1275, and 1420 cm−1, arising from C-S stretching, symmetric ring breathing of phenylalanine, in-plane bending of phenylalanine, phenylalanine/tyrosine CH2 wagging, and CH2 deformation of cysteine, respectively.36–38 Figure 3A further shows the SARS-CoV-2 spike protein elicits significant changes in the observed SERS spectrum. When treated with SARS-CoV-2 spike protein, the SBP-PEG4 surface showed more significant and additional spectral changes compared to the peptide without the spacer (Fig. 3A), in agreement with its higher binding affinity for the RBD (Fig. 2).
Figure 3. SERS detection of SARS-CoV-2 spike protein and RBD on peptide-modified substrates.

A) SERS spectra of unmodified substrate and of both peptide-modified substrates before and after addition of 2 μM spike protein. B) Comparison of SERS signal from the SBP-PEG4-modified surface and in the presence of 2 μM RBD and 2 μM full spike, with highlighted regions indicating important spectral similarities associated with the spike/RBD (maroon shading) and SBP-PEG4 (teal shading). The spectra are offset for clarity.
Addition of the spike protein to the SBP-PEG4 surface, shows peaks assigned to the protein: C-H stretching or N-H deformation at 793 cm−1, phenylalanine out-of-plane bending at 842 cm−1, ɑ-helical skeletal vibration at 946 cm−1, C-N stretching at 1103 cm−1, tyrosine vibration at 1175 cm−1, C-C stretching of tyrosine and phenylalanine at 1223 cm−1, tryptophan rocking at 1267 cm−1, amide III ɑ-helix vibration at 1293 cm−1, tryptophan Cɑ-H deformation at 1339 cm−1, CH3 symmetric stretching at 1369 cm−1, NH3+ deformation of lysine at 1526 cm−1, indole ring of tryptophan at 1559 cm−1, tryptophan aromatic ring stretching at 1580 cm−1, and phenylalanine or tyrosine C-C ring stretching at 1601 cm−1.36,37,39–41 These assignments are consistent with the structure of the spike protein and its RBD.35
The observed SERS features in conjunction with the BLI data indicate SBP-PEG4 is the preferred capture molecule. The SERS signatures of SARS-CoV-2 RBD versus the full spike protein on an SBP-PEG4 surface show a high degree of similarity (Fig. 3B), suggesting that the majority of the signal from the full spike originates from the RBD.42–44 As noted in Figure 3B, addition of either the spike or the RBD triggers the appearance of similar peaks (highlighted in maroon), such as the bands around 1600 cm−1 from tryptophan, along with changes in the relative intensities of bands from the peptide itself (highlighted in teal), supporting a change in orientation associated with protein binding.
The SBP-PEG4 surface demonstrates specificity for SARS-CoV-2 RBD, as opposed to the RBD of two other human coronaviruses, SARS-CoV-1 and MERS-CoV, in agreement with the previously discussed BLI results. In Figure 4, the sensor yields intense SERS signal from 5 μM SARS-CoV-2 RBD but no response from of SARS-CoV-1 RBD and MERS-CoV RBD under the same conditions.
Figure 4. Specificity of SBP-PEG4 SERS sensor for SARS-CoV-2 RBD (blue) versus SARS-CoV-1 RBD (red) and MERS-CoV RBD (orange).

The peptide surfaces (teal) prior to treatment with each RBD (5 μM) are shown below each spectrum, respectively. The spectra are offset for clarity.
Evaluating Selectivity and Quantitative Capabilities of the SERS Sensor.
Figure 5 shows the SERS spectra obtained from SBP-PEG4-functionalized substrates treated with either 2 μM spike protein, 15 μM bovine serum albumin (BSA), or a spike and BSA mixture. BSA was mixed with SARS-CoV-2 spike protein in an 8:1 ratio to mimic the protein-rich environment of saliva and blood. In all of these experiments, the SERS signal was acquired from each SBP-PEG4 modified surface before and after treatment with protein. In Figure 5A, the SERS spectrum in the presence of spike shows distinct differences from the peptide-modified surface, notably the feature around 1600 cm−1 (as indicated by the maroon box in Figure 5A), which is likely associated with tryptophan residues present in the RBD of the spike protein but not present in the SBP-PEG4. These differences are unique to the surfaces containing spike protein and are not observed in the presence of BSA alone. This competition assay assessed the selectivity of the SBP-PEG4-modified surface, demonstrating the advantage of the capture peptide.
Figure 5. Selectivity and quantitative capabilities of SBP-PEG4 SERS sensor.

A) Average spectra from SBP-PEG4-modified substrate treated with: no protein, 15 μM BSA, 2 μM spike, and 8 μM BSA plus 1 μM spike (8:1 mixture). B) MCR component 2, representing SERS signature of spike protein. C) MCR component 1, representing SERS signature of peptide. D) MCR scores on component 2 for SBP-PEG4-modified substrate with: no protein, 15 μM BSA, 2 μM spike, and 8 μM BSA plus 1 μM spike (8:1 mixture). *p =0.05. ****p <0.0001. E) MCR scores on component 1 for SPB-PEG4-modified substrate with: no protein, 8 μM BSA, 2 μM spike, and 8 μM BSA plus 1 μM spike (8:1 mixture). F) Average spectra (normalized to 1002 cm−1) from SBP-PEG4-modified substrate treated with varying concentrations of spike protein. G) SERS-based calibration curve for spike using MCR scores on the spike component, showing a limit of detection of 300 nM. The spectra are offset for clarity.
Multivariate curve resolution (MCR) was used to generate a model capturing the spectral changes observed from the spike protein binding to the SBP-PEG4 modified SERS substrate. The stochastic nature of molecules interacting with hotspots on the surface is known to produce some variance in the SERS spectra. MCR generates a component representative of the average spectrum observed in all the data. The calibration data consisted of SERS maps from an SBP-PEG4 modified SERS substrate challenged with a high concentration of the spike protein, generating a two-component model. The loadings derived from the MCR model are consistent with the spectral changes observed from the spike protein (Fig. 5B) and the SBP-PEG4 modified SERS substrate (Fig. 5C). The strong spectral feature between 1500–1600 cm−1 in the loading for the second component (Fig. 5B) correlates to a similar feature present in the average spectra of the spike-containing samples (Fig. 5A). The emergence of signal in this region appears to be the key indicator of spike binding. Data collected on four different days across four different substrates, which produced a total of five spike maps, five BSA maps, eight mixture maps, and 18 maps with no protein, were analyzed with the resulting model. During the process, a Grubbs’ test removed one out of the 18 total peptide maps as an outlier from the validation set. Figure 5D shows that the addition of both the spike and the spike/BSA mixture causes a statistically significant increase (p<0.0001) in the sample’s score on the spike protein component, compared to the surface with no protein. Meanwhile, Figure 5E shows the scores on the peptide component do not change upon the addition of the protein solutions. The data also exhibits a significant difference (p=0.05) between the BSA-treated and the spike-treated samples on the spike component. The score of BSA on the spike component likely represents the small amount of overlap between an off-target protein SERS signal and the SERS spectra of the spike protein, validating that the peptide provides the sensor with selectivity for the SARS-CoV-2 spike protein. Upon addition of the mixture and subsequent rinsing of the surface, the BSA is likely washed away, while the spike protein remains bound to the peptide on the surface. Additionally, the BSA may promote binding of the spike protein to the peptide, as indicated by the similar spike component scores of the 2 μM spike and the mixture containing only 1 μM spike. BSA is typically used as a blocking agent to prevent non-specific adsorption,45 however since the surface is modified with both a peptide and a backfilling agent, this surface effect is unlikely to affect binding. Instead, the BSA may be acting as a molecular chaperone for the spike protein, preventing aggregation and encouraging proper folding,46 thus ensuring conditions conducive to peptide-spike binding.
It is important to note that this sensor is designed to mimic the ACE2 receptor found in humans and that the model selects for the spike protein of SARS-CoV-2. Because variants of the virus are expected to also infect cells through the ACE2 receptor, this sensor is expected to also bind the variants. For the sensing of variants, the model may need to be retrained, particularly in the case where the RBD in the variant is altered.47–49
Finally, the SBP-PEG4-modified surfaces demonstrate a linear SERS response as a function of SARS-CoV-2 spike protein concentration. SERS maps were acquired from SBP-PEG4 substrates treated with five different concentrations of spike protein. We observed that the heterogeneity of the SERS substrate required analysis of an average response from a 10 μm × 10 μm area for reliable detection. This could also be achieved with a larger illumination area in a practical device. The spectra from five maps from each surface were averaged and normalized to the height of the phenylalanine peak at 1002 cm−1 as an internal standard (Fig. 5F). The average scores for the normalized spectra on the previously discussed MCR model (Fig. 5B and 5D) generated a calibration curve (Fig. 5G) for the SARS-CoV-2 spike protein on the SBP-PEG4-modified surface, giving a limit of detection (LOD) of 300 nM. Here, LOD is calculated as 3Sy/m, where Sy is the standard deviation in y and m is the slope of the calibration curve. The SBP-PEG4 sensor has an LOD about two times lower than that of an unmodified surface (Fig. S13) and demonstrates better selectivity, as shown by the competition assay (Fig. 5).
CONCLUSIONS
The use of a SERS substrate modified with a virus-capture peptide provides selective detection of SARS-CoV-2 proteins in complex media. From starting with a clean surface to implementing an effective target-binding sequence, designing a functional peptide-based SERS sensor requires careful attention to detail and consideration of several factors. Notably, using a linker to offset the protein-binding sequence of the peptide from the surface impacts binding, potentially by altering the conformation of the peptide. The SBP-PEG4 SERS sensor shows improved detection of the SARS-CoV-2 spike protein at lower concentrations compared to the unmodified surface. Consistent with previous findings, the SERS signal of this protein appears to be derived from the RBD. Variants of the SARS-CoV-2 virus are reported to have mutations in the RBD,47–49 but since SBP-PEG4 mimics the natural binding site of the virus, this SERS sensor will likely still bind these variants, and the model could be retrained to detect them without engineering a new sensor. Overall, the improved LOD, along with the selectivity of the sensor, provide the basis for the utilization of a peptide-based SERS assay for detecting SARS-CoV-2, as well as other emerging viruses in the future.
Supplementary Material
ACKNOWLEDGEMENTS
This work was supported by The Ohio State University and the University of North Carolina (UNC) at Chapel Hill. The authors acknowledge financial support from the Research Corporation for Science Advancement. RF also acknowledges support from the North Carolina Policy Collaboratory at the University of North Carolina at Chapel Hill with funding from the North Carolina Coronavirus Relief Fund established and appropriated by the North Carolina General Assembly. ZS acknowledges support by the Ohio State University Comprehensive Cancer Center and the National Institutes of Health under grant number P30 CA016058. Mass Spectrometry was performed at the UNC Mass Spectrometry Core Laboratory at CRITCL (Chemical Research Instrumentation Teaching and Core Labs) in the Department of Chemistry. XPS and SEM was performed at the Chapel Hill Analytical and Nanofabrication Laboratory (CHANL), a member of the North Carolina Research Triangle Nanotechnology Network (RTNN) funded by the National Science Foundation (NSF) (Grant ECCS-2025064) as part of the National Nanotechnology Coordinated Infrastructure (NNCI). CLSM images were taken at UNC Microscopy Services Laboratory (MSL). The Microscopy Services Laboratory, Department of Pathology and Laboratory Medicine, CD and BLI measurements taken at the UNC Macromolecular Interactions Facility are supported in part by P30 CA016086 Cancer Center Core Support Grant to the UNC Lineberger Comprehensive Cancer Center funded by the National Cancer Institute. The content is solely the responsibility of the authors and does not necessarily represent the official views of the National Institutes of Health. We thank Peter Harris for the graphic illustrations incorporated into the manuscript.
Footnotes
Supporting Information
The Supporting Information is available free of charge on the ACS Publications website.
Table S1 and Figures S1–S13 on peptide synthesis, substrate characterization, etc. (PDF)
A provisional patent has been filed related to this work.
REFERENCES
- (1).World Health Organization. Coronavirus Disease (COVID-19) Dashboard. https://covid19.who.int.
- (2).Winter L False Negatives in Quick COVID-19 Test Near 15 Percent: Study. 2020.
- (3).Smith E; D G Modern Raman Spectroscopy- A Practical Approach; John Wiley & Sons, Ltd.: England, 2005. [Google Scholar]
- (4).Jeanmaire DL; Van Duyne RP Surface Raman Spectroelectrochemistry. J. Electroanal. Chem. Interfacial Electrochem 1977, 84 (1), 1–20. 10.1016/s0022-0728(77)80224-6. [DOI] [Google Scholar]
- (5).Langer J; Jimenez de Aberasturi D; Aizpurua J; Alvarez-Puebla RA; Auguié B; Baumberg JJ; Bazan GC; Bell SEJ; Boisen A; Brolo AG; Choo J; Cialla-May D; Deckert V; Fabris L; Faulds K; García de Abajo FJ; Goodacre R; Graham D; Haes AJ; Haynes CL; Huck C; Itoh T; Käll M; Kneipp J; Kotov NA; Kuang H; Le Ru EC; Lee HK; Li J-F; Ling XY; Maier SA; Mayerhöfer T; Moskovits M; Murakoshi K; Nam J-M; Nie S; Ozaki Y; Pastoriza-Santos I; Perez-Juste J; Popp J; Pucci A; Reich S; Ren B; Schatz GC; Shegai T; Schlücker S; Tay L-L; Thomas KG; Tian Z-Q; Van Duyne RP; Vo-Dinh T; Wang Y; Willets KA; Xu C; Xu H; Xu Y; Yamamoto YS; Zhao B; Liz-Marzán LM Present and Future of Surface-Enhanced Raman Scattering. ACS Nano 2019, 14 (1), 28–117. 10.1021/acsnano.9b04224. [DOI] [PMC free article] [PubMed] [Google Scholar]
- (6).Nguyen AH; Peters EA; Schultz ZD Bioanalytical Applications of Surface-Enhanced Raman Spectroscopy: De Novo Molecular Identification. Rev. Anal. Chem 2017, 36 (4). 10.1515/revac-2016-0037. [DOI] [PMC free article] [PubMed] [Google Scholar]
- (7).Tate J; Ward Greg. Interferences in Immunoassay. Clin Biochem Rev 2004, 25 (2), 105–120. [PMC free article] [PubMed] [Google Scholar]
- (8).Feng Wang; Shiyu Cao; Ruxia Yan; Zewei Wang; Dan Wang; Haifeng Yang. Selectivity/Specificity Improvement Strategies in Surface-Enhanced Raman Spectroscopy Analysis. Sensors 2017, 17 (11), 2689. 10.3390/s17112689. [DOI] [PMC free article] [PubMed] [Google Scholar]
- (9).Driskell JD; Uhlenkamp JM; Lipert RJ; Porter MD Surface-Enhanced Raman Scattering Immunoassays Using a Rotated Capture Substrate. Anal. Chem 2007, 79 (11), 4141–4148. 10.1021/ac0701031. [DOI] [PubMed] [Google Scholar]
- (10).Karn-orachai K; Sakamoto K; Laocharoensuk R; Bamrungsap S; Songsivilai S; Dharakul T; Miki K Extrinsic Surface-Enhanced Raman Scattering Detection of Influenza A Virus Enhanced by Two-Dimensional Gold@silver Core–Shell Nanoparticle Arrays. RSC Adv. 2016, 6 (100), 97791–97799. 10.1039/c6ra17143e. [DOI] [Google Scholar]
- (11).Chen H; Park S-G; Choi N; Kwon H-J; Kang T; Lee M-K; Choo J Sensitive Detection of SARS-CoV-2 Using a SERS-Based Aptasensor. ACS Sens. 2021, acssensors.1c00596. 10.1021/acssensors.1c00596. [DOI] [PubMed] [Google Scholar]
- (12).Negri P; Chen G; Kage A; Nitsche A; Naumann D; Xu B; Dluhy RA Direct Optical Detection of Viral Nucleoprotein Binding to an Anti-Influenza Aptamer. Anal. Chem 2012, 84 (13), 5501–5508. 10.1021/ac202427e. [DOI] [PMC free article] [PubMed] [Google Scholar]
- (13).Fu X; Cheng Z; Yu J; Choo P; Chen L; Choo J A SERS-Based Lateral Flow Assay Biosensor for Highly Sensitive Detection of HIV-1 DNA. Biosens. Bioelectron 2016, 78, 530–537. 10.1016/j.bios.2015.11.099. [DOI] [PubMed] [Google Scholar]
- (14).Ma H; Tang X; Liu Y; Han XX; He C; Lu H; Zhao B Surface-Enhanced Raman Scattering for Direct Protein Function Investigation: Controlled Immobilization and Orientation. Anal. Chem 2019, 91 (14), 8767–8771. 10.1021/acs.analchem.9b01956. [DOI] [PubMed] [Google Scholar]
- (15).Lussier F; Thibault V; Charron B; Wallace GQ; Masson J-F Deep Learning and Artificial Intelligence Methods for Raman and Surface-Enhanced Raman Scattering. TrAC Trends Anal. Chem 2020, 124, 115796. 10.1016/j.trac.2019.115796. [DOI] [Google Scholar]
- (16).Lussier F; Missirlis D; Spatz JP; Masson J-F Machine-Learning-Driven Surface-Enhanced Raman Scattering Optophysiology Reveals Multiplexed Metabolite Gradients Near Cells. ACS Nano 2019, acsnano.8b07024. 10.1021/acsnano.8b07024. [DOI] [PubMed] [Google Scholar]
- (17).Thrift W; Bhattacharjee A; Hochbaum AI; Ragan R; Nguyen C; Whiteson K Robust SERS Spectral Analysis for Quantitative Detection of Pyocyanin in Biological Fluids. In Biosensing and Nanomedicine X; Mohseni H, Agahi MH, Razeghi M, Eds.; SPIE: San Diego, United States, 2017; p 4. 10.1117/12.2267958. [DOI] [Google Scholar]
- (18).Thrift WJ; Ragan R Quantification of Analyte Concentration in the Single Molecule Regime Using Convolutional Neural Networks. Anal. Chem 2019, 91 (21), 13337–13342. 10.1021/acs.analchem.9b03599. [DOI] [PubMed] [Google Scholar]
- (19).Goodacre R; Graham D; Faulds K Recent Developments in Quantitative SERS: Moving towards Absolute Quantification. TrAC Trends Anal. Chem 2018, 102, 359–368. 10.1016/j.trac.2018.03.005. [DOI] [Google Scholar]
- (20).Pérez-Jiménez AI; Lyu D; Lu Z; Liu G; Ren B Surface-Enhanced Raman Spectroscopy: Benefits, Trade-Offs and Future Developments. Chem. Sci 2020, 11 (18), 4563–4577. 10.1039/D0SC00809E. [DOI] [PMC free article] [PubMed] [Google Scholar]
- (21).Nguyen A; Schultz ZD Quantitative Online Sheath-Flow Surface Enhanced Raman Spectroscopy Detection for Liquid Chromatography. The Analyst 2016, 141 (12), 3630–3635. 10.1039/C6AN00155F. [DOI] [PubMed] [Google Scholar]
- (22).Bell SEJ; Mackle JN; Sirimuthu NMS Quantitative Surface-Enhanced Raman Spectroscopy of Dipicolinic Acid—towards Rapid Anthrax Endospore Detection. The Analyst 2005, 130 (4), 545–549. 10.1039/B415290E. [DOI] [PubMed] [Google Scholar]
- (23).Villa JEL; Poppi RJ A Portable SERS Method for the Determination of Uric Acid Using a Paper-Based Substrate and Multivariate Curve Resolution. The Analyst 2016, 141 (6), 1966–1972. 10.1039/C5AN02398J. [DOI] [PubMed] [Google Scholar]
- (24).Mamián-López MB; Poppi RJ Standard Addition Method Applied to the Urinary Quantification of Nicotine in the Presence of Cotinine and Anabasine Using Surface Enhanced Raman Spectroscopy and Multivariate Curve Resolution. Anal. Chim. Acta 2013, 760, 53–59. 10.1016/j.aca.2012.11.023. [DOI] [PubMed] [Google Scholar]
- (25).Wrapp D; Wang N; Corbett KS; Goldsmith JA; Hsieh C-L; Abiona O; Graham BS; McLellan JS Cryo-EM Structure of the 2019-NCoV Spike in the Prefusion Conformation. Science 2020, 367 (6483), 1260–1263. 10.1126/science.abb2507. [DOI] [PMC free article] [PubMed] [Google Scholar]
- (26).Yuan M; Wu NC; Zhu X; Lee C-CD; So RTY; Lv H; Mok CKP; Wilson IA A Highly Conserved Cryptic Epitope in the Receptor Binding Domains of SARS-CoV-2 and SARS-CoV. Science 2020, 368 (6491), 630–633. 10.1126/science.abb7269. [DOI] [PMC free article] [PubMed] [Google Scholar]
- (27).Nguyen HL; Lan PD; Thai NQ; Nissley DA; O’Brien EP; Li MS Does SARS-CoV-2 Bind to Human ACE2 More Strongly Than Does SARS-CoV? J. Phys. Chem. B 2020, 124 (34), 7336–7347. 10.1021/acs.jpcb.0c04511. [DOI] [PMC free article] [PubMed] [Google Scholar]
- (28).Zhang G; Pomplun S; Loftis AR; Tan X; Loas A; Pentelute BL Investigation of ACE2 N-Terminal Fragments Binding to SARS-CoV-2 Spike RBD; preprint; Bioengineering, 2020. 10.1101/2020.03.19.999318. [DOI] [Google Scholar]
- (29).Asiala SM; Schultz ZD Characterization of Hotspots in a Highly Enhancing SERS Substrate. The Analyst 2011, 136 (21), 4472. 10.1039/c1an15432j. [DOI] [PMC free article] [PubMed] [Google Scholar]
- (30).Takase M; Nabika H; Hoshina S; Nara M; Komeda K; Shito R; Yasuda S; Murakoshi K Local Thermal Elevation Probing of Metal Nanostructures during Laser Illumination Utilizing Surface-Enhanced Raman Scattering from a Single-Walled Carbon Nanotube. Phys. Chem. Chem. Phys 2013, 15 (12), 4270. 10.1039/c3cp43728k. [DOI] [PubMed] [Google Scholar]
- (31).Zeng Z-C; Wang H; Johns P; Hartland GV; Schultz ZD Photothermal Microscopy of Coupled Nanostructures and the Impact of Nanoscale Heating in Surface-Enhanced Raman Spectroscopy. J. Phys. Chem. C 2017, 121 (21), 11623–11631. 10.1021/acs.jpcc.7b01220. [DOI] [PMC free article] [PubMed] [Google Scholar]
- (32).Oberhaus FV; Frense D; Beckmann D Immobilization Techniques for Aptamers on Gold Electrodes for the Electrochemical Detection of Proteins: A Review. Biosensors 2020, 10 (5), 45. 10.3390/bios10050045. [DOI] [PMC free article] [PubMed] [Google Scholar]
- (33).Gibbs J; Vessels M; Rothenberg M Immobilization Principles – Selecting the Surface for ELISA Assays. Corning Incorporated, Life Sciences 2017. [Google Scholar]
- (34).Schmidt MS; Hübner J; Boisen A Large Area Fabrication of Leaning Silicon Nanopillars for Surface Enhanced Raman Spectroscopy. Adv. Mater 2012, No. 24, OP11–OP18. 10.1002/adma.20110349. [DOI] [PubMed] [Google Scholar]
- (35).Lan J; Ge J; Yu J; Shan S; Zhou H; Fan S; Zhang Q; Shi X; Wang Q; Zhang L; Wang X Structure of the SARS-CoV-2 Spike Receptor-Binding Domain Bound to the ACE2 Receptor. Nature 2020, 581 (7807), 215–220. 10.1038/s41586-020-2180-5. [DOI] [PubMed] [Google Scholar]
- (36).Szekeres GP; Kneipp J SERS Probing of Proteins in Gold Nanoparticle Agglomerates. Front. Chem 2019, 7, 30. 10.3389/fchem.2019.00030. [DOI] [PMC free article] [PubMed] [Google Scholar]
- (37).Freire PTC; Barboza FM; Lima JA; Melo FEA; Filho JM Raman Spectroscopy of Amino Acid Crystals. In Raman Spectroscopy and Applications; Maaz K, Ed.; InTech, 2017. 10.5772/65480. [DOI] [Google Scholar]
- (38).Negri P; Schultz ZD Online SERS Detection of the 20 Proteinogenic L-Amino Acids Separated by Capillary Zone Electrophoresis. The Analyst 2014, 139 (22), 5989–5998. 10.1039/c4an01177e. [DOI] [PMC free article] [PubMed] [Google Scholar]
- (39).Rygula A; Majzner K; Marzec KM; Kaczor A; Pilarczyk M; Baranska M Raman Spectroscopy of Proteins: A Review: Raman Spectroscopy of Proteins. J. Raman Spectrosc 2013, 44 (8), 1061–1076. 10.1002/jrs.4335. [DOI] [Google Scholar]
- (40).Lin VJC; Koenig JL Raman Studies of Bovine Serum Albumin. Biopolymers 1976, 15 (1), 203–218. 10.1002/bip.1976.360150114. [DOI] [PubMed] [Google Scholar]
- (41).Peticolas WL Raman Spectroscopy of DNA and Proteins. In Methods in Enzymology; Elsevier, 1995; Vol. 246, pp 389–416. 10.1016/0076-6879(95)46019-5. [DOI] [PubMed] [Google Scholar]
- (42).Wang H; Carrier SL; Park S; Schultz ZD Selective TERS Detection and Imaging through Controlled Plasmonics. Faraday Discuss. 2015, 178, 221–235. 10.1039/C4FD00190G. [DOI] [PMC free article] [PubMed] [Google Scholar]
- (43).Wang H; Schultz ZD TERS Detection of α V β 3 Integrins in Intact Cell Membranes. ChemPhysChem 2014, 15 (18), 3944–3949. 10.1002/cphc.201402466. [DOI] [PubMed] [Google Scholar]
- (44).Xiao L; Wang H; Schultz ZD Selective Detection of RGD-Integrin Binding in Cancer Cells Using Tip Enhanced Raman Scattering Microscopy. Anal. Chem 2016, 88 (12), 6547–6553. 10.1021/acs.analchem.6b01344. [DOI] [PMC free article] [PubMed] [Google Scholar]
- (45).Lichtenberg JY; Ling Y; Kim S Non-Specific Adsorption Reduction Methods in Biosensing. Sensors 2019, 19 (11), 2488. 10.3390/s19112488. [DOI] [PMC free article] [PubMed] [Google Scholar]
- (46).Finn TE; Nunez AC; Sunde M; Easterbrook-Smith SB Serum Albumin Prevents Protein Aggregation and Amyloid Formation and Retains Chaperone-like Activity in the Presence of Physiological Ligands. J. Biol. Chem 2012, 287 (25), 21530–21540. 10.1074/jbc.M112.372961. [DOI] [PMC free article] [PubMed] [Google Scholar]
- (47).Yuan M; Huang D; Lee C-CD; Wu NC; Jackson AM; Zhu X; Liu H; Peng L; Gils MJ van; Sanders RW; Burton DR; Reincke SM; Prüss H; Kreye J; Nemazee D; Ward AB; Wilson IA Structural and Functional Ramifications of Antigenic Drift in Recent SARS-CoV-2 Variants. Science 2021. 10.1126/science.abh1139. [DOI] [PMC free article] [PubMed] [Google Scholar]
- (48).Zhang J; Cai Y; Xiao T; Lu J; Peng H; Sterling SM; Walsh RM; Rits-Volloch S; Sliz P; Chen B Structural Impact on SARSCoV-2 Spike Protein by D614G Substitution. bioRxiv 2020, 2020.10.13.337980. 10.1101/2020.10.13.337980. [DOI] [PMC free article] [PubMed] [Google Scholar]
- (49).Singh J; Samal J; Kumar V; Sharma J; Agrawal U; Ehtesham NZ; Sundar D; Rahman SA; Hira S; Hasnain SE Structure-Function Analyses of New SARS-CoV-2 Variants B.1.1.7, B.1.351 and B.1.1.28.1: Clinical, Diagnostic, Therapeutic and Public Health Implications. Viruses 2021, 13 (3). 10.3390/v13030439. [DOI] [PMC free article] [PubMed] [Google Scholar]
Associated Data
This section collects any data citations, data availability statements, or supplementary materials included in this article.