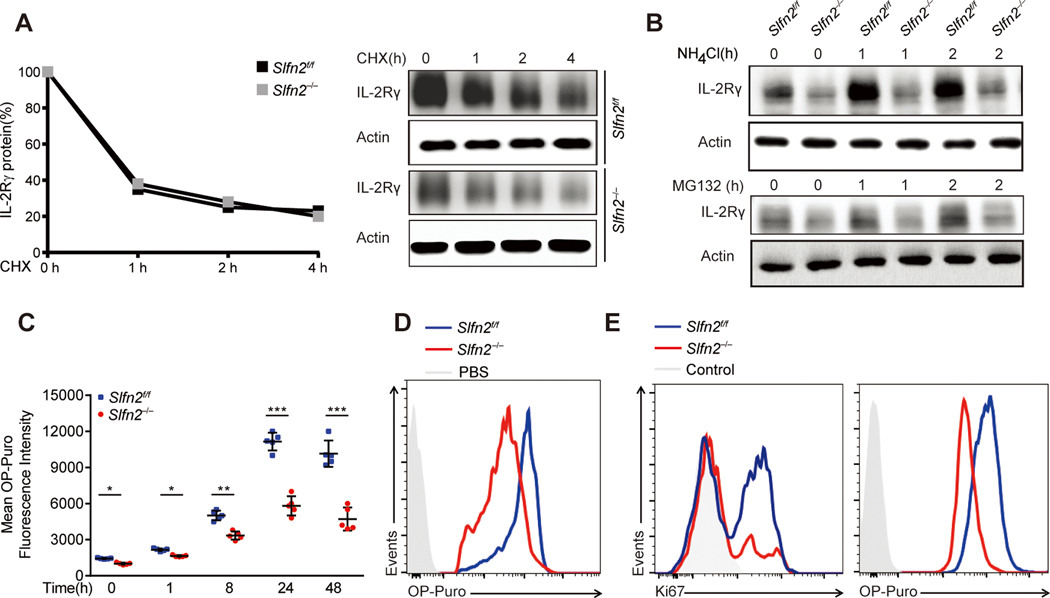
Fig. 3. Attenuated translational burst in activated SLFN2-deficient T cells.
(A) Immunoblot analysis of IL-2Rγ in Slfn2f/f or Slfn2−/− (from CD4-Cre; Slfn2f/f mice) splenic T cells stimulated with anti-CD3/CD28 for 24 hours and then treated with cycloheximide for the indicated time with cells pooled from 4–8 mice per genotype (right). Quantification of the intensity of the IL-2Rγ protein bands normalized to time 0 hour (left). (B) Immunoblot analysis of IL-2Rγ in Slfn2f/f or Slfn2−/− splenic T cells stimulated with anti-CD3/CD28 for 24 hours and then treated with NH4Cl (10 mM) or MG132 (10 μM) for the indicated time, and cells were pooled from 4–8 mice per genotype. (C) OP-puro mean fluorescence intensity in Slfn2f/f or Slfn2−/− splenic T cells (n=5 per genotype) stimulated with anti-CD3/CD28 for the indicated time and then labeled with OP-puro for 30 min. Each symbol represents an individual mouse. (D) Representative flow cytometry analysis of OP-puro fluorescence in Slfn2f/f or Slfn2−/− splenic T cells stimulated with anti-CD3/CD28 for 24 hours, followed by OP-puro or PBS incubation (with Slfn2f/f cells as a control) for 30 min. (E) Representative flow cytometry analysis of intracellular Ki67 levels (left) and OP-puro fluorescence (right) in OT-1 cells from Slfn2f/f or CD4-Cre; Slfn2f/f mice 48 hours after i.m. OVA immunization followed by a 1-hour OP-puro treatment in vivo (n=3 per genotype). Control, antibody isotype (left) or PBS treatment (right) of Slfn2f/f cells. P-values were determined by Student’s t test (*P<0.5, **P<0.01, ***P<0.001). Data are representative of two (B to E) or three (A) independent experiments, and error bars indicate SD.

