. 2021 Jul 14;10:e67436. doi: 10.7554/eLife.67436

Figure 1. Whole-cell sequencing captures the cellular diversity and activation cascade of the adult neurogenic niche.

(A) Schematic of the whole-cell single-cell isolation and sequencing protocol (scRNA-Seq). The lateral wall of the lateral ventricles were microdissected from young adult hGFAP:GFP mouse brains (n=four males, n=four females). Four samples were multiplexed with MULTI-seq barcodes and combined together. Two 10x Chromium Controller lanes were loaded as technical replicates, and cells were sequenced and processed for downstream analysis (Figure 1—figure supplement 1). V-SVZ: Ventricular-Subventricular zone. (B) UMAP plot of scRNA-Seq cell types captured after demultiplexing and doublet removal. (C) Dot plot of cell-type-specific marker expression in the clusters from (B) (Figure 1—figure supplement 2).

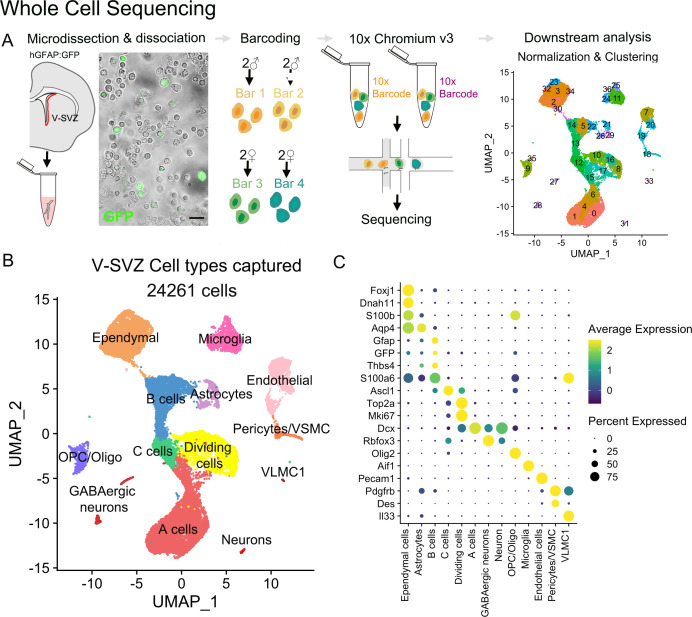
Figure 1.

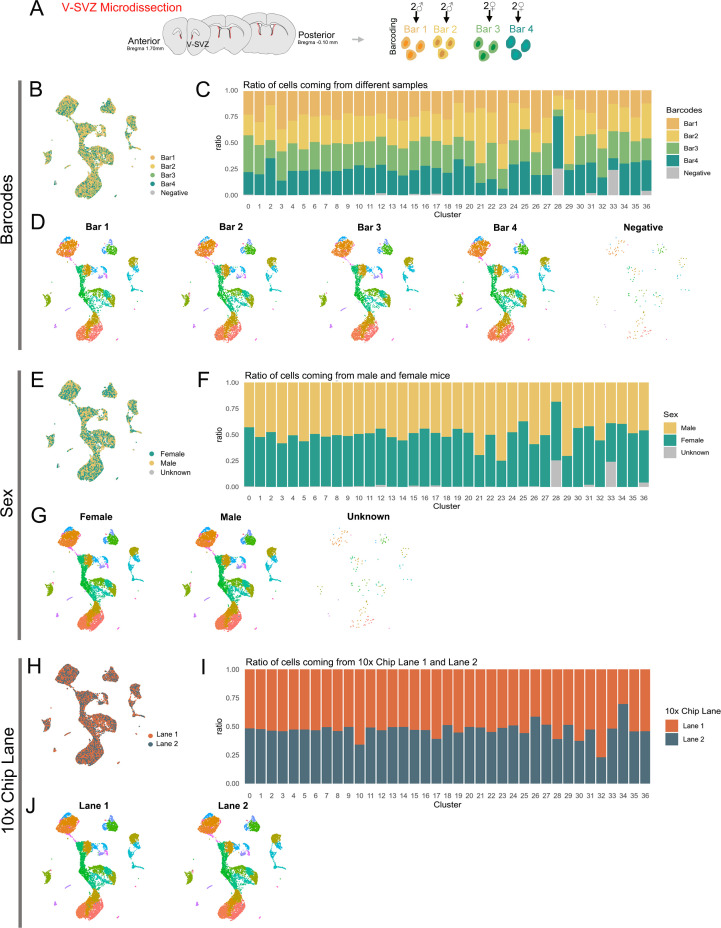
Figure 1—figure supplement 1. Biological and technical replicate metadata of the scRNA-Seq dataset.

Figure 1—figure supplement 1.

(A) Diagram representing V-SVZ microdissected areas (red). The V-SVZ was microdissected from 1 mm brain slices from anterior (bregma 1.70) to Posterior bregma (−0.10 mm) regions. Single-cell suspensions from two female samples and two male samples were multiplexed with MULTI-seq barcodes (Bar1-4). (B) UMAP plot of sequenced cells after demultiplexing and quality control filtering, color-coded by MULTI-seq barcode. Cells with no detectable barcode are labeled ‘Negative’. (C) Ratio of cells within each cluster (see Figure 1A, right panel) coming from each Barcode sample. (D) UMAP plots of cells separated by Barcode number and color-coded by cluster number (see Figure 1A, right panel). (E) UMAP plot of sequenced cells color-coded by animal sex: Female cells (green) correspond to Barcodes 3 and 4 combined, male cells (tan) correspond to Barcodes 1 and 2 combined. Cells with no detectable barcode are labeled ‘Unknown’ (gray). (F) Ratio of cells within each cluster (see Figure 1A, right panel) coming from male (tan) or female (green) mice, or of unknown origin (gray). (G) UMAP plots of cells separated by animal sex and color-coded by cluster number (see Figure 1A, right panel). (H) UMAP plot of sequenced cells color-coded by 10x Chromium Controller Chip lane (equivalent to ‘batch’, or technical replicate): Lane 1 (orange) or Lane 2 (navy). (I) Ratio of cells within each cluster (see Figure 1A, right panel) coming from Lane 1 (orange) or Lane 2 (navy). (J) UMAP plots of cells separated by Lane and color-coded by cluster number (see Figure 1A, right panel).
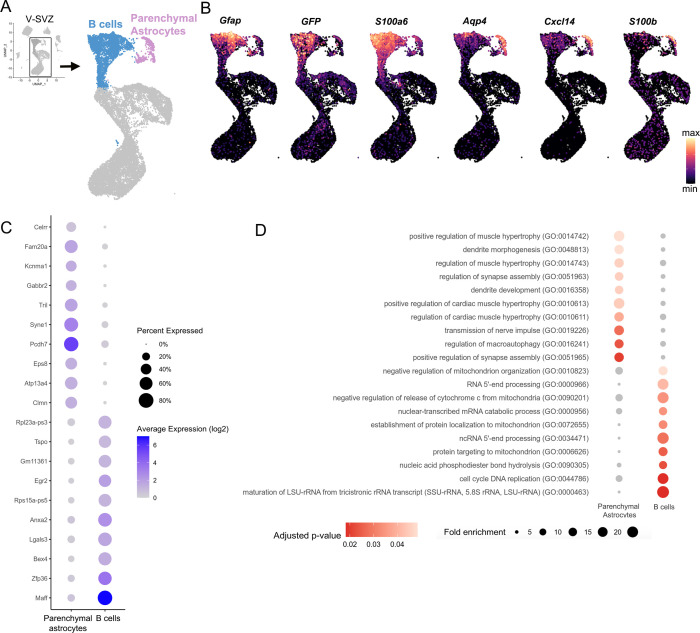
Figure 1—figure supplement 2. Transcriptomic profile of B cells versus Parenchymal Astrocytes.

Figure 1—figure supplement 2.

(A) UMAP plot of V-SVZ neurogenic lineage cells (blue) and parenchymal astrocytes (purple) isolated from the scRNA-Seq dataset (inset, boxed area). (B) Gene expression of B cell-enriched markers Gfap, GFP, S100a6, and parenchymal astrocyte-enriched markers Aqp4, Cxcl14, S100b. (C) Dot plot of the top ten differentially expressed Parenchymal Astrocytes and B cell cluster markers. (D) Dot plot of significantly over-represented Gene Ontology (GO) terms identified by gene set enrichment analysis using differentially expressed Parenchymal astrocytes and B cell genes.