

Abstract
Individuals infected with SARS-CoV-2 who also display hyperglycemia suffer from longer hospital stays, higher risk of developing acute respiratory distress syndrome (ARDS), and increased mortality. Nevertheless, the pathophysiological mechanism of hyperglycemia in COVID-19 remains poorly characterized. Here, we show that hyperglycemia is similarly prevalent among patients with ARDS independent of COVID-19 status. Yet among patients with ARDS and COVID-19, insulin resistance is the prevalent cause of hyperglycemia, independent of glucocorticoid treatment, which is unlike patients with ARDS but without COVID-19, where pancreatic beta cell failure predominates. A screen of glucoregulatory hormones revealed lower levels of adiponectin in patients with COVID-19. Hamsters infected with SARS-CoV-2 demonstrated a strong antiviral gene expression program in the adipose tissue and diminished expression of adiponectin. Moreover, we show that SARS-CoV-2 can infect adipocytes. Together these data suggest that SARS-CoV-2 may trigger adipose tissue dysfunction to drive insulin resistance and adverse outcomes in acute COVID-19.
Keywords: COVID-19, hyperglycemia, insulin, insulin resistance, beta cell failure, diabetes, adipose tissue, adiponectin, SARS-CoV-2, COVID, adipokine
Graphical abstract
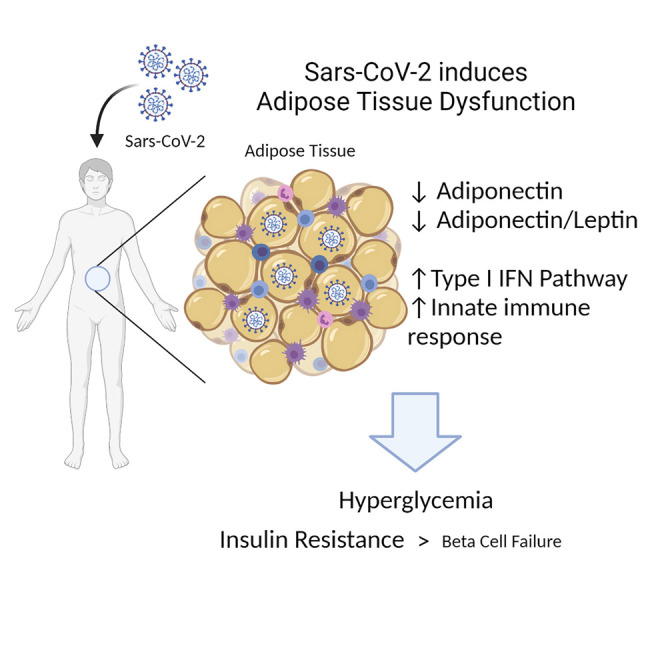
Here, Reiterer et al. report that hyperglycemia in critically ill patients with COVID-19 is caused mainly by insulin resistance and is associated with decreased circulating adiponectin. SARS-CoV-2 is shown to directly infect human adipocytes, trigger an inflammatory antiviral response in the adipose tissue, and cause its dysfunction.
Introduction
The deadly coronavirus disease 2019 (COVID-19) pandemic is underscored by high morbidity and mortality rates seen in certain vulnerable populations, including individuals with diabetes mellitus (DM), obesity, cardiovascular disease, and advanced age, with the latter associated with many chronic cardiometabolic diseases (Drucker, 2021; Holman et al., 2020; McGurnaghan et al., 2021; Yang et al., 2021; Zhou et al., 2020). Hyperglycemia with or without a history of DM is a strong predictor of in-hospital adverse outcomes, portending a 7-fold higher mortality compared with patients with well-controlled blood glucose levels (Zhu et al., 2020). Thus, hyperglycemia may be seen as a biomarker that predicts poor prognosis. A retrospective study that compared patients with hyperglycemia who were treated with insulin against those who were not showed increased mortality in those receiving insulin (Yu et al., 2021). However, it remains unclear whether insulin treatment is a surrogate for severity of hyperglycemia and overall morbidity or whether it is an actual causative factor for death. There is, thus, uncertainty regarding specific treatments for hyperglycemia in acute COVID-19 (Lim et al., 2021).
Despite our early recognition of the association between hyperglycemia and perilous outcomes, the pathophysiological mechanisms that underlie hyperglycemia in COVID-19 remain undefined (Accili, 2021; Lockhart and O’Rahilly, 2020). Hypotheses have included a broad range of pathologies, such as direct infection of islets leading to beta cell failure (BCF) and systemic inflammation leading to insulin resistance (IR). Dexamethasone substantially reduces mortality in patients with severe COVID-19 infection requiring oxygen or invasive mechanical ventilation (Horby et al., 2021). Glucocorticoids can also provoke hyperglycemia by inducing IR and beta cell dysfunction. The widespread usage of dexamethasone in severe SARS-CoV-2 infection is expected to exacerbate both the incidence and severity of hyperglycemia in COVID-19. However, the contribution of glucocorticoids to hyperglycemia in acute COVID-19 has not been defined.
Although COVID-19 is primarily marked by a respiratory tract infection, severe acute respiratory syndrome coronavirus 2 (SARS-CoV-2) is known to infect other cell types and often leads to extrapulmonary consequences (Gupta et al., 2020; Puelles et al., 2020). For example, ACE2 and other entry receptors for SARS-CoV-2 can be expressed on pancreatic islet cells, and endocrine cells differentiated from human pluripotent stem cells are permissive to infection (Tang et al., 2021; Wu et al., 2021; Yang et al., 2020). Early reports of unexpected diabetic ketoacidosis (DKA) in COVID-19 patients fueled concerns for a novel form of acute onset BCF. For example, one case described a patient with new-onset DKA who was found to be autoantibody negative for type 1 DM (T1DM) but showed evidence of prior SARS-CoV-2 infection based on serology results, suggesting the possibility of pancreatic beta cell dysfunction or destruction as a result of COVID-19 (Hollstein et al., 2020). However, given the high rates of COVID-19 during this pandemic coupled with low background rates of new onset T1DM, the connection between these two events in this case could be “true, true, and unrelated.” Recent studies disagree on whether ACE2 is expressed on pancreatic beta cells or whether the SARS-CoV-2 virus is found in pancreatic beta cells of deceased individuals with COVID-19 (Coate et al., 2020; Kusmartseva et al., 2020; Müller et al., 2021; Tang et al., 2021; Wu et al., 2021). Conversely, the well-known connection between obesity and IR might lead to impaired immunity and more severe SARS-CoV-2 infection (Goyal et al., 2020a). In fact, population-level studies have reported a higher risk of complications in patients with obesity and COVID-19 (Barron et al., 2020; Docherty et al., 2020; Williamson et al., 2020). Viral infection may lead to systemic IR and worsened hyperglycemia. In sum, despite much attention, the pathophysiology of hyperglycemia observed in acute COVID-19 remains unknown.
In this study, we assessed the pathophysiological mechanism of hyperglycemia in acute and severe COVID-19 and analyzed protein hormones regulating glucose homeostasis. We compared patients with COVID-19 with critically ill control patient groups (those with acute respiratory distress syndrome [ARDS] and hyperglycemia but without COVID-19) and found striking differences in the characteristics associated with hyperglycemia, further highlighting the metabolic dysfunction seen in this disease.
Results
Hyperglycemia in patients with COVID-19 is associated with adverse outcomes
Our study consisted of patients hospitalized at New York-Presbyterian Hospital/Weill Cornell Medical Center and affiliated campuses at Queens and Lower Manhattan Hospital. We assessed the characteristics of 3,854 inpatients diagnosed with COVID-19 between March 1, 2020, and May 15, 2020, and found a clear association between hyperglycemia (glucose > 170 mg/dL) and adverse outcomes. Overall, 49.7% of all patients with COVID-19 also suffered from hyperglycemia (Table 1 ), rising to 91.1% and 72.8% among intubated and deceased patients, respectively. Hyperglycemia was, thus, associated with an increased risk for intubation by more than 15-fold (OR 15.6, Fisher’s exact test, p < 0.0001) and for death by 3.6-fold (OR 3.6, p < 0.0001) compared to patients without hyperglycemia (Figure 1 A). Similarly, the median length of hospital stay was more than 2-fold longer for patients with hyperglycemia at 10 days compared to 5 days for those without hyperglycemia (Wilcoxon rank-sum test, p < 0.0001) (Table 1).
Table 1.
Characteristics of adult patients with COVID-19, March 1, 2020, to May 15, 2020
| ARDS |
||||
|---|---|---|---|---|
| Characteristic | Overall, n = 3,854a | No, n = 3,031a | Yes, n = 823a | p valueb |
| Age | 65 (52, 77) | 64 (51, 77) | 66 (56, 75) | 0.13 |
| Female | 1,579 (41.0%) | 1,302 (43.0%) | 277 (33.7%) | <0.001 |
| Race | – | – | – | 0.007 |
| White | 1,107 (28.7%) | 881 (29.1%) | 226 (27.5%) | – |
| Black | 461 (12.0%) | 382 (12.6%) | 79 (9.6%) | – |
| Asian | 714 (18.5%) | 533 (17.6%) | 181 (22.0%) | – |
| Unspecified/other | 1,572 (40.8%) | 1,235 (40.7%) | 337 (40.9%) | – |
| Comorbidities | ||||
| Obesity | 1,047 (27.2%) | 781 (25.8%) | 266 (32.3%) | <0.001 |
| COPD | 235 (6.1%) | 175 (5.8%) | 60 (7.3%) | 0.13 |
| Kidney disease | 370 (9.6%) | 297 (9.8%) | 73 (8.9%) | 0.5 |
| CAD | 562 (14.6%) | 422 (13.9%) | 140 (17.0%) | 0.030 |
| Diabetes | 1,214 (31.5%) | 925 (30.5%) | 289 (35.1%) | 0.013 |
| Hypertension | 2,106 (54.6%) | 1,634 (53.9%) | 472 (57.4%) | 0.086 |
| Cirrhosis | 41 (1.1%) | 32 (1.1%) | 9 (1.1%) | >0.9 |
| Malignancy | 170 (4.4%) | 140 (4.6%) | 30 (3.6%) | 0.3 |
| Acute diagnoses | ||||
| Septic shock | 352 (9.1%) | 80 (2.6%) | 272 (33.0%) | <0.001 |
| Acute MI | 112 (2.9%) | 53 (1.7%) | 59 (7.2%) | <0.001 |
| Laboratory values | ||||
| Peak glucose (Mg/dL) | 170 (124, 280) | 149 (118, 230) | 281 (208, 393) | <0.001 |
| LDH (U/L)c | 405 (308, 553) | 382 (290, 502) | 531 (400, 693) | <0.001 |
| Creatinine (Mg/dL)c | 0.96 (0.76, 1.38) | 0.94 (0.75, 1.35) | 1.02 (0.80, 1.48) | <0.001 |
| WBC (U/L)c | 7.3 (5.4, 10.0) | 7.1 (5.3, 9.6) | 8.1 (5.8, 11.6) | <0.001 |
| %HbA1cc | 6.70 (6.00, 8.10) | 6.70 (5.90, 8.30) | 6.60 (6.00, 7.68) | 0.3 |
| Conditions | ||||
| Hyperglycemia (HG) | 1,914 (49.7%) | 1,206 (39.8%) | 708 (86.0%) | <0.001 |
| Leukopenia | 335 (8.7%) | 283 (9.3%) | 52 (6.3%) | 0.008 |
| Leukocytosis | 718 (18.6%) | 487 (16.1%) | 231 (28.1%) | <0.001 |
| Anemia | 839 (21.8%) | 672 (22.2%) | 167 (20.3%) | 0.3 |
| Thrombocytopenia | 383 (9.9%) | 292 (9.6%) | 91 (11.1%) | 0.3 |
| Drug therapy | ||||
| Glucocorticoids | 809 (21.0%) | 371 (12.2%) | 438 (53.2%) | <0.001 |
| Outpatient DM oral agents | 234 (6.1%) | 154 (5.1%) | 80 (9.7%) | <0.001 |
| In-hospital insulin therapy | 1,455 (37.8%) | 865 (28.5%) | 590 (71.7%) | <0.001 |
| Outcomes | ||||
| Admitted | 3,600 (93.4%) | 2,784 (91.9%) | 816 (99.1%) | <0.001 |
| Vasopressor requirement | 713 (18.5%) | 93 (3.1%) | 620 (75.3%) | <0.001 |
| Intubation | 751 (19.5%) | 89 (2.9%) | 662 (80.4%) | <0.001 |
| Intubation and HG | – | – | – | 0.2 |
| Intubation HG− | 67 (8.9%) | 21 (23.6%) | 46 (6.9%) | – |
| Intubation HG+ | 684 (91.1%) | 68 (76.4%) | 616 (93.1%) | – |
| In-hospital mortality | 876 (22.7%) | 430 (14.2%) | 446 (54.2%) | <0.001 |
| Mortality and HG | – | – | – | <0.001 |
| Mortality HG− | 238 (27.2%) | 166 (38.6%) | 72 (16.1%) | – |
| Mortality HG+ | 638 (72.8%) | 264 (61.4%) | 374 (83.9%) | – |
| Hospital stay (days) | 7 (3, 14) | 5 (3, 10) | 20 (8, 41) | <0.001 |
| Hospital stay HG− (days) | 5 (3, 8) | 5 (3, 8) | 7 (4, 11) | <0.001 |
| Hospital stay HG+ (days) | 10 (5, 22) | 7 (4, 12) | 23 (11, 45) | <0.001 |
Median (IQR) or N (%)
Statistical tests performed to assess association between patient characteristic and ARDS: Wilcoxon rank-sum test on continuous variables (age, laboratory values, ICU, and hospital stay); chi-square test of independence on categorical variables (all other characteristics)
Number of patients with missing values: LDH 1,614; creatinine 31; WBC 24; %HbA1c 2,488
Figure 1.

Hyperglycemia in patients with COVID-19 is associated with adverse outcomes
(A) Odds ratios showing the association between hyperglycemia (peak glucose during hospitalization >170 mg/dL) and intubation, mortality, and development of ARDS among patients with COVID-19. Data expressed as OR with 95% CI and p values calculated by Fisher’s exact test.
(B–D) Percentage of individuals with hyperglycemia (HG)/diabetes (DM)/obesity (OB, BMI ≥ 30) among patients with COVID-19 and ARDS (C+A+, n = 845) and ICU controls with (C−A+, n = 1,190) or without ARDS (C−A−, n = 3,558). Data were analyzed by two-sided Fisher’s exact test with Bonferroni-Holm’s correction for multiple comparisons.
(E) Odds ratios showing the association between hyperglycemia and mortality among the three patient cohorts suffering from hyperglycemia. Data expressed as OR with 95% CI and Fisher’s exact test.
(F) Hospital stay for patients in the three cohorts with or without hyperglycemia. Data are expressed as median with IQR and were analyzed using Kruskal-Wallis and pairwise Wilcoxon ranked sum with multiple testing correction (Bonferroni).
(G–J) Example graphs showing the glucose values, insulin, and glucocorticoid treatments of a patient involved in the study. The 3 highest glucose readings for each day are plotted. The black bar indicates the days when glucocorticoids were administered. The graphs illustrate a patient without hyperglycemia (G), a patient who remained persistently hyperglycemic (H), a patient who was initially hyperglycemic but improved over time (I), and a patient who was not hyperglycemic upon admission but developed HG over time, which was further exacerbated by glucocorticoid treatment (J).
Patients severely infected with SARS-CoV-2 are known to develop pneumonia and ARDS and require mechanical ventilation (Magleby et al., 2020). Hyperglycemia increased the risk of developing ARDS by 9.3-fold (OR 9.3, p < 0.0001) for COVID-19 patients and was considerably more prevalent than in patients without ARDS (86.0% compared with 39.8%) (Figure 1A; Table 1). In this study, we aimed to further analyze the impact of hyperglycemia on critically ill patients with COVID-19; we, thus, divided our cohort based on the development of ARDS. We compared the characteristics of these 823 critically ill patients who were ARDS-positive and who had COVID-19 (Table 1) with 4,748 patients with or without ARDS hospitalized in our medical intensive care unit (ICU) between 2013 and 2019 (Table 2 ). Strikingly, a very similar pattern was found among COVID-19-negative control ICU patients: 86% of ARDS-positive controls suffered from hyperglycemia, compared with 63% of ARDS-negative controls (Table 2; Figure 1B). Although the three patient groups differed in the prevalence of obesity and DM, both the overall prevalence and the magnitude of differences were smaller (Figures 1C and 1D).
Table 2.
Characteristics of adult Medical ICU patients over a 5-year period between 2013 and 2019
| ARDS |
||||
|---|---|---|---|---|
| Characteristic | Overall, n = 4,748a | No, n = 3,558a | Yes, n = 1,190a | p valueb |
| Age | 68 (55, 78) | 67 (53, 78) | 71 (59, 79) | <0.001 |
| Female | 2,269 (47.8%) | 1,758 (49.4%) | 511 (42.9%) | <0.001 |
| Race | – | – | – | 0.6 |
| White | 2,175 (45.8%) | 1,637 (46.0%) | 538 (45.2%) | – |
| Black | 544 (11.5%) | 416 (11.7%) | 128 (10.8%) | – |
| Asian | 373 (7.9%) | 272 (7.6%) | 101 (8.5%) | – |
| Unspecified/other | 1,656 (34.9%) | 1,233 (34.7%) | 423 (35.5%) | – |
| Comorbidities | ||||
| Obesity | 1,172 (24.7%) | 845 (23.7%) | 327 (27.5%) | 0.010 |
| COPD | 1,040 (21.9%) | 701 (19.7%) | 339 (28.5%) | <0.001 |
| Kidney disease | 1,079 (22.7%) | 736 (20.7%) | 343 (28.8%) | <0.001 |
| CHF | 1,029 (21.7%) | 684 (19.2%) | 345 (29.0%) | <0.001 |
| Arrhythmia | 2,064 (43.5%) | 1,425 (40.1%) | 639 (53.7%) | <0.001 |
| Diabetes | 1,143 (24.1%) | 874 (24.6%) | 269 (22.6%) | 0.2 |
| Hypertension | 2,273 (47.9%) | 1,667 (46.9%) | 606 (50.9%) | 0.015 |
| Liver disease | 830 (17.5%) | 578 (16.2%) | 252 (21.2%) | <0.001 |
| Malignancy | 846 (17.8%) | 621 (17.5%) | 225 (18.9%) | 0.3 |
| Acute diagnoses | ||||
| Pneumonia | 1,571 (33.1%) | 878 (24.7%) | 693 (58.2%) | <0.001 |
| Sepsis | 2,699 (56.8%) | 1,509 (42.4%) | 1,190 (100.0%) | <0.001 |
| Septic shock | 657 (13.8%) | 229 (6.4%) | 428 (36.0%) | <0.001 |
| Laboratory values | ||||
| Peak glucose (Mg/dL) | 214 (159, 322) | 197 (149, 303) | 254 (197, 358) | <0.001 |
| Peak lactate (MEq/L)c | 1.9 (1.1, 4.0) | 1.8 (1.1, 3.9) | 2.1 (1.2, 4.5) | <0.001 |
| Peak creatinine (Mg/dL)c | 1.33 (0.80, 2.58) | 1.19 (0.77, 2.31) | 1.72 (1.03, 3.15) | <0.001 |
| Peak WBC (U/L)c | 12 (7, 19) | 11 (7, 17) | 15 (9, 22) | <0.001 |
| Conditions | ||||
| Hyperglycemia | 3,256 (68.6%) | 2,230 (62.7%) | 1,026 (86.2%) | <0.001 |
| Leukopenia | 827 (17.4%) | 587 (16.5%) | 240 (20.2%) | 0.004 |
| Leukocytosis | 2,460 (51.8%) | 1,693 (47.6%) | 767 (64.5%) | <0.001 |
| Anemia | 3,677 (77.4%) | 2,676 (75.2%) | 1,001 (84.1%) | <0.001 |
| Thrombocytopenia | 2,442 (51.4%) | 1,727 (48.5%) | 715 (60.1%) | <0.001 |
| Hypothermia | 303 (6.4%) | 182 (5.1%) | 121 (10.2%) | <0.001 |
| Fever | 1,375 (29.0%) | 885 (24.9%) | 490 (41.2%) | <0.001 |
| Outcomes | ||||
| Vasopressor requirement | 1,929 (40.6%) | 1,133 (31.8%) | 796 (66.9%) | <0.001 |
| Non-invasive mechanical ventilation | 493 (10.4%) | 298 (8.4%) | 195 (16.4%) | <0.001 |
| Intubation | 1,881 (39.6%) | 886 (24.9%) | 995 (83.6%) | <0.001 |
| Intubation and HG | – | – | – | <0.001 |
| Intubation HG− | 354 (18.8%) | 231 (26.1%) | 123 (12.4%) | – |
| Intubation HG+ | 1,527 (81.2%) | 655 (73.9%) | 872 (87.6%) | – |
| In-hospital mortality | 1,094 (23.0%) | 649 (18.2%) | 445 (37.4%) | <0.001 |
| Mortality and HG | – | – | – | <0.001 |
| Mortality HG− | 177 (16.2%) | 141 (21.7%) | 36 (8.1%) | – |
| Mortality HG+ | 917 (83.8%) | 508 (78.3%) | 409 (91.9%) | – |
| ICU stay (days) | 4 (3, 8) | 4 (2, 6) | 9 (5, 14) | <0.001 |
| Hospital stay (days) | 11 (6, 22) | 9 (5, 18) | 18 (10, 31) | <0.001 |
| Hospital stay HG− (days) | 8 (4, 15) | 7 (4, 14) | 14 (7, 22) | <0.001 |
| Hospital stay Hg+ (days) | 14 (7, 25) | 11 (5, 22) | 19 (11, 32) | <0.001 |
Median (IQR) or frequency (%).
Statistical tests performed to assess association between patient characteristic and ARDS: Wilcoxon rank-sum test on continuous variables (age, laboratory values, ICU, and hospital stay); chi-square test of independence on categorical variables (all other characteristics).
Number of patients with missing values: peak lactate 1365; peak creatinine 109; peak WBC 129.
Among both ARDS-positive and -negative ICU controls, hyperglycemia was associated with an increased risk of mortality (OR 2.4, p < 0.0001 and OR 2.5, p < 0.0001), but among patients with ARDS and COVID-19, this was not the case (OR 0.7, p = 0.06) (Figure 1E). The median hospital stay of patients with hyperglycemia was longer than for patients without hyperglycemia in all three groups (Figure 1F). This prolonged hospitalization effect was most pronounced among patients with ARDS and COVID-19, where the median hospital stay of a patient with hyperglycemia was more than three times longer than for individuals without hyperglycemia with the same condition. For ARDS-positive and ARDS-negative control patients, hyperglycemia was associated with a significantly smaller increase in median hospital stay (36% and 57%, respectively; Poisson regression model, p < 0.0001).
Hyperglycemia in COVID-19 is predominantly associated with insulin resistance and reduced adiponectin levels
To determine the mechanism underlying hyperglycemia in patients with a severe acute SARS-CoV-2 infection, we performed a multiplex metabolic protein array targeting hormones known to modulate blood glucose homeostasis. We analyzed plasma samples from patients with COVID-19 and ICU control groups from individuals enrolled in our Biobank of the Critically Ill (BOCI) (Finkelsztein et al., 2017; Siempos et al., 2018; Sureshbabu et al., 2018). The characteristics of this cohort and the full list of targets, including incretins, islet hormones, and adipokines, are shown in Table 3 and described below. The incidence of hyperglycemia within the profiled cohort is comparable with what was observed in the parental cohorts (Table 1; Figure S1A). Patients with COVID-19 and ARDS showed a higher rate of hyperglycemia than patients without COVID but with ARDS, although the effect was not statistically significant (p = 0.056; Figure S1A). Pre-existing diabetes and body mass index (BMI) were not significantly different between the three groups (Figures S1B and S1C). Since glucocorticoids are part of the treatment for severe COVID-19 (Sterne et al., 2020; Horby et al., 2021) and known to cause or exacerbate hyperglycemia, we assessed the rate of glucocorticoid treatment among the profiled cohort. There was no difference between patients with COVID-19 and ARDS and those with ARDS only (80% versus 68%, p = 0.35; Figure S1D). One patient in the ARDS-negative control group received glucocorticoids. We also charted when glucocorticoids were administered to patients along with daily glucose values and insulin injections (Figures 1G–1J; Data S1). Some patients were persistently hyperglycemic with or without glucocorticoids (Figure 1H). Others were initially hyperglycemic, but their glucose normalized and remained below the hyperglycemia threshold until hospital discharge (Figure 1I). Similarly, some patients were not hyperglycemic for several days following admission but then experienced a rise in blood glucose, which in some cases was associated with glucocorticoids (Figure 1J). We quantified the incidence of each of these patterns within the three patient cohorts and found no significant difference in their distribution (Figures S1E and S1F).
Table 3.
Characteristics of the plasma-sampled patient subset by COVID and ARDS status: patients with COVID-19 and ARDS (C+A+), control patients with ARDS (C−A+), and control patients without ARDS (C−A−)
| Characteristic | Overall, n = 101a | C+A+, n = 59a | C−A+, n = 18a | C−A−, n = 24a | p valueb |
|---|---|---|---|---|---|
| Age | 59 (50, 71) | 58 (49, 68) | 59 (52, 67) | 69 (49, 79) | 0.4 |
| Female | 28 (27.7%) | 13 (22.0%) | 5 (27.8%) | 10 (41.7%) | 0.2 |
| Race | – | – | – | – | 0.6 |
| White | 35 (34.7%) | 18 (30.5%) | 7 (38.9%) | 10 (41.7%) | – |
| Black | 13 (12.9%) | 7 (11.9%) | 2 (11.1%) | 4 (16.7%) | – |
| Asian | 6 (5.9%) | 6 (10.2%) | 0 (0.0%) | 0 (0.0%) | – |
| Unspecified/other | 47 (46.5%) | 28 (47.5%) | 9 (50.0%) | 10 (41.7%) | – |
| Comorbidities | |||||
| Obesity | 36 (36.0%) | 19 (32.8%) | 7 (38.9%) | 10 (41.7%) | 0.7 |
| COPD | 5 (5.0%) | 4 (6.8%) | 0 (0.0%) | 1 (4.2%) | 0.8 |
| Kidney disease | 5 (5.0%) | 3 (5.1%) | 1 (5.6%) | 1 (4.2%) | >0.9 |
| Heart disease | 11 (10.9%) | 5 (8.5%) | 1 (5.6%) | 5 (20.8%) | 0.2 |
| Diabetes | 32 (31.7%) | 17 (28.8%) | 9 (50.0%) | 6 (25.0%) | 0.2 |
| Hypertension | 47 (46.5%) | 26 (44.1%) | 10 (55.6%) | 11 (45.8%) | 0.7 |
| Liver disease | 9 (8.9%) | 3 (5.1%) | 2 (11.1%) | 4 (16.7%) | 0.2 |
| Malignancy | 23 (22.8%) | 5 (8.5%) | 9 (50.0%) | 9 (37.5%) | <0.001 |
| Acute diagnoses | |||||
| Acute MI | 10 (9.9%) | 5 (8.5%) | 2 (11.1%) | 3 (12.5%) | 0.7 |
| Septic shock | 41 (40.6%) | 21 (35.6%) | 12 (66.7%) | 8 (33.3%) | 0.045 |
| Vasopressor requirement | 83 (82.2%) | 55 (93.2%) | 15 (83.3%) | 13 (54.2%) | <0.001 |
| Laboratory values | |||||
| C-peptide | 2,087 (1,103; 4,367) | 3,487 (1,552; 5,756) | 1,436 (851; 2,819) | 1,437 (916; 2,014) | <0.001 |
| Ghrelin | 8.7 (6.8; 13.7) | 10.3 (6.5; 13.7) | 8.2 (7.0; 13.7) | 8.2 (7.0; 9.2) | 0.5 |
| GIP | 79 (34; 192) | 88 (39; 245) | 56 (28; 157) | 42 (22; 103) | 0.088 |
| GLP-1 | 27 (15; 43) | 33 (16; 56) | 22 (14; 30) | 21 (9; 37) | 0.029 |
| Glucagon | 119 (61; 262) | 169 (78; 276) | 79 (51; 182) | 96 (61; 221) | 0.11 |
| IL6 | 127 (37; 541) | 158 (32; 748) | 161 (87; 474) | 81 (37; 371) | 0.6 |
| Insulin | 1,088 (622; 2,150) | 1,112 (700; 2,292) | 1,156 (407; 3,168) | 873 (519; 1,265) | 0.3 |
| Leptin | 2,386 (718; 7,790) | 3,226 (1,186; 8,931) | 722 (472; 2,764) | 1,611 (449; 4,247) | 0.017 |
| PP | 118 (52; 292) | 145 (59; 321) | 208 (70; 292) | 66 (30; 189) | 0.086 |
| PYY | 68 (25; 109) | 68 (40; 112) | 71 (57; 82) | 52 (14; 114) | 0.4 |
| Amylin | 21 (11; 35) | 26 (18; 50) | 15 (14; 21) | 11 (7; 26) | 0.003 |
| Adiponectin | 27,620,432 (15,716,992; 46,898,666) | 19,876,250 (11,564,496; 33,947,040) | 50,400,260 (28,070,008; 78,738,464) | 40,776,198 (24,093,699; 59,942,332) | <0.001 |
| Lipocalin2 | 239,544 (155,865; 447,157) | 212,271 (155,368; 403,378) | 289,098 (196,100; 700,190) | 256,587 (164,284; 559,598) | 0.6 |
| Resistin | 67,348 (38,703; 160,153) | 56,684 (37,270; 109,979) | 160,151 (114,771; 218,334) | 72,100 (37,890; 197,826) | 0.031 |
| Adipsin | 3,648,674 (2,522,890; 6,361,170) | 3,176,383 (2,205,467; 6,101,886) | 3,746,169 (2,938,020; 4,867,385) | 5,351,548 (3,004,950; 8,534,055) | 0.10 |
| PAI-1 | 51,739 (36,695; 84,340) | 61,900 (41,035; 99,918) | 51,489 (26,659; 67,817) | 40,582 (29,925; 58,336) | 0.006 |
| Adiponectin to leptin ratio | 11,107 (2,217; 45,859) | 5,247 (1,547; 21,360) | 61,600 (3,912; 103,556) | 24,964 (5,353; 102,284) | 0.007 |
| Drug therapy | |||||
| Glucocorticoids | 60 (59.4%) | 47 (79.7%) | 12 (66.7%) | 1 (4.2%) | <0.001 |
| DM outpatient meds | 18 (17.8%) | 8 (13.6%) | 6 (33.3%) | 4 (16.7%) | 0.2 |
| ICU insulin | 67 (66.3%) | 49 (83.1%) | 10 (55.6%) | 8 (33.3%) | <0.001 |
| Glycemic condition | |||||
| No hyperglycemia | 25 (24.8%) | 4 (6.8%) | 5 (27.8%) | 16 (66.7%) | – |
| Insulin resistance | 39 (38.6%) | 34 (57.6%) | 3 (16.7%) | 2 (8.3%) | – |
| Beta cell failure | 37 (36.6%) | 21 (35.6%) | 10 (55.6%) | 6 (25.0%) | – |
Median (IQR) or frequency (%)
Statistical tests performed to assess association between patient characteristic and COVID/ARDS group: Kruskal-Wallis rank-sum test on continuous variables; Fisher’s exact test and Pearson’s chi-squared test on categorical variables
Hyperglycemia can be caused by two distinct mechanisms: IR or BCF due to diminished beta cell mass and/or insufficient insulin secretion from failing beta cells (DeFronzo et al., 2015). IR is characterized by hyperinsulinemia and hyperglycemia, as the pancreatic beta cells are still functional and attempt to overcome hyperglycemia by increasing insulin secretion. In contrast, individuals experiencing BCF are no longer able to secrete appropriate amounts of insulin, resulting in insulinopenia and severe hyperglycemia.
To divide the patients with hyperglycemia into these two subgroups, we assessed their serum C-peptide levels. As a by-product of insulin secretion by the pancreas, C-peptide is a direct indicator of endogenous insulin production and has a longer half-life compared with insulin. Insulin levels were also assessed, but our assay could not distinguish between endogenous and therapeutically administered exogenous insulin. Many of the patients involved in this study received insulin treatment (Figures 1H–1J; Data S1), confounding the insulin measurement results. We observed that the patients in the ICU with COVID-19 displayed significantly elevated levels of plasma C-peptide compared with either ARDS-positive and ARDS-negative controls, who did not differ from each other (Figures 2 A and S2A). This was independent of the higher rate of hyperglycemia in patients with COVID-19 since it persisted even if only hyperglycemic patients from each cohort were compared (Figures 2B and S2B). Similarly, it was also independent of glucocorticoid treatment (Figure S2C).
Figure 2.

Hyperglycemia in COVID-19 presents predominantly through insulin resistance
(A) C-peptide concentration in the plasma of patients with COVID-19 and ARDS (C+A+, n = 59), ARDS-positive ICU controls (C−A+, n = 18), and ARDS-negative ICU controls (C−A−, n = 24), measured by multiplex protein array. One data point per patient, representing the average of two technical replicates.
(B) C-peptide concentration in the plasma of patients and controls with hyperglycemia (C+A+, n = 55; C−A+, n = 12; C−A−, n = 8), measured by multiplex protein array.
(C and D) C-peptide/glucose ratio of all patients with COVID-19 ARDS and controls (C) or only those with hyperglycemia (D). C-peptide measured by multiplex protein array.
(E and F) Subcategorization of patients with COVID-19 ARDS and controls as non-hyperglycemic (non-HG), insulin resistant (IR), and beta cell failure (BCF). (E) shows the incidence of non-HG, IR, and BCF with respect to all patients. (F) shows the incidence of IR and BCF among patients with HG.
Data were analyzed using Kruskal-Wallis with Dunn’s post-hoc test (A–D) or two-sided chi-square test (E and F). Both tests were corrected for multiple comparisons (Bonferroni-Holm).
C-peptide values were compared against glucose levels at or close to the plasma collection time to determine C-peptide/glucose ratios, which is an established marker of beta cell function (Lee et al., 2014; Saisho, 2016; Saisho et al., 2011). An elevated C-peptide/glucose ratio coupled with hyperglycemia reflects IR. Similar to the raw C-peptide values, patients with COVID-19 showed higher C-peptide/glucose ratios compared with ARDS-positive and ARDS-negative controls, which did not differ significantly (Figures 2C and S2D). Again, this trend persisted even after restricting the comparison to only hyperglycemic patients within each cohort and was independent of glucocorticoid treatment (Figures 2D, S2E, and S2F).
To dissect the mechanism of hyperglycemia in patients with COVID-19, study participants with hyperglycemia were divided into subtypes reflecting a predominantly IR or BCF phenotype (Figures S2G–S2L). A study participant with type 1 diabetes was adjudicated to have BCF, validating our classification scheme. The incidence of IR was more than three times greater among patients with COVID-19 than among ARDS-positive controls and more than six times greater than among ARDS-negative controls (Figures 2E and 2F). Glucocorticoids are known to cause hyperglycemia, by inducing either IR or beta cell damage (Tamez-Pérez et al., 2015). We found no difference in the incidence of glucocorticoid treatments among the IR and BCF subgroups within the COVID-19 or ARDS-positive control patients (Figure S3A). Only one of the patients assayed in the ARDS-control group received glucocorticoids. There was also no difference in the prevalence of obesity between BCF and IR subtypes in any of the three patient groups. A pre-existing diagnosis of type 2 diabetes, on the other hand, was significantly associated with BCF over IR in both the COVID-19 and ARDS-positive control groups (Fisher’s exact test, p = 0.02 and 0.04, respectively). This suggests that BCF occurs mostly in people with DM prior to COVID rather than developing DM de novo as a result of the viral disease. Given the higher incidence of glucocorticoid treatments in the COVID-19 ARDS-positive group and DM among ARDS-positive control patients (Figures S1B and S1D), we constructed a logistic regression model that adjusted for these differences. We still found a significantly higher rate of IR in patients with COVID-19 compared with both ARDS-positive (OR 8.3, p = 0.009) and ARDS-negative controls (OR 15.1, p < 0.0001) (Figure S3B). No difference was observed in the proportion of IR between the two controls or in the distribution of BCF between any of the groups.
Beta cell function and insulin sensitivity are conditioned by endocrine stimuli between tissues. Over the last two decades, it has become increasingly clear that the adipose tissue (AT) acts as a major source of such stimuli. Proteins and cytokines secreted from the AT into the bloodstream, collectively called adipokines, have been shown to regulate beta cell function and mass and to modulate insulin sensitivity in peripheral tissues (Gómez-Banoy and Lo, 2019). Dysfunctional adipokine secretion has been associated with metabolic disorders such as obesity, metabolic syndrome, and type 2 diabetes.
We therefore tested if severe COVID-19 is associated with aberrations in glucoregulatory hormones such as those arising from the islets, incretins, and adipokines (Figures 3A–3F and S4A–S4J). Furthermore, we assessed whether the abundance of any glucoregulatory hormone differed between the hyperglycemic subgroups (Figures S5A–S5Q). Indeed, the adipokine adiponectin was decreased by 50%–60% in the serum of patients suffering from COVID-19 with ARDS, compared with ICU controls with or without ARDS (Figure 3A). The two controls did not differ from each other. Adiponectin is associated with anti-diabetic, anti-atherogenic, and anti-inflammatory properties and its levels are known to be lower in individuals suffering from obesity or type 2 diabetes. However, we found that the two control groups contained slightly higher percentages of patients with obesity than the COVID-19 group (Figure S1C). Furthermore, the ARDS-positive control group had a higher percentage of patients with diagnosed diabetes (Figure S1B), suggesting that the decrease in adiponectin associated with COVID-19 may even be underestimated. We found no difference in the abundance of adiponectin among the IR and BCF hyperglycemic subgroups within patients with COVID-19 (Figure S5G). Adipsin, an adipokine known to promote beta cell survival and insulin secretion (Gómez-Banoy et al., 2019), was also decreased among the patients with COVID-19 compared with ICU controls, although this difference was not statistically significant (overall p = 0.06; Figure S4H). Leptin, an adipokine regulator of appetite and energy expenditure, was increased with respect to ARDS-positive but not ARDS-negative controls (Figure 3B). The adiponectin-leptin ratio, a biomarker of metabolic health and adipose function, was severely depressed in patients with COVID-19 by 10-fold compared with ARDS-positive and 6-fold compared with ARDS-negative controls (Figure 3C) (Frühbeck et al., 2019). We also found an increase in amylin among patients with COVID-19 (Figure 3D). Like C-peptide, this protein is co-secreted with insulin from pancreatic beta cells, further confirming the beta cell hyper-secretory phenotype present in a majority of patients with COVID-19 and ARDS. PAI-1, an adipokine that acts as an inhibitor of fibrinolysis, was also found to be significantly increased with respect to ARDS-negative but not ARDS-positive controls (Figure 3E), as was reported previously for patients with severe COVID-19 (Zuo et al., 2021). However, increased PAI-1 levels did not correlate with hyperglycemia (Figure S5O). Resistin, a macrophage-secreted peptide with elevated expression in individuals with diabetes, was increased in ARDS-positive controls but not in patients with COVID-19 and ARDS, compared with ARDS-negative controls (Figure 3F). Notably, IL-6, ghrelin, glucagon, GIP, pancreatic polypeptide (PP), PYY, lipocalin-2, and GLP-1 did not differ between the three groups (Figure S4). These results raise the possibility that COVID-19 causes adipocyte dysfunction, which may occur as a direct result of SARS-CoV-2 infecting adipocytes or other cells within the AT, or through other indirect mechanisms.
Figure 3.

Altered metabolic hormone profiles in COVID-19
Plasma from patients with COVID-19 ARDS (C+A+, n = 59) and control ICU patients with ARDS (C−A+, n = 18) and without ARDS (C−A−, n = 24) was analyzed by multiplex metabolic protein array, targeting hormones known to modulate blood glucose homeostasis. The plot shows one data point per patient, representing the average of two technical replicates. The data were analyzed using Kruskal-Wallis tests. All targets were subjected to Dunn’s tests with multiple comparison correction (Bonferroni-Holm). All targets with at least one Dunn’s test with p < 0.05 are shown here.
SARS-CoV-2 replicates in hamster adipose tissue and alters adipokine expression
To test whether SARS-CoV-2 can cause adipocyte dysfunction, we measured the mRNA levels of adipokines within the AT of Syrian hamsters following infection with the SARS-CoV-2 Washington strain (Chan et al., 2020; Sia et al., 2020). Indeed, Adipoq was robustly decreased by 80% in the subcutaneous adipose tissue (SAT) of SARS-CoV-2-infected hamsters compared with controls (Figure 4 A); in visceral adipose tissue (VAT), no significant difference was observed (Figure S6A). Lep mRNA also decreased in hamster fat after infection with SARS-CoV-2, a trend that was not mirrored by human blood samples (Figures 4A and 3B). Adiponectin protein levels decreased with SARS-CoV-2 infection in SAT, VAT, and serum compared with mock-infected controls (Figures 4B–4E). To determine whether the SARS-CoV-2 virus might infect AT, we performed qPCR for the replicating strand of the viral nucleocapsid gene and found elevated levels of SARS-CoV-2 viral RNA in the fat of infected hamsters compared with mock controls (Figure 4F). Unbiased transcriptomic analyses of ATs from control and infected hamsters revealed that SARS-CoV-2 strongly induces an antiviral response that was more prominent in the visceral than subcutaneous fat (Figures 4G, 4H, and S6B; Data S2 and S3). Many cytokines, chemokines, and immune defense pathways increased, such as granulocyte activation, phagocytosis, and the adaptive immune response (Figures 4H and 4I). This suggests that cells within the AT may be permissive to viral infection and replication, but which cell type remains to be determined. We found that adipocytes express the potential SARS-CoV-2 entry factors identified to date (Figures S6C and S6D). We infected primary human adipocytes in vitro with SARS-CoV-2 Washington strain and a murine adipocyte cell line with the mouse susceptible SARS-CoV-2 South African variant (Montagutelli et al., 2021; Yao et al., 2021) and found that both were permissive to viral infection (Figures 4J and 4K). The expression of Adipoq was also halved in mouse but not human adipocytes after SARS-CoV-2 infection (Figures 4L and S6E). Collectively these results indicate that SARS-CoV-2 incites a robust inflammatory response in ATs in part by direct infection of adipocytes to cause tissue dysfunction.
Figure 4.

SARS-CoV-2 replicates in hamster adipose tissue and induces an inflammatory gene program
(A) qRT-PCR of mRNA from subcutaneous fat tissue of Syrian hamsters infected with SARS-CoV-2 or mock virus. Data were analyzed using Welch’s t tests with Holm-Sidak’s multiple comparisons correction (n = 6 hamsters per group; each data point represents the average of two technical replicates; the column and error bars show mean and SD).
(B) Representative western blot for adiponectin within subcutaneous adipose tissue (SAT), visceral adipose tissue (VAT), or serum from Syrian hamsters infected with SARS-CoV-2 (V) or mock virus (M) (n = 3 hamsters per group, two technical replicates were carried out).
(C–E) Quantification of the western blots shown in (B). The data were analyzed using Welch’s t test, the column and error bars show mean and SD.
(F) qRT-PCR for the replicating strand of the SARS-CoV-2 nucleocapsid gene using RNA from SAT and VAT from Syrian hamsters infected with SARS-CoV-2 or mock virus. Data were analyzed using Mann-Whitney tests with Holm-Sidak’s multiple comparisons correction (n = 6 hamsters per group; each data point represents the average of two technical replicates; the column and error bars show mean and SD).
(G) Volcano plot comparing gene expression in visceral adipose tissue following SARS-CoV-2 or mock infection (n = 6 hamsters per group).
(H) Gene set enrichment analysis on visceral adipose tissue from SARS-CoV-2-infected hamsters compared with mock controls. Only genes with FDR < 0.01 were used in the analysis; log2 (fold change) was used as the enrichment score.
(I) Differential expression of chemokines and cytokines in the visceral adipose tissue of SARS-CoV-2-infected hamsters compared with mock controls, obtained from bulk RNA-seq (FDR < 0.01 for all displayed targets).
(J and K) qRT-PCR for the replicating strand of the SARS-CoV-2 nucleocapsid gene in human primary adipocytes (J) or 3T3-L1 mouse adipocyte cell line (K) infected with SARS-CoV-2 (Washington strain in J or South African strain in K) with MOI 0.1 or heat-inactivated control. Data were analyzed using Mann-Whitney test (human, n = 9 independently infected samples from two donors; 3T3-L1, n = 12 independently infected samples; each pooled from two independent experiments; the column and error bars show mean and SD).
(L) qRT-PCR of mRNA from 3T3-L1 adipocytes infected with SARS-CoV-2 or mock virus. Data were analyzed using Mann-Whitney tests with Holm-Sidak’s multiple comparisons correction (n = 12 independently infected samples per group; data are pooled from two independent experiments; the column and error bars show mean and SD).
Discussion
Here, we found that hyperglycemia is a clear and strong poor prognostic factor in COVID-19 that is associated with progression to ARDS, need for mechanical ventilation, and death. In our center, the vast majority (86%) of critically ill patients with COVID-19 and with ARDS experienced hyperglycemia. Although this number is strikingly high, we observed an equal proportion of patients with ARDS without COVID-19 who also exhibited hyperglycemia, demonstrating the importance of a comparison group. These findings have also been borne out in other studies, although control groups were often not included, thus making it difficult to ascertain the specific effect of COVID-19 (Carrasco-Sánchez et al., 2021; Smith et al., 2021; Wang et al., 2020).
The molecular underpinnings of hyperglycemia in acute SARS-CoV-2 infection remain unclear. To address this gap, we studied patients with hyperglycemia and afflicted with severe SARS-CoV-2 infection as this group is expected to show the most dramatic metabolic effects from acute viral infection. IR is the predominant mechanism of hyperglycemia in severe COVID-19, even after accounting for glucocorticoid use. Notably, the mechanism of hyperglycemia is different in COVID-19 compared with our two ICU control groups without COVID-19 where BCF was more common. While we did observe BCF in a minority of patients, many of them had pre-existing advanced diabetes marked by the use of two or more anti-hyperglycemic medications or insulin, or an elevated percent hemoglobin A1c (%HbA1c), signifying prior poor blood glucose control. We also note that hyperglycemia is associated with an increased risk of mortality in both control patient groups without COVID. In contrast, the presence of hyperglycemia in patients with COVID-19 and ARDS did not portend a higher risk of death, further supporting a fundamental difference in the mechanism of hyperglycemia in COVID-19. Perhaps classifying the mechanism of hyperglycemia as IR or BCF in an individual infected with SARS-CoV-2 by insulin, C-peptide, and glucose measurements may guide glucose lowering therapy. Insulin is the accepted treatment for hyperglycemia in hospitalized patients. Our study raises the question for patients with hyperglycemia and severe COVID-19 who display an IR phenotype, whether adding an insulin sensitizing medication, such as a thiazolidinedione or metformin, may increase glucose metabolism and spare insulin usage. This would need to be tested for safety and efficacy before clinical recommendations are made. Conversely, patients with COVID-19 and hyperglycemia with BCF would be treated with insulin as the mainstay, avoiding insulin sensitizing agents due to the potential for adverse effects.
Our data suggest that adipose dysfunction is a feature of COVID-19 that may drive hyperglycemia. Adiponectin and adiponectin/leptin ratios are markedly reduced in patients with severe COVID-19. There may be other hormones affecting IR and insulin secretion dysregulated in COVID-19 that were not assayed in this study. Hamsters infected with SARS-CoV-2 show the presence of SARS-CoV-2 viral RNA in the AT along with substantial decreases in Adipoq expression. The decrease in adiponectin protein but not mRNA in the visceral fat of hamsters infected with SARS-CoV-2 suggests that there may be post-transcriptional mechanisms at play. While circulating adiponectin is decreased in both patients with COVID-19 and hamsters infected with SARS-CoV-2, circulating leptin levels are higher in patients with COVID-19 whereas Lep is decreased in the hamsters. The hamster model may capture some but not all features of the human disease. Of note, the hamster model used in this study is comparatively mild as hamsters do not need to undergo mechanical ventilation unlike the patients with COVID-19 and ARDS. In the future, the hamster is a promising model that can be used to dissect the pathophysiological mechanisms of acute and long COVID pertaining to glucose homeostasis and diabetes.
Strikingly, both human and mouse adipocytes have relatively higher expression of TFRC, NRP1, and FURIN than ACE2 and TMPRSS2, the latter two being the better studied viral entry factors. Future studies will be needed to determine which receptor(s) SARS-CoV-2 uses to infect adipocytes. We also find that Adipoq is decreased in mouse adipocytes following in vitro infection with SARS-CoV-2, but ADIPOQ in human breast adipocytes is not. This may be due to the fat depot origin of the cells, specific donors, or participation of other factors in vivo. Collectively our results implicate direct viral infection of ATs as one potential mechanism for AT dysfunction and IR. While we show that adipocytes are capable of being directly infected by SARS-CoV-2, it is possible that other cell types within the adipose, such as endothelial cells and preadipocytes, may be susceptible. Systemic inflammation in acute COVID-19 may also contribute to adipose dysfunction and IR. Diagnosing adipose dysfunction in COVID-19 by assessing circulating adipokine levels has the potential to be clinically actionable in the future as medications such as thiazolidinediones decrease AT inflammation and improve adipose function and insulin sensitivity in part through adiponectin. Whether thiazolidinediones decrease viral replication and impact future metabolic complications in survivors with COVID-19 remains an area for future research.
This study is not powered to detect rare events, nor does it rule out potential SARS-CoV-2 infection of pancreatic islet cells, but it suggests that it is not a major etiology of hyperglycemia in the majority of patients with COVID-19. Recent studies using pancreatic tissues from deceased individuals who had COVID-19 have shown that in some individuals a small minority of beta cells show signs of active viral infection (Müller et al., 2021; Tang et al., 2021; Wu et al., 2021). Even when human islet cells are infected in vitro with SARS-CoV-2 and a higher infection rate was observed, there was only a mild (Wu et al., 2021) or no effect (Tang et al., 2021) seen in glucose-stimulated insulin secretion. Thus, viral infection of beta cells in patients may be uncommon or often subclinical. Notwithstanding, follow-up studies on COVID survivors and those with “long COVID” are needed to monitor for future IR and BCF. Early data suggest that there may be persistent IR post-COVID-19 (Montefusco et al., 2021). It remains to be determined if patients who recovered from hyperglycemia prior to discharge will have an increased future risk of developing diabetes.
Limitations of study
Our study has a number of limitations. First, the study was designed retrospectively and plasma samples were derived from consenting patients. Consequently, COVID-19 and control groups are not matched for demographic variables, comorbidities, or in-hospital treatments. A logistic regression model was used to correct for previously diagnosed diabetes and glucocorticoid treatment, but further corrections were limited by the relatively small sample size.
Second, patients were not fasted before plasma samples and glucose measurements were taken, making traditional methods of assessing IR such as HOMA-IR unfeasible. In this study, we classified hyperglycemia as predominantly IR or BCF based on plasma samples collected early, generally during the first 2 days of ICU admission. IR and BCF are not mutually exclusive and hyperglycemia can be dynamic, especially in acutely ill patients who may be experiencing septic shock, evolving through different phases of acute viral infection, and being treated with glucocorticoids. Our data in critically ill patients preclude extensive physiological assays of insulin secretion and insulin sensitivity. Future studies with longitudinal assessment of IR and BCF over the course of acute SARS-CoV-2 infection may help to better understand the dynamic nature of hyperglycemia. Postprandial C-peptide/glucose ratios are an established marker of beta cell function. However, they are usually assessed at a set time following a standardized meal. This is not possible in the context of the critically ill, intubated patients assessed in this study.
Third, the mechanism behind the decreased adiponectin expression in patients with COVID-19 remains to be determined. Although we show the presence of replicating SARS-CoV-2 genetic material within hamster AT and human and murine adipocytes in vitro following SARS-CoV-2 infection, it is still unclear to what extent a similar mechanism exists in people infected with COVID-19. Baseline adiponectin levels prior to infection were not available in the patients to unequivocally demonstrate diminished adiponectin following infection. Furthermore, individuals with acute COVID-19 often experience decreased food intake; if and how this contributes to decreased adiponectin remains to be determined. Lastly, fat biopsies were not possible in these critically ill patients to ascertain active adipose viral infection.
STAR★Methods
Key resources table
| REAGENT or RESOURCE | SOURCE | IDENTIFIER |
|---|---|---|
| Antibodies | ||
| Adiponectin | EMD Millipore | Cat#MAB3608; RRID: AB_94943 |
| Bacterial and virus strains | ||
| SARS-CoV-2 Washington strain (isolate USA-WA1/2020) | BEI Resources | Cat#NR-52281 |
| SARS-CoV-2 South African strain (isolate hCoV-19/USA/MD-HP01542/2021) | BEI Resources | Cat#NR-55282 |
| Biological samples | ||
| Human blood plasma samples | Weill Cornell Medicine Registry and Biobank of Critically Ill Patients | N/A |
| Human breast adipocytes | Collected from patients undergoing mastectomy/breast reduction at Weill Cornell Medicine | N/A |
| Chemicals, peptides, and recombinant proteins | ||
| Collagenase type I | Sigma Aldrich | Cat#C0130 |
| Hyaluronidase | Sigma Aldrich | Cat#H3506 |
| IBMX | Sigma | Cat#I5879 |
| Dexamethasone | Sigma-Millipore | Cat#D1756 |
| Insulin | Sigma | Cat#I2643 |
| Rosiglitazone | Cayman Chemical | Cat#71740 |
| Critical commercial assays | ||
| MILLIPLEX MAP Human Adipokine Bead Panel | EMD Millipore | Cat#HADK1MAG-61K |
| MILLIPLEX MAP Human Metabolic Hormone Magnetic Bead Panel | EMD Millipore | Cat#HMHEMAG-34K |
| C-peptide ELISA | Mercodia | Cat#10-1141-01 |
| Insulin ELISA | Mercodia | Cat#10-1132-01 |
| RNeasy Mini kit | Qiagen | Cat#74106 |
| High Capacity cDNA RT kit | Thermo | Cat#4368813 |
| TruSeq Stranded mRNA Library Prep Kit | Illumina | Cat#20020594 |
| MycoAlert Mycoplasma Detection Kit | Lonza | Cat#LT07-118 |
| Deposited data | ||
| RNA Seq Raw Data | NCBI GEO | GEO: GSE183714 |
| Western blot original images | Mendeley Data | https://doi.org/10.17632/hvp58h6jc7.1 |
| Experimental models: Cell lines | ||
| Vero E6 cells | ATCC | Cat#CRL-1586 |
| 3T3-L1 cells | Provided by Dr. Bruce Spiegelman, Dana-Farber Cancer Institute | N/A |
| Experimental models: Organisms/strains | ||
| Golden Syrian Hamsters (Mesocricetus auratus) | Charles River | Crl:LVG(SYR) |
| Oligonucleotides | ||
| Listed in Table S1 | N/A | N/A |
| Software and algorithms | ||
| SAS 9.4 | SAS Institute | https://www.sas.com/ |
| R 4.0.3 and RStudio 1.4.1103 | R Foundation for Statistical Computing | https://cran.r-project.org |
| ImageJ 1.53c | NIH | https://imagej.nih.gov/ij/ |
| Graphpad Prism 9.0.2 | GraphPad Software | https://www.graphpad.com |
Resource availability
Lead contact
Further information and requests for resources and reagents should be directed to and will be fulfilled by the lead contact, James Lo (jlo@med.cornell.edu).
Materials availability
This study did not generate new unique reagents.
Experimental model and subject details
Study design and human cohort description
The COVID-19-positive component of the study cohort was sourced from multiple institutional resources designed to facilitate COVID research. These resources are aggregated and integrated into a database called the COVID Institutional Data Repository (COVID-IDR). The COVID-IDR contains data extracted automatically from electronic health record (EHR) systems, as well as data abstracted manually, using REDCap (Harris et al., 2009), an established research data collection tool, for patients testing positive for SARS-CoV-2 via RT-PCR who were admitted or seen in the emergency department at three hospitals within the NewYork-Presbyterian (NYP) healthcare system between March 3, 2020 and May 15, 2020. Some variables (including comorbidities and outcomes) were derived from the REDCap project via manual abstraction, while others (e.g. in-hospital medication usage) were derived from automatically extracted EHR data (Goyal et al., 2020b).
The control population was drawn from an existing database of patients with an ICU admission from 2013-2019 at NYP-WCMC, the Weill Cornell-Critical Care Database for Advanced Research (WC-CEDAR), which aggregates data from institutional EHR’s for all patients managed in intensive care units at NYP-WCMC and NYP-LMH (Schenck et al., 2021a; Sholle et al., 2017).
For both cases and controls, we extracted demographics (age, sex), in-hospital laboratory tests (glucose, %HbA1c, LDH, creatinine and WBC), medication use (glucocorticoids, insulin, dextrose) and comorbidity information (history of diabetes, hypertension, coronary artery disease, obesity [BMI ≥ 30], kidney disease, liver disease, chronic obstructive pulmonary disease [COPD], and cancer). Acute conditions, such as ARDS, acute MI, septic shock and vasopressor requirements were also available. For ARDS, the Berlin definition of ARDS was used (Ranieri et al., 2012) and required a minimum PEEP/CPAP of 5 cm H2O on either invasive mechanical ventilation or non-invasive mechanical ventilation to be considered in either cohort. We also used the PaO2/FiO2 ratio of < 300 in order to qualify. If a PaO2 was not available, an SpO2 was used to estimate a PaO2 in keeping with current NHLBI sponsored PETAL network standards (Huang et al., 2017; Moss et al., 2019; Schenck et al., 2021b). We used Sepsis-3 criteria as having both cultures and antibiotics within 24 hours of arrival to the ICU with evidence of organ dysfunction for inclusion into the COVID-negative ARDS control group to ensure infection associated lung injury (Singer et al., 2016). These data are listed in Table 1 (patients with COVID-19) and Table 2 (ICU controls).
For patients with COVID-19, data pertaining to BMI, diabetes status, and %HbA1c were manually extracted by trained and quality controlled medical student reviewers (Goyal et al., 2020b). BMI was determined from height and weight recorded during hospital admission or from an outpatient encounter within the past 3 months. Diabetes status was defined by physician documentation of type 1 or type 2 DM in the medical history/diagnosis codes or by %HbA1c ≥ 6.5. %HbA1c levels recorded within 10 days of hospitalization or within 90 days prior to admission were included. Diabetes medications were automatically extracted from the EHR and manually confirmed for plasma-sampled individuals.
For both patients with COVID-19 and ICU controls, hyperglycemia was defined as having a peak glucose value of > 170 mg/dL. Peak glucose was defined as the highest glucose value during the entire hospitalization. Glucose measurements were extracted from the electronic health record. Patients without glucose values were excluded from the analysis. For study participants with plasma profiled samples, two separate glucose values > 170 mg/dL were required to be classified as hyperglycemic. In addition, dextrose infusions were assessed to ensure that iatrogenic hyperglycemia was not being identified.
The study was approved by the institutional review board of WCMC (1405015116, 20-05022072, 20-03021681).
Human plasma samples
Starting in 2014, investigators at NYP-WCMC prospectively obtained consent from patients admitted to the ICU to participate in a registry involving collection of biospecimens and clinical data (Weill Cornell Medicine Registry and Biobank of Critically Ill Patients). Additionally, during the COVID-19 pandemic, an electronic informed consent was obtained from all individuals who were SARS-CoV-2-positive or from their surrogates for inclusion. Demographics, comorbidities, diagnoses, and laboratory values for the plasma-sampled subset of patients are shown in Table 3.
Hamster model
3-5-week-old male Golden Syrian hamsters (Mesocricetus auratus) were obtained from Charles River. Hamsters were acclimated to the CDC/USDA-approved BSL-3 facility of the Global Health and Emerging Pathogens Institute at the Icahn School of Medicine at Mount Sinai for 2-4 days before viral infection. The hamsters were housed in a temperature-controlled room (20 - 22°C), on a 12 h light/dark cycle (08:00 – 20:00 lights on), with food (PicoLab Rodent Diet 20 5053) and water provided ad libitum. All hamsters were in good health and demonstrated normal behavior until the infection. All animal experiment procedures, breeding and ethical use were performed in accordance with the guidelines set by the Institutional Animal Care and Use Committee at Mount Sinai School of Medicine.
Virus lines
SARS-CoV-2 Washington strain (isolate USA-WA1/2020, NR-52281) and SARS-CoV-2 South African strain (isolate hCoV-19/USA/MD-HP01542/2021, NR-55282) were provided by the Center for Disease Control and Prevention and obtained through BEI Resources, NIAID, NIH.
Cell lines
Vero E6 (African green monkey [Chlorocebus aethiops] kidney, CVCL_0574; female) were obtained from ATCC (https://www.atcc.org/). Cells were cultured in Dulbecco’s Modified Eagle Medium (DMEM) supplemented with 10% FBS and 100 U/mL penicillin and 100 μg/mL streptomycin. Cells were tested for the presence mycoplasma bi-weekly using MycoAlert Mycoplasma Detection Kit (lonza), They were not authenticated by an external service but were derived directly from ATCC. 3T3-L1 adipocytes (Mus musculus, male) were cultured in DMEM (Corning) with 10% FBS at 37°C, 5% CO2. L1 cells were not tested for mycoplasma and validated by differentiation.
Human adipocyte donors
Breast adipose tissue was obtained from patients undergoing mastectomy or breast reduction surgery under approved Institutional Review Board protocols (20-01021391 and 1510016712) at Weill Cornell Medicine. Two independent experiments with adipocytes from different donors were carried out. The patient characteristics were as follows:
| Age | BMI | Gender | Procedure |
| 43 | 18.72 | Female | Left Mastectomy with Tissue Expander |
| 22 | 30.9 | Female | Bilateral Reduction Mammoplasty |
Method details
Biobank sample collection and ELISA
For each participant, whole blood (6-10 mL) was obtained. Briefly, whole blood samples were drawn into EDTA-coated blood collection tubes (BD Pharmingen, San Jose, CA). Samples were stored at 4°C and centrifuged within 4 hours of collection. Plasma was separated and divided into aliquots and kept at -80°C. Plasma insulin and C-peptide were measured by ELISA and values determined by a standard curve according to manufacturer’s instructions (Mercodia, Uppsala, Sweden).
Multiplex metabolic protein array
From the COVID and control populations, 101 patients (C+A+ n = 59, C-A+ n = 19, C-A- n = 23) with plasma samples were selected and analyzed using the MILLIPLEX MAP Human Adipokine and Human Metabolic Hormone Magnetic Bead Panels (EMD Millipore), according to manufacturer’s instructions. Undiluted plasma was used for the Metabolic Hormone Panel. For the Adipokine Panel, plasma samples were diluted 1:800. The targets of the Metabolic Hormone Panel were: C-peptide, Ghrelin, GIP, GLP-1 (active), Glucagon, IL-6, Insulin, Leptin, PP, PYY, Amylin (active). The targets of the Adipokine panel were: Adiponectin, Adipsin, Resistin, Lipocalin 2, PAI-1.
Glycemic categorization of patients
Patients classed as hyperglycemic were subdivided into IR or BCF. The C-peptide reading from the Multiplex Metabolic Protein Array (pg/mL) was divided by the glucose measurement closest to the time of plasma collection (mg/dL) to calculate C-peptide/glucose ratios. Patients who had a ratio of less than 20.5 and were either hyperglycemic or receiving insulin treatment at sampling time were classed as BCF. Hyperglycemic patients with a C-peptide/glucose ratio > 20.5 were classed as IR. The cutoff ratio of 20.5 was determined empirically, based on clinical review of patients showing consistency with BCF phenotype, such as moderate to severe hyperglycemia and extensive insulin dosing, confirming endogenous insulin deficiency. Additionally, a ratio of 20.2 has been previously associated with poor beta cell reserve and future need for insulin therapy (Saisho, 2016; Saisho et al., 2011). The subcategorization was confirmed using C-peptide values obtained by ELISA.
SARS-CoV-2 propagation and infections
SARS-CoV-2 was propagated in Vero E6 cells in DMEM supplemented with 2% FBS, 4.5 g/L D-glucose, 4 mM L-glutamine, 10 mM Non-Essential Amino Acids, 1 mM Sodium Pyruvate and 10 mM HEPES using a passage-2 stock of virus. Three days after infection, supernatant containing propagated virus was filtered through an Amicon Ultra 15 (100 kDa) centrifugal filter (Millipore Sigma) at ∼4000 rpm for 20 minutes. Flow through was discarded and virus was resuspended in DMEM supplemented as described above. Infectious titers of SARS-CoV-2 were determined by plaque assay in Vero E6 cells in Minimum Essential Media supplemented with 2% FBS, 4 mM L-glutamine, 0.2% BSA, 10 mM HEPES and 0.12% NaHCO3 and 0.7% agar. All work involving live SARS-CoV-2 was performed in the CDC/USDA-approved BSL-3 facility of the Icahn School of Medicine at Mount Sinai in accordance with institutional biosafety requirements.
Hamsters were anesthetized by intraperitoneal injection with a ketamine HCl/xylazine solution (4:1) before being intranasally inoculated with 100 pfu of SARS-CoV-2 isolate USA-WA1/2020 in PBS (or PBS only as a control) in a total volume of 100 μl. Two days post-infection hamsters were killed and fat tissue depots were collected (Tan et al., 2018). All animal experiments were performed on at least two separate occasions.
Human adipocytes and mouse adipocytes were infected with SARS-CoV-2, Washington strain or SARS-CoV-2, South African strain respectively at the indicated MOI and incubated for 24 hours at 37°C. At 24 hpi, human adipocytes and mouse adipocytes were washed three times in PBS and lysed in TRIzol for RNA analysis.
Heat inactivation of SARS-CoV-2 virus
SARS-CoV-2 isolate USA-WA1/2020 (NR-52281) or SARS-CoV-2 South African isolates were heated to 100°C for 5 minutes to generate heat inactivated stocks (Jureka et al., 2020). Heat inactivated SARS-CoV-2 was then tested for complete inactivation by plaque assay in Vero E6 cells as described previously (Tang et al., 2021).
RNA extraction and qPCR analysis
RNA isolation from hamster fat and adipocyte samples was performed using the RNeasy Mini kit (Qiagen) as per manufacturer’s protocol. cDNA was synthetized through reverse transcription using a cDNA synthesis kit (Thermo). cDNA was analyzed by real-time PCR using specific gene primers and a SYBR Green Master Mix (Quanta). To quantify viral replication, measured by the expression of sgRNA transcription of the viral N gene, one-step quantitative real-time PCR was performed using SuperScript III Platinum SYBR Green One-Step qRT-PCR Kit (Invitrogen) with primers specific for the TRS-L and TRS-B sites for the N gene as well as Gapdh as an internal reference. Quantitative real-time PCR reactions were performed on an Biorad Real-Time PCR Instrument (ABI). Delta-delta-cycle threshold (ΔΔCT) was determined relative to Gapdh levels and normalized to mock infected samples (in vivo) or heat-inactivated samples (in vitro). Primer sequences are listed in Table S1.
Western blot
4-12% Bis-Tris Bolt gels (Thermo) were loaded with 20 μg of tissue protein extract from hamster SAT or VAT, or 1 μL of hamster serum. The protein was transferred to a PVDF membrane and probed with primary antibody for adiponectin (EMD Millipore, MAB3608, 1:1000) overnight at 4°C, followed by an incubation with horseradish peroxidase-conjugated secondary antibody (1:2000). Signal detection was carried out using SuperSignal West Pico detection reagent (Thermo). Ponceau stain was used as a loading control. Band density was quantified using ImageJ.
RNA-seq of RNA from hamster fat tissue
1 mg of total RNA was enriched for polyadenylated RNA species and prepared for short-read next-generation sequencing using the TruSeq Stranded mRNA Library Prep Kit (Illumina) according to the manufacturer’s instructions. Sequencing libraries were sequenced on an Illumina NextSeq 500 platform. Fastq files were generated using bcl2fastq (Illumina) and aligned to the Syrian golden hamster genome (MesAur 1.0, ensembl) using the RNA-Seq Alignment application (Basespace, Illumina). Golden Hamster ensembl genes were matched to homologous external gene names, human homolog ensembl genes, and human associated homolog gene names using BioMart (Durinck et al., 2005, 2009). OrthoFinder was used to generate orthologous human ensembl gene ids and gene names (Emms and Kelly, 2019).
After further filtering and quality control, R package edgeR (Robinson et al., 2010) was used to calculate RPKM and Log2 counts per million (CPM) matrices as well as perform differential expression analysis. Principal component analysis was performed using Log2 CPM values and gene set analysis was run with WebGestalt (Liao et al., 2019).
In vitro differentiation of 3T3-L1 adipocytes
3T3-L1 adipocytes were cultured in DMEM (Corning) with 10% FBS at 37°C, 5% CO2, until confluent. Cells were differentiated via a 48 h treatment with 0.5 mM IBMX, 1 μM Dexamethasone, 850 nM Insulin and 1 μM Rosiglitazone, followed by 48 h with 850 nM Insulin and 1 μM Rosiglitazone, and a further 48 h with 850 nM Insulin. The cells were used for viral infections within 24 h following completed differentiation.
Preparation of human adipocytes
Approximately 20 mL of tissue was dissected, avoiding blood vessels and fibrous areas. The tissue was then minced into 2-3 mm pieces and digested in 50 mL total volume of Ham’s F12 media (Corning) supplemented with 10% FBS, 1% penicillin/streptomycin, 10 mg/mL collagenase type I (Sigma Aldrich) and 10 ug/mL hyaluronidase (Sigma Aldrich). Tissue was digested for 1 hr at 37°C on a rotator. The digested tissue was then centrifuged at 500 g for 10 min to separate the adipocyte fraction (floating layer) and stromal vascular fraction (pellet). Oil from lysed adipocytes was removed by aspiration and a wide orifice pipet tip was used to collect the adipocytes below the oil layer. Adipocytes were washed twice and cultured in Ham’s F12 media (Corning) supplemented with 10% FBS, 1% penicillin/streptomycin (37°C, 5% CO2). Viral infections were performed within 24 h following adipocyte isolation.
Quantification and statistical analysis
Logistic regression model
Models to determine if group membership predicted the outcome of euglycemia, insulin resistance, or beta cell failure were determined from the assays. The outcome was assumed to be ordinal; ranks of 0, 1, and 2 were assigned to euglycemic, insulin resistant, and beta cell failure patients respectively. As such, ordinal logistic regression models with a cumulative logit link function was employed. Models were tested to meet the assumption of proportional odds. When the assumption was violated, we used the unequal slopes option where the model assumes separate slopes for each level of the outcome.
Data analysis
The COVID and control populations were profiled and tabulated. The subsample of patients with the multiplex arrays were profiled and tabulated and statistical tests were conducted to determine group differences (C+A+, C-A+, C-A-). Hamsters were randomly assigned to virus-infected or mock-control groups. Experiments were conducted in batches of 3 hamsters per group, they were not blinded and no power calculations were done. No animals or samples were excluded. Fisher’s exact test and chi-squared test were used to test association of categorical variables, odds ratios were used to determine the strength of the association. Continuous data was tested for normality (Shapiro-Wilk). Normally distributed data were compared using Welch’s t-test, otherwise non parametric tests were used (Kruskal-Wallis test and Mann-Whitney test). The statistical tests used for each Figure are provided in the legends. Two-sided P-values smaller than 0.05 were considered significant unless indicated otherwise in the Figure legend. The Bonferroni-Holm method was used to correct for multiple comparisons. Replicate numbers are provided in the Figure legends. Plots were generated using Graphpad Prism 9. Statistical analyses were performed with R 4.0.3/RStudio 1.4.1103 or with Graphpad Prism 9.
Acknowledgments
This work was supported by the following grants: NIH R01 DK121140 (J.C.L.), R01 DK121844 (J.C.L.), R01 CA234614 (R.E.S), 2R01 AI107301 (R.E.S), R01 DK121072 (R.E.S), and R01 CA215797 (K.A.B.). R.E.S. and J.C.L. are supported as Irma Hirschl Trust Research Award Scholars. In addition, this study received support from New York-Presbyterian Hospital (NYPH) and Weill Cornell Medical College (WCMC), including the Clinical and Translational Science Center (CTSC) (UL1 TR 0002384). The graphical abstract was created with BioRender.com. We would like to thank Carlos Franco and Lenny Martinez, supervisors of the ISMMS animal facility, for all of their help. The views expressed in this manuscript are those of the authors and do not necessarily represent the official views of the National Institute of Diabetes and Digestive and Kidney Diseases or the National Institutes of Health.
Author contributions
M. Reiterer, N.G.-B., V.C., Y.B., L.C., A.R.-N., A.G., L.M., and S.U. performed and analyzed the molecular experiments. M. Rajan, J.D.L., E.T.S., and K.H. processed patient data and performed statistical analyses. L.G.G.-E. and S.A.-M. collected patient samples. P.P. and P.B. prepared the human adipocyte cultures. S.H. and D.R. analyzed RNA-seq data. A.P.S., P.G., B.R.t, K.A.B., L.C.A., R.E.S., E.J.S., and M.M.S. provided scientific input and analyzed the data. M. Reiterer and J.C.L. wrote the manuscript with input from all authors. J.C.L. designed and supervised the study.
Declaration of interests
R.E.S. is on the scientific advisory board of Miromatrix and is a speaker and consultant for Alnylam. The other authors have no competing interests.
Published: September 15, 2021; corrected online: October 26, 2021
Footnotes
Supplemental information can be found online at https://doi.org/10.1016/j.cmet.2021.09.009.
Supplemental information
Data and code availability
-
•
RNA-seq data have been deposited at GEO and are publicly available as of the date of publication. Accession numbers are listed in the key resources table.
-
•
Original western blot images have been deposited at Mendeley and are publicly available as of the date of publication at https://doi.org/10.17632/hvp58h6jc7.1
-
•
This paper does not report original code.
-
•
Any additional information required to reanalyze the data reported in this paper is available from the lead contact upon request. All requests will be reviewed to verify if the request is subject to any intellectual property or confidentiality obligations. Any data and materials that can be shared will be released via a Material Transfer Agreement.
References
- Accili D. Can COVID-19 cause diabetes? Nat. Metab. 2021;3:123–125. doi: 10.1038/s42255-020-00339-7. [DOI] [PMC free article] [PubMed] [Google Scholar]
- Barron E., Bakhai C., Kar P., Weaver A., Bradley D., Ismail H., Knighton P., Holman N., Khunti K., Sattar N., et al. Associations of type 1 and type 2 diabetes with COVID-19-related mortality in England: a whole-population study. Lancet Diabetes Endocrinol. 2020;8:813–822. doi: 10.1016/S2213-8587(20)30272-2. [DOI] [PMC free article] [PubMed] [Google Scholar]
- Carrasco-Sánchez F.J., López-Carmona M.D., Martínez-Marcos F.J., Pérez-Belmonte L.M., Hidalgo-Jiménez A., Buonaiuto V., Suárez Fernández C., Freire Castro S.J., Luordo D., Pesqueira Fontan P.M., et al. Admission hyperglycaemia as a predictor of mortality in patients hospitalized with COVID-19 regardless of diabetes status: data from the Spanish SEMI-COVID-19 Registry. Ann. Med. 2021;53:103–116. doi: 10.1080/07853890.2020.1836566. [DOI] [PMC free article] [PubMed] [Google Scholar]
- Chan J.F.W., Zhang A.J., Yuan S., Poon V.K.-M., Chan C.C.-S., Lee A.C.-Y., Chan W.-M., Fan Z., Tsoi H.-W., Wen L., et al. Simulation of the clinical and pathological manifestations of coronavirus Disease 2019 (COVID-19) in a golden Syrian hamster model: implications for disease pathogenesis and transmissibility. Clin. Infect. Dis. 2020;71:2428–2446. doi: 10.1093/cid/ciaa325. [DOI] [PMC free article] [PubMed] [Google Scholar]
- Coate K.C., Cha J., Shrestha S., Wang W., Gonçalves L.M., Almaça J., Kapp M.E., Fasolino M., Morgan A., Dai C., et al. SARS-CoV-2 cell entry factors ACE2 and TMPRSS2 are expressed in the microvasculature and ducts of human pancreas but are not enriched in β cells. Cell Metab. 2020;32:1028–1040.e4. doi: 10.1016/j.cmet.2020.11.006. [DOI] [PMC free article] [PubMed] [Google Scholar]
- DeFronzo R.A., Ferrannini E., Groop L., Henry R.R., Herman W.H., Holst J.J., Hu F.B., Kahn C.R., Raz I., Shulman G.I., et al. Type 2 diabetes mellitus. Nat. Rev. Dis. Primers. 2015;1:15019. doi: 10.1038/nrdp.2015.19. [DOI] [PubMed] [Google Scholar]
- Docherty A.B., Harrison E.M., Green C.A., Hardwick H.E., Pius R., Norman L., Holden K.A., Read J.M., Dondelinger F., Carson G., et al. Features of 20 133 UK patients in hospital with covid-19 using the ISARIC WHO Clinical Characterisation Protocol: prospective observational cohort study. BMJ. 2020;369:m1985. doi: 10.1136/bmj.m1985. [DOI] [PMC free article] [PubMed] [Google Scholar]
- Drucker D.J. Diabetes, obesity, metabolism, and SARS-CoV-2 infection: the end of the beginning. Cell Metab. 2021;33:479–498. doi: 10.1016/j.cmet.2021.01.016. [DOI] [PMC free article] [PubMed] [Google Scholar]
- Durinck S., Moreau Y., Kasprzyk A., Davis S., De Moor B., Brazma A., Huber W. BioMart and Bioconductor: a powerful link between biological databases and microarray data analysis. Bioinformatics. 2005;21:3439–3440. doi: 10.1093/bioinformatics/bti525. [DOI] [PubMed] [Google Scholar]
- Durinck S., Spellman P.T., Birney E., Huber W. Mapping identifiers for the integration of genomic datasets with the R/ Bioconductor package biomaRt. Nat. Protoc. 2009;4:1184–1191. doi: 10.1038/nprot.2009.97. [DOI] [PMC free article] [PubMed] [Google Scholar]
- Emms D.M., Kelly S. OrthoFinder: phylogenetic orthology inference for comparative genomics. Genome Biol. 2019;20:238. doi: 10.1186/s13059-019-1832-y. [DOI] [PMC free article] [PubMed] [Google Scholar]
- Finkelsztein E.J., Jones D.S., Ma K.C., Pabón M.A., Delgado T., Nakahira K., Arbo J.E., Berlin D.A., Schenck E.J., Choi A.M.K., Seimpos I.I. Comparison of qSOFA and SIRS for predicting adverse outcomes of patients with suspicion of sepsis outside the intensive care unit. Crit. Care. 2017;21:73. doi: 10.1186/s13054-017-1658-5. [DOI] [PMC free article] [PubMed] [Google Scholar]
- Frühbeck G., Catalán V., Rodríguez A., Ramírez B., Becerril S., Salvador J., Colina I., Gómez-Ambrosi J. Adiponectin-leptin ratio is a functional biomarker of adipose tissue inflammation. Nutrients. 2019;11:454. doi: 10.3390/nu11020454. [DOI] [PMC free article] [PubMed] [Google Scholar]
- Gómez-Banoy N., Lo J.C. Adipokines as key players in β cell function and failure. Clin. Sci. (Lond) 2019;133:2317–2327. doi: 10.1042/CS20190523. [DOI] [PubMed] [Google Scholar]
- Gómez-Banoy N., Guseh J.S., Li G., Rubio-Navarro A., Chen T., Poirier B.A., Putzel G., Rosselot C., Pabón M.A., Camporez J.P., et al. Adipsin preserves beta cells in diabetic mice and associates with protection from type 2 diabetes in humans. Nat. Med. 2019;25:1739–1747. doi: 10.1038/s41591-019-0610-4. [DOI] [PMC free article] [PubMed] [Google Scholar]
- Goyal P., Ringel J.B., Rajan M., Choi J.J., Pinheiro L.C., Li H.A., Wehmeyer G.T., Alshak M.N., Jabri A., Schenck E.J., et al. Obesity and COVID-19 in New York City: a retrospective cohort study. Ann. Intern. Med. 2020;173:855–858. doi: 10.7326/M20-2730. [DOI] [PMC free article] [PubMed] [Google Scholar]
- Goyal P., Choi J.J., Pinheiro L.C., Schenck E.J., Chen R., Jabri A., Satlin M.J., Campion T.R., Nahid M., Ringel J.B., et al. Clinical characteristics of Covid-19 in New York City. N. Engl. J. Med. 2020;382:2372–2374. doi: 10.1056/NEJMc2010419. [DOI] [PMC free article] [PubMed] [Google Scholar]
- Gupta A., Madhavan M.V., Sehgal K., Nair N., Mahajan S., Sehrawat T.S., Bikdeli B., Ahluwalia N., Ausiello J.C., Wan E.Y., et al. Extrapulmonary manifestations of COVID-19. Nat. Med. 2020;26:1017–1032. doi: 10.1038/s41591-020-0968-3. [DOI] [PMC free article] [PubMed] [Google Scholar]
- Harris P.A., Taylor R., Thielke R., Payne J., Gonzalez N., Conde J.G. Research Electronic Data Capture (REDCap)—a metadata-driven methodology and workflow process for providing translational research informatics support. J. Biomed. Inform. 2009;42:377–381. doi: 10.1016/j.jbi.2008.08.010. [DOI] [PMC free article] [PubMed] [Google Scholar]
- Hollstein T., Schulte D.M., Schulz J., Glück A., Ziegler A.G., Bonifacio E., Wendorff M., Franke A., Schreiber S., Bornstein S.R., Matthias M. Autoantibody-negative insulin-dependent diabetes mellitus after SARS-CoV-2 infection: a case report. Nat. Metab. 2020;2:1021–1024. doi: 10.1038/s42255-020-00281-8. [DOI] [PubMed] [Google Scholar]
- Holman N., Knighton P., Kar P., O’Keefe J., Curley M., Weaver A., Barron E., Bakhai C., Khunti K., Wareham N.J., et al. Risk factors for COVID-19-related mortality in people with type 1 and type 2 diabetes in England: a population-based cohort study. Lancet Diabetes Endocrinol. 2020;8:823–833. doi: 10.1016/S2213-8587(20)30271-0. [DOI] [PMC free article] [PubMed] [Google Scholar]
- Horby P., Lim W.S., Emberson J.R., Mafham M., Bell J.L., Linsell L., Staplin N., Brightling C., Ustianowski A., et al. RECOVERY Collaborative Group Dexamethasone in hospitalized patients with Covid-19. N. Engl. J. Med. 2021;384:693–704. doi: 10.1056/NEJMoa2021436. [DOI] [PMC free article] [PubMed] [Google Scholar]
- Huang D.T., Angus D.C., Moss M., Thompson B.T., Ferguson N.D., Ginde A., Gong M.N., Gundel S., Hayden D.L., Hite R.D., et al. Reevaluation of Systemic Early Neuromuscular Blockade Protocol Committee and the National Institutes of Health National Heart, Lung, and Blood Institute Prevention and Early Treatment of Acute Lung Injury Network Investigators Design and rationale of the Reevaluation of Systemic Early Neuromuscular Blockade Trial for Acute Respiratory Distress Syndrome. Ann. Am. Thorac. Soc. 2017;14:124–133. doi: 10.1513/AnnalsATS.201608-629OT. [DOI] [PMC free article] [PubMed] [Google Scholar]
- Jureka A.S., Silvas J.A., Basler C.F. Propagation, inactivation, and safety testing of SARS-CoV-2. Viruses. 2020;12:622. doi: 10.3390/v12060622. [DOI] [PMC free article] [PubMed] [Google Scholar]
- Kusmartseva I., Wu W., Syed F., Van Der Heide V., Jorgensen M., Joseph P., Tang X., Candelario-Jalil E., Yang C., Nick H., et al. Expression of SARS-CoV-2 entry factors in the pancreas of normal organ donors and individuals with COVID-19. Cell Metab. 2020;32:1041–1051.e6. doi: 10.1016/j.cmet.2020.11.005. [DOI] [PMC free article] [PubMed] [Google Scholar]
- Lee E.Y., Hwang S., Lee S.H., Lee Y.-H., Choi A.R., Lee Y., Lee B.-W., Kang E.S., Ahn C.W., Cha B.S., Lee H.C. Postprandial C-peptide to glucose ratio as a predictor of β-cell function and its usefulness for staged management of type 2 diabetes. J. Diabetes Investig. 2014;5:517–524. doi: 10.1111/jdi.12187. [DOI] [PMC free article] [PubMed] [Google Scholar]
- Liao Y., Wang J., Jaehnig E.J., Shi Z., Zhang B. WebGestalt 2019: gene set analysis toolkit with revamped UIs and APIs. Nucleic Acids Res. 2019;47:W199–W205. doi: 10.1093/nar/gkz401. [DOI] [PMC free article] [PubMed] [Google Scholar]
- Lim S., Bae J.H., Kwon H.-S., Nauck M.A. COVID-19 and diabetes mellitus: from pathophysiology to clinical management. Nat. Rev. Endocrinol. 2021;17:11–30. doi: 10.1038/s41574-020-00435-4. [DOI] [PMC free article] [PubMed] [Google Scholar]
- Lockhart S.M., O’Rahilly S. When two pandemics meet: why is obesity associated with increased COVID-19 mortality? Med (NY) 2020;1:33–42. doi: 10.1016/j.medj.2020.06.005. [DOI] [PMC free article] [PubMed] [Google Scholar]
- Magleby R., Westblade L.F., Trzebucki A., Simon M.S., Rajan M., Park J., Goyal P., Safford M.M., Satlin M.J. Impact of SARS-CoV-2 viral load on risk of intubation and mortality among hospitalized patients with Coronavirus disease 2019. Clin. Infect. Dis. 2020 doi: 10.1093/cid/ciaa851. Published online June 30, 2020. [DOI] [PMC free article] [PubMed] [Google Scholar]
- McGurnaghan S.J., Weir A., Bishop J., Kennedy S., Blackbourn L.A.K., McAllister D.A., Hutchinson S., Caparrotta T.M., Mellor J., Jeyam A., et al. Risks of and risk factors for COVID-19 disease in people with diabetes: a cohort study of the total population of Scotland. Lancet Diabetes Endocrinol. 2021;9:82–93. doi: 10.1016/S2213-8587(20)30405-8. [DOI] [PMC free article] [PubMed] [Google Scholar]
- Montagutelli X., Prot M., Levillayer L., Salazar E.B., Jouvion G., Conquet L., Donati F., Albert M., Gambaro F., Behillil S., et al. The B1.351 and P.1 variants extend SARS-CoV-2 host range to mice. bioRxiv. 2021 doi: 10.1101/2021.03.18.436013. [DOI] [Google Scholar]
- Montefusco L., Ben Nasr M., D’Addio F., Loretelli C., Rossi A., Pastore I., Daniele G., Abdelsalam A., Maestroni A., Dell’Acqua M., et al. Acute and long-term disruption of glycometabolic control after SARS-CoV-2 infection. Nat. Metab. 2021;3:774–785. doi: 10.1038/s42255-021-00407-6. [DOI] [PMC free article] [PubMed] [Google Scholar]
- Moss M., Huang D.T., Brower R.G., Ferguson N.D., Ginde A.A., Gong M.N., Grissom C.K., Gundel S., Hayden D., Hite R.D., et al. National Heart. Lung. and Blood Institute PETAL Clinical Trials Network Early neuromuscular blockade in the acute respiratory distress syndrome. N. Engl. J. Med. 2019;380:1997–2008. doi: 10.1056/NEJMoa1901686. [DOI] [PMC free article] [PubMed] [Google Scholar]
- Müller J.A., Groß R., Conzelmann C., Krüger J., Merle U., Steinhart J., Weil T., Koepke L., Bozzo C.P., Read C., et al. SARS-CoV-2 infects and replicates in cells of the human endocrine and exocrine pancreas. Nat. Metab. 2021;3:149–165. doi: 10.1038/s42255-021-00347-1. [DOI] [PubMed] [Google Scholar]
- Puelles V.G., Lütgehetmann M., Lindenmeyer M.T., Sperhake J.P., Wong M.N., Allweiss L., Chilla S., Heinemann A., Wanner N., Liu S., et al. Multiorgan and renal tropism of SARS-CoV-2. N. Engl. J. Med. 2020;383:590–592. doi: 10.1056/NEJMc2011400. [DOI] [PMC free article] [PubMed] [Google Scholar]
- Ranieri V.M., Rubenfeld G.D., Thompson B.T., Ferguson N.D., Caldwell E., Fan E., Camporota L., Slutsky A.S., ARDS Definition Task Force Acute respiratory distress syndrome. the Berlin Definition. JAMA. 2012;307:2526–2533. doi: 10.1001/jama.2012.5669. [DOI] [PubMed] [Google Scholar]
- Robinson M.D., McCarthy D.J., Smyth G.K. edgeR: a Bioconductor package for differential expression analysis of digital gene expression data. Bioinformatics. 2010;26:139–140. doi: 10.1093/bioinformatics/btp616. [DOI] [PMC free article] [PubMed] [Google Scholar]
- Saisho Y. Postprandial C-peptide to glucose ratio as a marker of β cell function: implication for the management of type 2 diabetes. Int. J. Mol. Sci. 2016;17:744. doi: 10.3390/ijms17050744. [DOI] [PMC free article] [PubMed] [Google Scholar]
- Saisho Y., Kou K., Tanaka K., Abe T., Kurosawa H., Shimada A., Meguro S., Kawai T., Itoh H. Postprandial serum C-peptide to plasma glucose ratio as a predictor of subsequent insulin treatment in patients with type 2 diabetes. Endocr. J. 2011;58:315–322. doi: 10.1507/endocrj.k10e-399. [DOI] [PubMed] [Google Scholar]
- Schenck E.J., Hoffman K.L., Cusick M., Kabariti J., Sholle E.T., Campion T.R. Critical carE Database for Advanced Research (CEDAR): an automated method to support intensive care units with electronic health record data. J. Biomed. Inform. 2021;118:103789. doi: 10.1016/j.jbi.2021.103789. [DOI] [PMC free article] [PubMed] [Google Scholar]
- Schenck E.J., Hoffman K., Oromendia C., Sanchez E., Finkelsztein E.J., Hong K.S., Kabariti J., Torres L.K., Harrington J.S., Siempos I.I., et al. A comparative analysis of the respiratory subscore of the sequential organ failure assessment scoring system. Ann. Am. Thorac. Soc. 2021 doi: 10.1513/AnnalsATS.202004-399OC. Published online March 24, 2021. [DOI] [PMC free article] [PubMed] [Google Scholar]
- Sholle E.T., Kabariti J., Johnson S.B., Leonard J.P., Pathak J., Varughese V.I., Cole C.L., Campion T.R. Secondary use of patients’ electronic records (SUPER): an approach for meeting specific data needs of clinical and translational researchers. AMIA Annu. Symp. Proc. 2017;2017:1581–1588. [PMC free article] [PubMed] [Google Scholar]
- Sia S.F., Yan L.-M., Chin A.W.H., Fung K., Choy K.-T., Wong A.Y.L., Kaewpreedee P., Perera R.A.P.M., Poon L.L.M., Nicholls J.M., et al. Pathogenesis and transmission of SARS-CoV-2 in golden hamsters. Nature. 2020;583:834–838. doi: 10.1038/s41586-020-2342-5. [DOI] [PMC free article] [PubMed] [Google Scholar]
- Siempos I.I., Ma K.C., Imamura M., Baron R.M., Fredenburgh L.E., Huh J.-W., Moon J.-S., Finkelsztein E.J., Jones D.S., Lizardi M.T., et al. RIPK3 mediates pathogenesis of experimental ventilator-induced lung injury. JCI Insight. 2018;3:e97102. doi: 10.1172/jci.insight.97102. [DOI] [PMC free article] [PubMed] [Google Scholar]
- Singer M., Deutschman C.S., Seymour C.W., Shankar-Hari M., Annane D., Bauer M., Bellomo R., Bernard G.R., Chiche J.D., Coopersmith C.M., et al. The third international consensus definitions for sepsis and septic shock (sepsis-3) JAMA. 2016;315:801–810. doi: 10.1001/jama.2016.0287. [DOI] [PMC free article] [PubMed] [Google Scholar]
- Smith S.M., Boppana A., Traupman J.A., Unson E., Maddock D.A., Chao K., Dobesh D.P., Brufsky A., Connor R.I. Impaired glucose metabolism in patients with diabetes, prediabetes, and obesity is associated with severe COVID-19. J. Med. Virol. 2021;93:409–415. doi: 10.1002/jmv.26227. [DOI] [PMC free article] [PubMed] [Google Scholar]
- Sterne J.A.C., Murthy S., Diaz J.V., Slutsky A.S., Villar J., Angus D.C., Annane D., Azevedo L.C.P., Berwanger O., et al. WHO Rapid Evidence Appraisal for COVID-19 Therapies (REACT) Working Group Association between administration of systemic corticosteroids and mortality among critically ill patients with COVID-19: a meta-analysis. JAMA. 2020;324:1330–1341. doi: 10.1001/jama.2020.17023. [DOI] [PMC free article] [PubMed] [Google Scholar]
- Sureshbabu A., Patino E., Ma K.C., Laursen K., Finkelsztein E.J., Akchurin O., Muthukumar T., Ryter S.W., Gudas L., Choi A.M.K., Choi M.E. RIPK3 promotes sepsis-induced acute kidney injury via mitochondrial dysfunction. JCI Insight. 2018;3:e98411. doi: 10.1172/jci.insight.98411. [DOI] [PMC free article] [PubMed] [Google Scholar]
- Tamez-Pérez H.E., Quintanilla-Flores D.L., Rodríguez-Gutiérrez R., González-González J.G., Tamez-Peña A.L. Steroid hyperglycemia: prevalence, early detection and therapeutic recommendations: a narrative review. World J. Diabetes. 2015;6:1073–1081. doi: 10.4239/wjd.v6.i8.1073. [DOI] [PMC free article] [PubMed] [Google Scholar]
- Tan P., Pepin É., Lavoie J.L. Mouse adipose tissue collection and processing for RNA analysis. J. Vis. Exp. 2018;131:57026. doi: 10.3791/57026. [DOI] [PMC free article] [PubMed] [Google Scholar]
- Tang X., Uhl S., Zhang T., Xue D., Li B., Vandana J.J., Acklin J.A., Bonnycastle L.L., Narisu N., Erdos M.R., et al. SARS-CoV-2 infection induces beta cell transdifferentiation. Cell Metab. 2021;33:1577–1591.e7. doi: 10.1016/j.cmet.2021.05.015. [DOI] [PMC free article] [PubMed] [Google Scholar]
- Wang S., Ma P., Zhang S., Song S., Wang Z., Ma Y., Xu J., Wu F., Duan L., Yin Z., et al. Fasting blood glucose at admission is an independent predictor for 28-day mortality in patients with COVID-19 without previous diagnosis of diabetes: a multi-centre retrospective study. Diabetologia. 2020;63:2102–2111. doi: 10.1007/s00125-020-05209-1. [DOI] [PMC free article] [PubMed] [Google Scholar]
- Williamson E.J., Walker A.J., Bhaskaran K., Bacon S., Bates C., Morton C.E., Curtis H.J., Mehrkar A., Evans D., Inglesby P., et al. Factors associated with COVID-19-related death using OpenSAFELY. Nature. 2020;584:430–436. doi: 10.1038/s41586-020-2521-4. [DOI] [PMC free article] [PubMed] [Google Scholar]
- Wu C.-T., Lidsky P.V., Xiao Y., Lee I.T., Cheng R., Nakayama T., Jiang S., Demeter J., Bevacqua R.J., Chang C.A., et al. SARS-CoV-2 infects human pancreatic β cells and elicits β cell impairment. Cell Metab. 2021;33:1565–1576.e5. doi: 10.1016/j.cmet.2021.05.013. [DOI] [PMC free article] [PubMed] [Google Scholar]
- Yang L., Han Y., Nilsson-Payant B.E., Gupta V., Wang P., Duan X., Tang X., Zhu J., Zhao Z., Jaffré F., et al. A human pluripotent stem cell-based platform to study SARS-CoV-2 tropism and model virus infection in human cells and organoids. Cell Stem Cell. 2020;27:125–136.e7. doi: 10.1016/j.stem.2020.06.015. [DOI] [PMC free article] [PubMed] [Google Scholar]
- Yang W., Kandula S., Huynh M., Greene S.K., Van Wye G., Li W., Chan H.T., McGibbon E., Yeung A., Olson D., et al. Estimating the infection-fatality risk of SARS-CoV-2 in New York City during the spring 2020 pandemic wave: a model-based analysis. Lancet Infect. Dis. 2021;21:203–212. doi: 10.1016/S1473-3099(20)30769-6. [DOI] [PMC free article] [PubMed] [Google Scholar]
- Yao W., Ma D., Wang H., Tang X., Du C., Pan H., Li C., Lin H., Farzan M., Zhao J., et al. Effect of SARS-CoV-2 spike mutations on animal ACE2 usage and in vitro neutralization sensitivity. bioRxiv. 2021 doi: 10.1101/2021.01.27.428353. [DOI] [Google Scholar]
- Yu B., Li C., Sun Y., Wang D.W. Insulin treatment is associated with increased mortality in patients with COVID-19 and type 2 diabetes. Cell Metab. 2021;33:65–77.e2. doi: 10.1016/j.cmet.2020.11.014. [DOI] [PMC free article] [PubMed] [Google Scholar]
- Zhou F., Yu T., Du R., Fan G., Liu Y., Liu Z., Xiang J., Wang Y., Song B., Gu X., et al. Clinical course and risk factors for mortality of adult inpatients with COVID-19 in Wuhan, China: a retrospective cohort study. Lancet. 2020;395:1054–1062. doi: 10.1016/S0140-6736(20)30566-3. [DOI] [PMC free article] [PubMed] [Google Scholar]
- Zhu L., She Z.-G., Cheng X., Qin J.-J., Zhang X.-J., Cai J., Lei F., Wang H., Xie J., Wang W., et al. Association of blood glucose control and outcomes in patients with COVID-19 and pre-existing type 2 diabetes. Cell Metab. 2020;31:1068–1077.e3. doi: 10.1016/j.cmet.2020.04.021. [DOI] [PMC free article] [PubMed] [Google Scholar]
- Zuo Y., Warnock M., Harbaugh A., Yalavarthi S., Gockman K., Zuo M., Madison J.A., Knight J.S., Kanthi Y., Lawrence D.A. Plasma tissue plasminogen activator and plasminogen activator inhibitor-1 in hospitalized COVID-19 patients. Sci. Rep. 2021;11:1580. doi: 10.1038/s41598-020-80010-z. [DOI] [PMC free article] [PubMed] [Google Scholar]
Associated Data
This section collects any data citations, data availability statements, or supplementary materials included in this article.
Supplementary Materials
Data Availability Statement
-
•
RNA-seq data have been deposited at GEO and are publicly available as of the date of publication. Accession numbers are listed in the key resources table.
-
•
Original western blot images have been deposited at Mendeley and are publicly available as of the date of publication at https://doi.org/10.17632/hvp58h6jc7.1
-
•
This paper does not report original code.
-
•
Any additional information required to reanalyze the data reported in this paper is available from the lead contact upon request. All requests will be reviewed to verify if the request is subject to any intellectual property or confidentiality obligations. Any data and materials that can be shared will be released via a Material Transfer Agreement.