

Abstract
Recent observations indicate that cerebral white matter (WM) exhibits a higher chemoattractant capability for immune cells. The C-C motif chemokine ligands 2 and 3 (CCL2, CCL3) are key chemokines for monocytes and T cells. However, tissue differential of these chemokines is unclear, although the higher CCL2/3 mRNA levels were found in rodent WM. It has been shown that more immune cells infiltrated to WM than to grey matter (GM) in multiple sclerosis (MS) and human/simian immunodeficiency virus (HIV/SIV)-infected brains. More nodular lesions have also been identified in the WM of patients with MS or HIV/SIV encephalitis. We hypothesize that higher levels of CCL2/3 in the WM may associate with neuropathogenesis. To test this hypothesis, we compared CCL2 and CCL3 peptide levels in WM and GM of rat and human, and found both were significantly higher in the WM. Next, we tested the effect of CCL2 on primary rat microglia migration and observed a dose-dependent migratory pattern. Then, we assessed effects of WM and GM homogenates on microglia chemotaxis and observed significant stronger effects of WM than GM in a concentration-dependent manner. The concentration-dependent pattern of tissue homogenates on chemotaxis was similar to the effect of CCL2. Finally, we found the chemoattractant effects of WM on microglia were significantly attenuated by addition of a CCL2 receptor blocker to culture medium and a neutralizing antibody against CCL3 functional motif in the WM homogenate. Taking together, these results suggest that CCL2/3 played significant roles in the microglia chemotaxis toward WM homogenate.
Keywords: CCL2 and 3 protein levels, chemoattractant capability, microglia, white matter
1 |. INTRODUCTION
It is well-known that animal species in higher taxonomic ranks have a larger portion of cerebral white matter (WM) in proportion to grey matter (GM) in the brain. In human, the WM within both hemispheres, composed of concentrated myelinated axonal fibers, occupies about 60% of brain volume (Bailey et al., 2009). Increasing evidence indicates that the WM plays significant and pivotal roles in the brain based on the findings that its abnormalities are associated with a variety of neurological disorders (Bae et al., 2020; Filley & Fields, 2016; Sampaio-Baptista & Johansen-Berg, 2017). Thus, research into the mechanisms underlying the WM-associated neuropathogenesis is imperative.
Recent studies have shown that many immune molecules are widely expressed and functional in the brain. Cross talk between microglia and oligodendrocytes occurs and disturbance in this communication resulted from infections has been demonstrated to trigger microglia activation and augment neurodegeneration (Alakkas et al., 2019; Jensen et al., 2019; Nutma et al., 2019). Studies in aged rodents have also shown that microglia phenotype, reflected by expression of different CDs (cluster of differentiation) on the plasma membrane, in the WM is significantly different from that in the GM (Hart et al., 2012; Perry et al., 1993). Moreover, the expression levels of some chemokines may differ between WM and GM (Janssen et al., 2016; Prins et al., 2014), implying a different chemoattractant ability of the WM from that of the GM. The β-chemokines, such as CCL2 and CCL3, also known, respectively, as monocyte chemotactic protein-1 and macrophage inflammatory protein-1α, are key chemokines to guide immune cell migration in brain development and inflammatory responses (Melik-Parsadaniantz & Rostene, 2008). Of note, a previous study revealed elevated levels of CCL2 and CCL3 mRNA in corpus callosum (CC) compared to cortex in normal mice (Buschmann et al., 2012).
Coincidently, we recently observed in simian immunodeficiency virus (SIV)-infected brain that the number of perivascular macrophage cuffing (PC)—cells therein probably derived from infiltrated monocytes—in WM was significantly higher than in GM (Zhang et al., 2019). On the other hand, robust T-cell infiltration in WM of multiple sclerosis (MS) cases (Zephir, 2018) suggested a higher chemoattractant power of WM on T cells as well. However, molecular mechanisms for the WM to recruit more monocytes and lymphocytes to the region were unclear in these studies. We hypothesize that the WM may express higher levels of some chemokines, such as CCL2 and CCL3 (Buschmann et al., 2012), contributing to its stronger chemoattractant ability. Nevertheless, there is, to our knowledge, no published data on CCL2 and CCL3 peptide concentrations in normal GM and WM in human or rat brain. In addition to CCL2 and CCL3, CX3CL1 (also known as fractalkine) is another important chemokine in the brain. It is produced primarily by neurons with its receptor CX3CR1 expressed exclusively in microglia (Harrison et al., 1998; Nishiyori et al., 1998). The CX3CL1/CX3CR1 axis is involved in the WM tract demyelization process after ischemia (Wu et al., 2016).
Apart from higher number of PC in the WM, we also observed nodular lesions formed by microglia nodules (MN) that were more prevalent in the WM than in the GM of the SIV-infected brain (Zhang et al., 2019), suggesting involvement of microglia in virus-induced WM injury as reported by many other studies (Borrajo et al., 2021; Wallet et al., 2019). The formation of MN in normal appearing WM was also observed in early stage of MS, which occurred before T-cell infiltration (Singh et al., 2013). The mechanism for aggregation of microglia to form MN in MS or SIV encephalitis is unknown, but β-chemokines may play a role (Dhillon et al., 2008; Prins et al., 2014). Effects of CCL2 and CCL3 on migration of monocytes and lymphocytes have been verified by using chemotaxis assay (Carr et al., 1994; Gu et al., 1997), and their effects on microglia relocation were reflected by several in vitro or in vivo studies (Cho et al., 2013; He et al., 2016). As there are not only more infiltrated monocytes and T cells but also more microglia nodules formed in WM of the MS and SIV-infected brain as aforementioned, the differential effects of CCL2/3 on aggregation of microglia in WM vs. GM are unclear. To this end, we attempted in this study to: (a) examine and compare the CCL2, CCL3, and CX3CL1 peptides in rat and human WM and GM, with Western blot and ELISA (enzyme-linked immunosorbent assay); (b) verify the effect of CCL2 on microglia migration by using chemotaxis assay; (c) elucidate the chemoattractant effects of WM and GM tissue homogenates on microglia chemotaxis in vitro; and 4) examine effects of CCL2/3 receptor antagonists and neutralizing antibody against CCL3 on WM homogenate-mediated microglia chemotaxis.
2 |. MATERIAL AND METHODS
2.1 |. Animals
Adult Sprague–Dawley rats (40- to 50-d-old; 8 males and 15 females) from Charles River Laboratories were used in generating tissue homogenates for Western blot, ELISA and Chemotaxis Assay. Ten pregnant female rats (Charles River) produced neonatal pups for primary microglia culture. All experimental protocols and animal care were carried out in accordance with the National Institutes of Health Guide for the Care of Laboratory Animals in Research and approved by the Institutional Animal Care and Use Committee of the University of Nebraska Medical Center, and by Shanghai Children’s Medical Center as well. All efforts were made to minimize animal suffering and the number of animals used in this study.
2.2 |. Human brain tissues
Human brain tissues used in this study were from the Tissue Cell Core Facility in University of Nebraska Medical Center, and the National NeuroAIDS Tissue Consortium (NNTC). Table 1 summarized brain tissues used for Western blot. The use of human brain tissues for this study was reviewed and approved by Institutional Review Board at the University of Nebraska Medical Center (IRB # 009-00-FB). All brain tissues were rapidly frozen and stored at −80°C before using.
TABLE 1.
Human brain tissues information
| TCCF# | Diagnosis | Race | Age | Gender | PMI | Short pathology description on brain |
|---|---|---|---|---|---|---|
| 02–126 | Pulmonary disease | C | 62 | M | 3.5h | No diagnostic abnormality |
| 03–114 | Heart attack | C | 61 | M | 5.5 hr | Brain appears normal |
| 03–115 | Hepatic failure | C | 64 | M | 3.3 hr | Appears normal, glial cell activation? |
| NNTC # Mhb559 | Auto Accident | C | 44 | M | 4h | Brain appears normal |
Abbreviations: C, Caucasian; M, Male; PMI, Postmortem interval.
2.3 |. Western blot and ELISA
Coronal brain slices (500 µm in thickness) containing the CC were prepared from rats anesthetized with isoflurane, using a NVSLM1 vibro-slicer (WPI). The CC tissues and equivalent cortex GM were dissected from the slices in ice-cold (4°C) and oxygenated artificial cerebrospinal fluid (ACSF) under an anatomic dissection microscope and quickly transferred into Tissue Extraction Reagent 1 (TER; FNN0071, Invitrogen) with 1:1,000 protease inhibitor (P-2714, Sigma) in a ratio of about 0.2 g tissue/2 ml TER (1:10). Also, the similar amount of GM and WM tissues was taken from frozen human brain slices and immediately moved into the cold TER, in the same Tissue/TER ratio.
The rat or human GM and WM tissues were homogenized, and proteins concentrations were measured by bicinchoninic acid assay. The supernatant was subjected to 10%–12% sodium dodecyl sulfate-polyamide gel electrophoresis. Then, the protein was transferred to a polyvinylidene difluoride membrane. The membranes were blocked with 5% non-fat milk and incubated with mouse anti-CCL2 (1:300; clone 2D8, Millipore), rabbit anti-CCL3 (1:800; PA1–28867, Invitrogen), and rabbit anti-CX3CL1 (1:500; Ab25088, Abcam), respectively, followed by HRP-conjugated secondary antibody (1:5,000; Jackson Immuno. Inc.). Mouse anti-β-actin (1:10,000; Sigma) was used for control, and band densities were analyzed by Image J (NIH).
ELISA was performed by using Rat CCL2 ELISA Kit (Thermo Scientific), and peptides concentration in GM and WM homogenates was measured following manufacturer’s instruction. In addition, CCL2 concentration in whole homogenate (100%), 10%, and 1% of supernatant was also measured by using Rat JE/MCP-1/CCL2 DuoSet Kit (R&D System, Bio-Techne China Co. Ltd), following the manufacturer’s manual.
2.4 |. Chemotaxis assay
2.4.1 |. Preparation of primary microglia cultures
Primary microglial cells were prepared from cerebral cortices of 1- to 2-d-old neonatal Sprague–Dawley rats (Charles River Laboratories). The cortical tissues were dissected in cold Hanks’ Balanced Salt solution (Gibco) and digested with 0.25% trypsin (Invitrogen). Isolated cells were suspended under different culture conditions to differentiate into neurons or microglia. For microglia differentiation, isolated cells (30 × 106) were plated into T75 cm2 flasks in high-glucose Dulbecco’s modified Eagle’s medium (Life Technologies) supplemented with 10% fetal bovine serum, 2 mM glutamine, 1% penicillin/streptomycin, and 1 µg/ml macrophage colony-stimulating factor. After 10 days in culture, flasks were gently shaken to detach microglial cells to culture medium. The culture medium was then plated in a fresh T75 flask for 30 min at 37°C. The suspensory glial cells were then removed via changing culture medium. The purity of microglial cells was >98% as determined by staining with OX-42 antibody (Serotec, Oxford, UK), a marker for microglia CR3/CD11b receptors.
2.4.2 |. Microglia migration assay using gradient concentrations of CCL2 as chemoattractant
The assay was performed by using 8-µm-pore 24-well trans-well insert (with 0.47 cm2 culture area in each well) with a polyethylene terephthalate track-etched membrane (BD Bioscience). Each insert membrane was coated with 10 µg/ml of fibronectin (Sigma). Microglia were placed onto upper chamber of the inserts at density of 1.88 × 10⁵ cells per insert (4 × 10⁵ cells/cm2) and exposed to 0.1, 1.0, 5.0, 10, 50, and 200 ng/ml CCL2 (R&D Systems) in SF-DMEM (serum-free culture medium) at the bottom chamber. SF-DMEM without CCL2 was used as a negative control. After 18 hr incubation at 37°C, migrated microglia were fixed and stained with HEMA-3 solution (Fisher Scientific). Unmigrated cells were gently removed with a cotton swab. The membrane with migrated cells was cut-off from the insert and mounted on microscope slides. The cells were counted through three randomly selected scope fields (10X) per trans-well, by an author who is blinded to group division.
2.4.3 |. Preparation of GM and WM tissues as chemoattractant
Rat brain slices were prepared the same as described in the above section of Western Blot and ELISA. After the slices were oxygenated and drained blood for 10 min, the equivalent size of CC WM and adjacent cortex GM was dissected free and quickly transferred to ice-cold (4°C) SF-DMEM for homogenizing. The homogenates in SF-DMEM were centrifuged with about 16,000g (generated from 16,000 g by Sorvall LYNX 6000 centrifuge, with a 6 × 94 ml Fixed Angle Rotor, Fisher Scientific), at 4°C for 10 min and the supernatants were collected. The supernatants were then diluted using SF-DMEM to serial concentrations of 0.1%, 1.0%, and 10%, plus undiluted (100%) for chemotaxis assay.
2.4.4 |. Microglia migration assay using GM and WM tissues as chemoattractant
The GM and WM tissue homogenate-associated microglia migration was conducted in the same way as that of CCL2 assay. Similarly, 1.88 × 10⁵ microglia were placed onto the upper chamber of each insert, and was exposed to 0.1%, 1.0%, 10%, and 100% homogenate supernatants in the bottom chamber. SF-DMEM and 50 ng/ml CCL2 were used as negative and positive controls, respectively. The cells crossed trans-well membrane were examined and counted as aforementioned.
2.4.5 |. Chemotaxis assay using 1.0% WM homogenates plus RS102895 or anti-CCL3 antibody
The experiments were carried out in the same way as aforementioned. One percent of WM homogenate was selected as chemoattractant, with SF-DMEM (vehicle) and 1.0% WM homogenate as negative and positive control, respectively. The RS102895 is a CCL2 receptor antagonist (Elmarakby et al., 2007). However, we used CCL3 neutralizing antibody against CCL3 functional motif because CCL3 actively binds to more than one CC chemokine receptors (Menten et al., 2002). The RS-102895 (R 1903, Sigma) was added to cultural medium (SF-DMEM) inside of the insert in final concentration of 1.2 µM. However, anti-CCL3 (PA1–24657, Fisher Thermo Sci) was mixed into 1.0% WM homogenate outside of insert at final concentration of 3 µg/ml. Trans-well was pre-incubated at 37°C for 30 min. Statistical analysis was carried out to make comparison among the vehicle SF-DMEM, the 1.0% WM, the WM plus RS102895, and the RS102895 alone in the SF-DMEM, or among the SF-DMEM, the 1.0% WM, the WM plus anti-CCL3, and the anti-CCL3 alone in the SF-DMEM.
2.5 |. Statistical analyses
Unpaired two-sample t-test was applied for comparisons of CCL2, CCL3, and CX3CL1 protein levels in GM and WM of rats and humans, and for processing rat CCL2 ELISA data as well. One-way ANOVA with Bonferroni’ post-comparison of selected pair of columns was used to compare chemoattractant capability of GM with WM, to compare chemoattractant effects among WM, WM plus RS102895, and RS102895 alone, or among WM, WM plus anti-CCL3, and anti-CCL3 alone. Welch’s ANOVA and Dunnett’ post-test by comparison of all columns against control was applied in the assay using different dose of CCL2. Statistical analysis was processed with SAS 9.4 (SAS Institute Inc.) and Graph Pad Prism 5 (Graph Pad Software Inc.). Relevant F and df (degree of freedom) values were revealed by SAS and the differences were indicated as p < 0.05, 0.01, and 0.001 in both SAS and Prism, designated by *, **, and ***, respectively.
3 |. RESULTS
3.1 |. Differential CCL2, CCL3, and CX3CL1 protein levels in GM and WM
CCL2 protein density in rat’s CC WM was significantly higher than that in adjacent cortex GM (Figure 1a and b, p < 0.01). CCL3 protein level in the CC WM was significantly higher than that in the adjacent cortex GM (Figure 1c and d, p < 0.05). There was no significant difference in CX3CL1 protein levels detected in the WM and the GM (Figure 1e and f).
FIGURE 1.

The CCL2, CCL3, and CX3CL1 peptide levels in CC WM and adjacent cortex GM of normal rat brain. (a and b) Protein density of CCL2 in the WM was significantly higher than that in cortex GM (b, p < 0.01). (c and d) the CCL3 peptide level in the WM was also significantly higher than that in the adjacent GM (d, p < 0.05). (e and f) the CX3CL1 density in the WM was lower compared to that in the cortex GM, but no statistical significance
In human brain without neurological disorder, the CCL2 protein level was significantly higher in the WM than in the GM (Figure 2a and b, p < 0.01). The CCL3 density was also significant higher in the WM than in the GM (Figure 2c and d, p < 0.05). However, CX3CL1 protein density in the GM was higher than that in the WM (Figure 2e and f, p = 0.0724), but the difference was not statistically significant.
FIGURE 2.

The CCL2, CCL3, and CX3CL1 protein levels in brain WM and adjacent GM of neurologically healthy humans (Table 1). (a and b) Protein density of CCL2 in the WM was significantly higher than that in the adjacent GM (b, p < 0.01). (c and d) The CCL3 protein levels in the WM were significantly higher than that in the adjacent GM (d, p < 0.05). (e and f) CX3CL1 peptide levels in the WM were evidently lower in comparison with that in the adjacent GM, and the difference was marginal significant (f, p = 0.0724)
Thermo-Scientific Rat CCL2 ELISA Kit tests showed that CCL2 peptide concentration in WM was significantly higher than that in GM (p < 0.05, Figure 3). R&D Rat JE/CCL2 DuoSet Kit tests revealed the concentrations in both whole WM and 10% homogenates were significantly higher than those in GM (p < 0.01, Figure 3). The measurement of CCL2 in 1% tissue homogenates exhibited a higher concentration in the WM than in the GM (p = 0.0732), but the difference was not statistically significant.
FIGURE 3.

CCL2 peptide concentrations in rat tissue homogenates measured by ELISA. Thermo Scientific Kit test showed CCL2 concentration in 100% WM tissue was significantly higher than that in 100% GM (p < 0.05). R&D System Kit test exhibited that CCL2 in WM of both 100% and 10% homogenates was significantly higher than that in GM tissue (p < 0.01). In 1% tissue homogenates, CCL2 level in WM was higher than that in GM, but the difference was marginal significant (p < 0.0732). Averaged CCL2 concentration in 100%, 10%, and 1% WM homogenate were about 200, 50, and 7 ng/ml, respectively
3.2 |. Verification of chemoattractant effect of CCL2 on microglia
Although CCL2-elicited BV2 microglia migration has been reported by using a different type of assay (Bose et al., 2016), evidence for CCL2-initiated primary cultured microglia migration by well-established chemotaxis assay is still lacking. On the other hand, our ELISA data revealed 100% WM homogenate contained about 200 ng/ml of CCL2. Theoretically, 10% and 1% of homogenate should have about 20 and 2 ng/ml of CCL2, respectively. In our ELISA experiments, the average levels of CCL2 were approximately 50 and 7 ng/ml in 10% and 1% of WM tissue, respectively. In addition, we showed that the chemoattractant effect of CCL2 on primary microglia was dose dependent (Figure 4a), with the strongest from a dose of 5 and 10 ng/ml. We observed a majority of migrated microglia with long and relatively thin pseudopodia (Figures 4b and 6 arrows), and a small number of them showed shorter and thicker pseudopodia, a morphology of reactive type (Figures 4b and 6 arrowheads). There were also some round-shaped ones, probably representing phagocytic phenotype (Figures 4b and 6 opened arrowheads).
FIGURE 4.
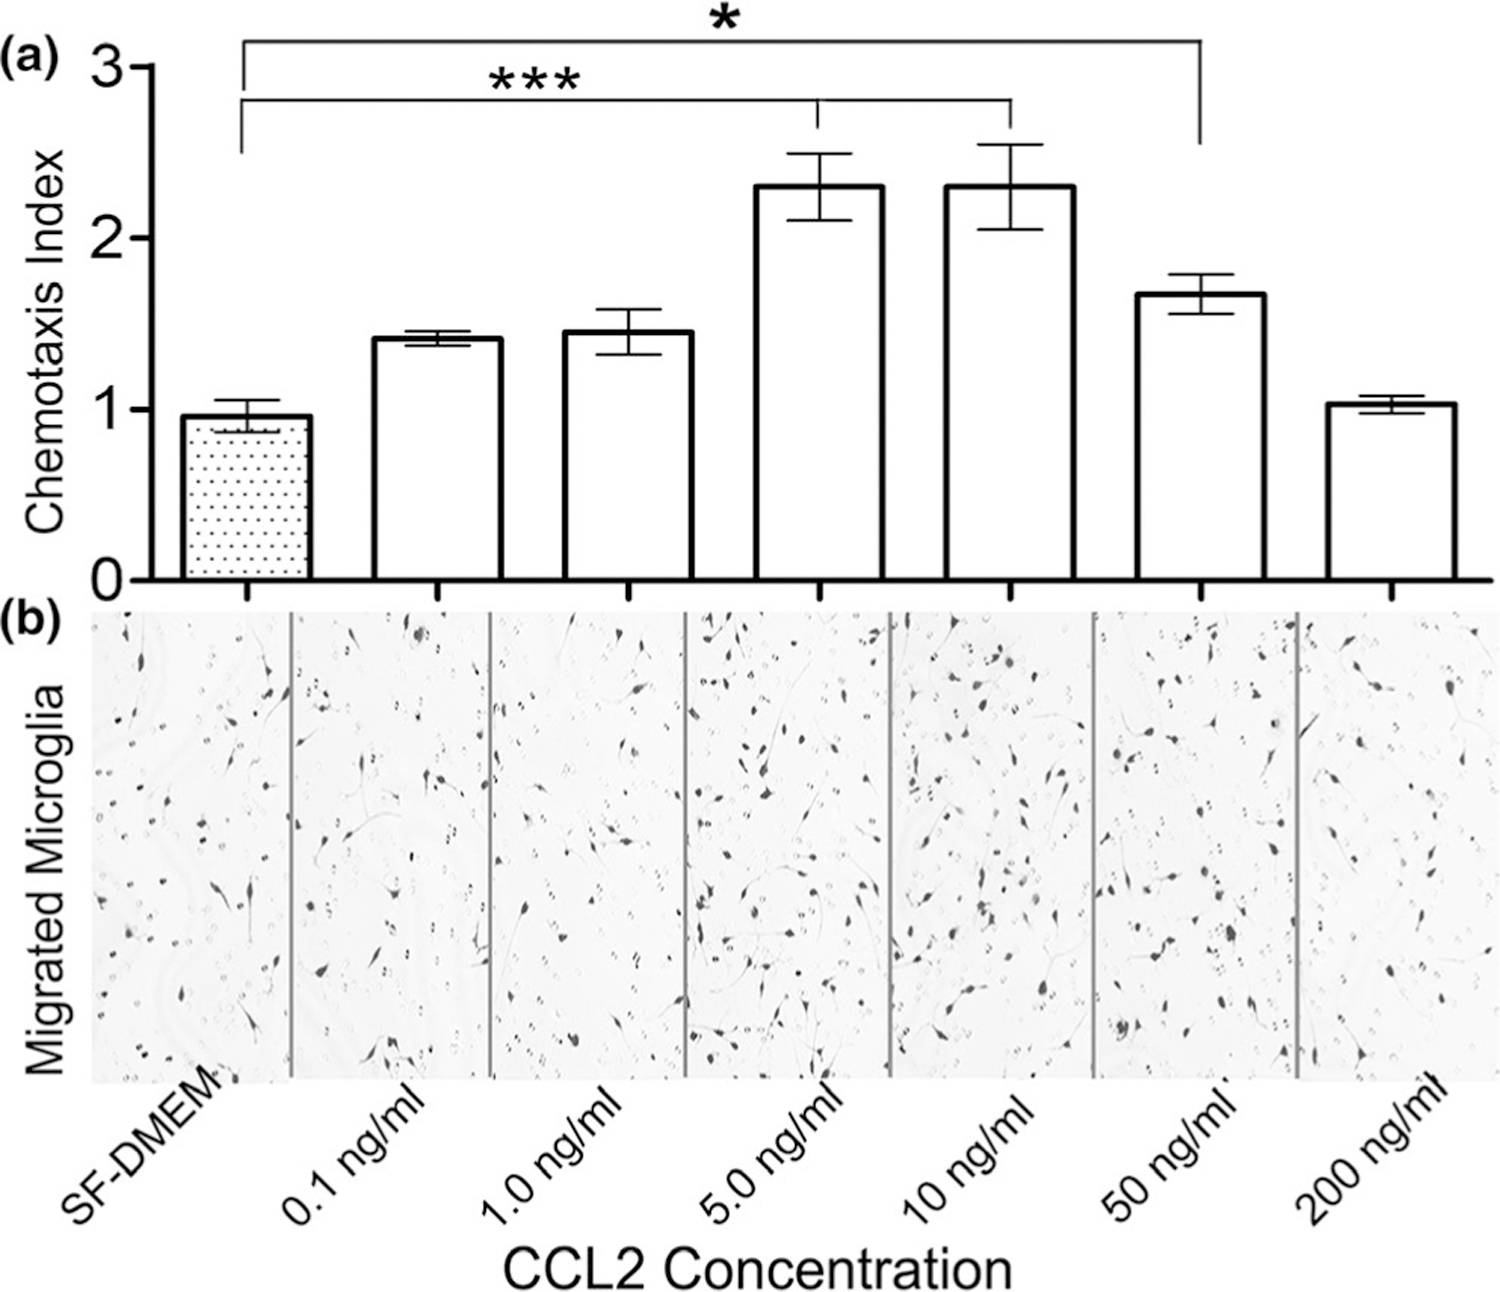
Chemoattractant effect of the CCL2 alone on the microglia. (a) Dose-dependent chemotaxis index of microglia migration toward CCL2, with the highest chemotaxis index at the doses of 5 and 10 ng/ml. The dose of 50 ng/ml also elicited a significant microglia migration as compared to SF-DMEM control (p < 0.001 and p < 0.05, respectively; F6,9 = 13.6). The CCL2 doses tested were determined based on its concentrations in 100%, 10%, and 1% WM obtained from CCL2 ELISA tests (Figure 3). (b) The majority of migrated microglia displayed long and thin or relatively thin pseudopodia, with a small portion of them exhibited shorter and thicker pseudopodia. There are also some round-sized, phagocytes-like microglia
FIGURE 6.

Examples of microglia morphology in different experimental conditions. (a) Higher magnification of microimages from SF-DMEM, CCL2, and tissue homogenate-treated microglia (from Figures 4b and 5b). (a and b) ramified or hyper-ramified microglial cells with long and thin or relative thin pseudopodia (arrows). These cells were probably in resting or intermediate stages. Some cells with shorter and thicker pseudopodia (arrowheads) demonstrated them in an activation condition. Round-shaped cells (opened arrowheads) might represent phagocytic phenotype. Ionized calcium binding adaptor-1 immunostained microglia (b) in different stages are cited from our previous work (Yang et al., 2018) and the classification criteria refers to Streit et al. (1999)
3.3 |. Differential chemoattractant capability of GM and WM for microglia
Calculation of Chemotaxis Index of the Assay: The index was calculated by ratio of migrated cells in all tested groups, including positive controls, against the number of migrated cells in negative control (Figure 5a). The assay was valid because the effect of 50 ng/ml CCL2, in positive control, on microglia migration was similar to that in CCL2 dose-dependent assay.
FIGURE 5.

Differential chemoattractant effects of rat CC WM and adjacent cortex GM homogenates on rat microglia. (a) summarized chemotaxis indexes display a significantly higher in 0.1% and 10% tissue homogenate (p < 0.05 and p < 0.01), and highly significantly higher in 1.0% (p < 0.001) supernatant, in comparison with those in adjacent cortex GM (F9,30 = 179.3). The patterns of the chemotaxis indexes are well in line with those observed in the assay using CCL2 alone as a chemoattractant. (b) Higher numbers of microglia were chemotactic to WM homogenate than to the GM homogenate in each pair of assays. It is worth to note that the majority of migrated microglia were in a round shape, implicating the phagocytic phenotype, although some of them were hyper-ramified with a shorter and thicker pseudopodium
Differential chemoattractant capability of brain GM and WM homogenates: Summarized Chemotaxis index from 3 migration tests showed that the index in 0.1%–10% WM tissue homogenates tests was all significantly higher than that index in GM tissue test (Figure 5a; p < 0.001 in 1.0% WM assay, p < 0.01 in 10% assay, and p < 0.05 in 0.1% tissue assay). In parallel, the Figure 5b displayed microglia migrated toward the WM tissue was evidently more than that traveled to the GM ones (Figure 5b) in all assays. In addition, the majority of migrated microglia were in round shape (Figures 5b and 6 opened arrowheads), illustrating their phagocytic phenotype (Streit et al., 1999), with some in a hyper-ramified morphology (Figure 6 arrowheads), i.e., in a reactive stage.
Notably, both GM and WM tissue homogenate at 1.0% concentration exhibited a higher chemoattractant capability than CCL2 alone. CCL2 alone led to 1.5–2.5-fold increase in chemotaxis vs. control, while WM tissue induced 3–7-fold increase in chemotaxis vs. control.
3.4 |. Attenuation of microglia chemotaxis toward WM homogenate by RS102895 and Anti-CCL3
As CCL2 level was significantly higher in the WM (Figures 1–3), we added CCR2 antagonist RS102895 into the system. We observed that 1.0% WM supernatant induced microglia migration was significantly decreased by adding of RS102895 into the insert medium (Figure 7a, p < 0.001). There was also a significant difference between 1.0% WM plus RS-102895 group and RS-102895 alone group (Figure 7a, p < 0.01), suggesting that the CCL2 was not the only chemoattractant in the WM tissue.
FIGURE 7.
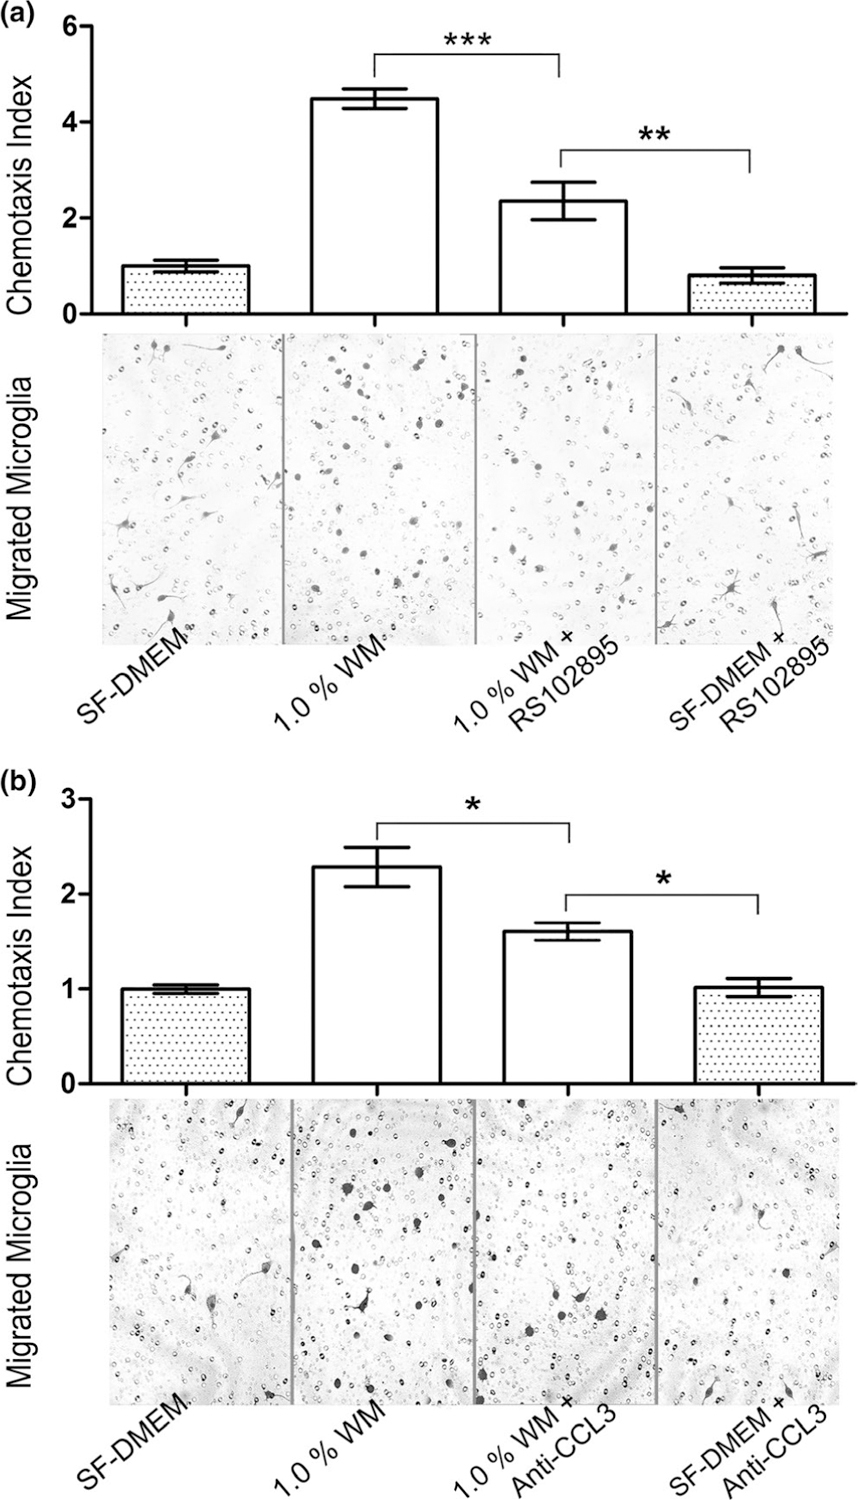
Attenuation of microglia migration toward WM homogenate by RS102895 and anti-CCL3. (a) Addition of CCL2 receptor antagonist RS102895 into microglia medium significantly reduced chemoattractant power of the WM compared to that of the WM homogenate without RS102895 (p < 0.001, F3,12 = 167.7). The chemoattractant power of WM plus RS102895 was still significantly higher than that of RS102895 alone (p < 0.01), suggesting that the CCL2 was not the only chemoattractant in the WM homogenate. (b) Similarly, addition of CCL3 neutralizing antibody into the WM homogenate significantly impeded microglia migration toward the WM tissues (p < 0.05; F3,12 = 62.5). However, addition of anti-CCL3 antibody did not abolish the ability of WM homogenate in chemotaxis (p < 0.05), suggesting other chemotactic compounds, such as CCL2, might be present in the WM homogenate and played a role in chemotaxis
As CCL3 protein density was also significantly higher in the WM (Figures 1 and 2), we applied CCL3 neutralizing antibody into the system, attempted to block the binding of its functional CC motif to its receptors. Similarly, we used 1.0% WM homogenate as chemoattractant. The result displayed a significant attenuation of microglia migration after addition of a CCL3 neutralizing antibody to WM homogenate (Figure 7b, p < 0.05). It was noticeable that there was still a vigorous microglial migration in 1.0% WM plus anti-CCL3 group than the anti-CCL3 alone (Figure 7b, p < 0.05), reflecting the existence of other chemoattractants in the WM homogenate.
4 |. DISCUSSION
The present work demonstrated that the expression levels of chemokine CCL2 and CCL3 peptides in the WM were significantly higher than in the GM in normal human and rat brains. In an agreement with CCL2 and CCL3 expression levels, the WM homogenate exhibited a higher chemoattractant capability for microglia compared to the GM, and this effect was reversed by blocking CCL2 receptors and CCL3 functional motifs. We also assessed chemoattractant effects of CCL2 on primary rat microglia, although its effect on BV2 microglia migration had been tested using a different assay (Bose et al., 2016). The genetic variance makes BV2 microglia different from primary cultured rat microglia in many aspects (Horvath et al., 2008). For this reason, we further examined the effect of serial CCL2 doses that mimic CCL2 concentrations in different titers of WM homogenate based on our ELISA results. Interestingly, the dose-dependent chemoattractant effect of CCL2 on microglia migration was in line with the concentration-dependent manner of WM homogenate in the same chemoattractant assay. These results indicated that the chemoattractant effects of WM homogenate might be mediated by CCL2 and CCL3, as both were detected higher in the WM homogenates. However, the WM homogenate-induced chemotaxis could be confounded by nucleotides ATP and ADP that were reported to be abundant in homogenized brain tissues, as these nucleotides may function as strong chemoattractant for microglia (Honda et al., 2001). We did not measure the concentration of ATP and ADP in GM and WM, but some early studies showed that the ATP levels had no significant difference between GM and WM (Erecinska & Silver, 1989; Folbergrova et al., 1970). Subsequent, in vivo 31P magnetic resonance imaging studies implied that production of ATP in normal GM was either equivalent to (Jensen et al., 2006) or relatively higher than (Zhu et al., 2012) that in normal WM. Based on these findings by other investigators, it was less likely that these nucleotides contributed to WM homogenate chemotaxis observed in our study. Furthermore, the ATP and/or ADP may directly activate the microglia, as the majority of the microglia chemotactic to tissue homogenates suggesting phagocytic properties (Streit et al., 1999) compared with the microglia treated with CCL2 alone. In addition to ATP and ADP, myelin debris may also play some roles either in activation of microglia or as a chemoattractant, considering the fact that CCL2 alone led to about 1.5–2.5-fold increase in chemotaxis vs. control, but the WM homogenate resulted in 3–7-fold increase in chemotaxis vs. control. Many in vivo studies had suggested that myelin debris is an effective chemoattractant for macrophages and/or microglia (Kopper & Gensel, 2018), and some myelin components, such as sulfatide, are strong stimulators to activate microglia (Jeon et al., 2008; Kopper & Gensel, 2018). Nonetheless, our results revealed that the CCL2 and CCL3 played an important role in the WM-induced microglia chemotaxis because addition of CCL2 receptor antagonist or CCL3 neutralizing antibody to the WM homogenate blocked its chemoattractant ability. The possibility of contribution, if any, of another chemokine CX3CL1 on WM-associated chemotaxis was low because our Western blot data showed CX3CL1 protein level in the rat and human GM was slightly higher but had no statistical difference.
We have shown in a previous study that the WM in SIV-infected brain, wherein more PCs were observed in comparison with the GM, could recruit more monocytes (Zhang et al., 2019). In HIV-infected brain, the PCs built up at an early stage of infection, according to a case report of an iatrogenic HIV-infected patient who died 15 days after accidental inoculation of the virus (Davis et al., 1992). In this case, HIV viral copies were found in systemic circulation 8 days after inoculation, while postmortem examination revealed the brain was histologically normal except conspicuous perivascular cellular cuffing (Davis et al., 1992). It is reasonable to see higher number of PCs in the WM at early stage of HIV infection if the CCL2 level in normal WM is higher because CCL2 is a strong chemoattractant to monocytes (Gu et al., 1997). Thus, potential pathogenic effects of CCL2 and/or CCL3 might be associated with the primary levels of CCL2 and CCL3 in normal brain tissues. Although the chemoattractant effects of WM on microglia were significantly attenuated by addition of a CCL2 receptor blocker RS102895 to the culture medium or a neutralizing antibody against CCL3 functional motif to the WM homogenate, we did not test the effect of non-specific antibodies (e.g., a IgG) on the chemotactic properties of the WM vs. the GM. The lack of such a control test may compromise the conclusion that CCL3 was the driving force for WM-mediated chemotactic activity. However, our data (Figures 1 and 2) clearly showed a significant higher level/concentration of CCL3 in the WM, and the WM had a stronger chemotactic activity that was attenuated by an anti-CCL3 neutralizing antibody, providing some experimental data in supporting the CCL3 in the WM chemotaxis.
In consistence with stronger chemoattractant ability of the WM, more immune cell infiltration into the WM was also observed in MS, a disease originally acknowledged as a pure WM disorder. The MS has now been recognized as a genetic factor-related, environment-triggered neurodegenerative disorder with both grey and white matters comprised (Bell et al., 2018; Handel et al., 2010; Mandolesi et al., 2015). However, the pathological findings in grey and white matters of MS patients are different, with a striking feature of a robust infiltration T cells and macrophages in the WM when in comparison with the GM (Prins et al., 2014, 2015). A primary reason for immune cell infiltration is considered to be brain–blood barrier (BBB) disruption during early neuroinflammation evoked by infectious, traumatic, or environmental stimulation (Bell et al., 2018; Handel et al., 2010; Spencer et al., 2018). This is supported by magnetic resonance imaging (MRI) studies of early-stage MS cases, in which transient increment of cortical BBB permeability was detected (Calabrese & Gallo, 2009; Maranzano et al., 2017). The phenomenon of global BBB disruption leading to immune cell infiltration into the WM implicates that WM has higher chemoattractant capability before the global BBB disruption. Furthermore, experimental evidence showed CCL2 likely dominates this higher chemoattractant capability of the WM, as immune cell infiltration into the WM in animals suffering experimental autoimmune encephalomyelitis was significantly attenuated through a selective knock out of the CCL2 gene from astrocytes and endothelial cells (Huang et al., 2001; Paul et al., 2014).
In our recent study, we also observed that the number of MNs was significantly higher in the WM than in the GM in SIV-infected brains (Zhang et al., 2019). Surprisingly, no infected cells were found in a numerous MNs, inferring microglial aggregation was not directly associated with viral infection. In fact, activation of microglia and formation of MNs in normal appearing WM were also observed in an early stage of the MS (Singh et al., 2013). Note worthily, even small number of nodules inside WM tracts may dramatically distort axon bundles (Zhang et al., 2019), and positive correlation between microglia activation–aggregation and disruption of nerve fibers paranodal apparatus have been observed in MS cases, as well as in optic nerve pathological changes in glaucoma (Bordone et al., 2017; Howell et al., 2010; Singh et al., 2013). Nevertheless, our current findings help to explain why infiltration of monocytes and T cells into the WM is more serious than their infiltration into the GM, and why more microglia nodular lesions in the WM than in the GM in MS and HIV/SIV-infected brains. Clinical observations (Dhillon et al., 2008; Prins et al., 2014) and our own data suggested that the primary WM CCL2 and CCL3 are possibly involved in the progression of brain WM neuropathology.
Supplementary Material
ACKNOWLEDGEMENTS
We warmly thank Dr. Katherine Qualls, from Department Anesthesiology, University of Cincinnati College of Medicine, for her critical reading and English improving. Special thanks extend to The Tissue Cell Core Facility in University of Nebraska Medical Center and the National NeuroAIDS Tissue Consortium (NNTC) for kindly providing human brain tissue samples for this study. This work was supported by NIH grants R01 NS077873 and R01 DA050540 to H.X., and partially supported by Hubei Province Nature Science Foundation No. 2019CFB411 to X. G.
Funding information
National Institutes of Health, Grant/Award Number: R01 NS077873 and R01 DA050540; Hubei Province Nature Science Foundation, Grant/Award Number: 2019CFB411
Abbreviations:
- ACSF
artificial cerebrospinal fluid
- ADP
adenosine diphosphate
- ATP
adenosine triphosphate
- CC
corpus callosum
- CCL
C-C-motif chemokine ligand
- CCR
CCL receptor
- CD
cluster of differentiation
- CX3CL
C-X3-C chemokine ligand
- CX3CR
CX3CL receptor
- GM
grey matter
- HIV
human immunodeficiency virus
- MN
microglia nodules
- MS
multiple sclerosis
- NNTC
National NeuroAIDS Tissue Consortium
- PC
perivascular (macrophage) cuffing
- SIV
simian immunodeficiency virus
- WM
white matter
Footnotes
CONFLICT OF INTEREST
The authors declare no conflict of interest.
PEER REVIEW
The peer review history for this article is available at https://publons.com/publon/10.1111/ejn.15187.
SUPPORTING INFORMATION
Additional supporting information may be found online in the Supporting Information section.
DATA AVAILABILITY STATEMENT
The data that support the findings of this study are available from corresponding authors upon reasonable request (zhang2jd@ucmail.uc.edu and hxiong@unmc.edu).
There are also web-links to the original laboratory from which the data were generated (see the form below).
| Human tissue resource information for Table 1 and all human tissue Western blot | Web-link: https://www.unmc.edu/pharmacology/faculty/primary-faculty/xiong/index.html Email: hxiong@unmc.edu/zhang2jd@ucmai.uc.edu |
| Human tissue Western blot of CCL2, CCL3, and CX3CL1, and GraphPad Prism files | Web-link: https://www.unmc.edu/pharmacology/faculty/primary-faculty/xiong/index.Html Email: hxiong@unmc.edu/zhang2jd@ucmai.uc.edu |
| Rat ELISA data, rat Western blot for CCL2, CCL3, and CX3CL1, and Prism files | Web-link: http://yxy.hbuas.edu-cn/xzzx/bgxz.htm Email: gongxrhbxy@gmail.com/zhang2jd@ucmai.uc.edu |
| Microglia chemotaxis assay using CCL2 as a chemoattractant, and using grey and white matters homogenates as chemoattractant | Web-link: http://yxy.hbuas.edu-cn/xzzx/bgxz.htm Email: gongxrhbxy@gmail.com/zhang2jd@ucmai.uc.edu |
REFERENCES
- Alakkas A, Ellis RJ, Watson CW, Umlauf A, Heaton RK, Letendre S, Collier A, Marra C, Clifford DB, Gelman B, Sacktor N, Morgello S, Simpson D, McCutchan JA, Kallianpur A, Gianella S, Marcotte T, Grant I, Fennema-Notestine C; Group, C. (2019). White matter damage, neuroinflammation, and neuronal integrity in HAND. Journal of Neurovirology, 25, 32–41. 10.1007/s13365-018-0682-9 [DOI] [PMC free article] [PubMed] [Google Scholar]
- Bae HG, Kim TK, Suk HY, Jung S, & Jo DG (2020). White matter and neurological disorders. Archives of Pharmacal Research, 43, 920–931. 10.1007/s12272-020-01270-x [DOI] [PubMed] [Google Scholar]
- Bailey EL, McCulloch J, Sudlow C, & Wardlaw JM (2009). Potential animal models of lacunar stroke: A systematic review. Stroke, 40, e451–458. 10.1161/STROKEAHA.108.528430 [DOI] [PubMed] [Google Scholar]
- Bell JS, Spencer JI, Yates RL, & DeLuca GC (2018). The cortical blood-brain barrier in multiple sclerosis: A gateway to progression? Journal of Neurology, 265, 966–967. 10.1007/s00415-017-8727-1 [DOI] [PubMed] [Google Scholar]
- Bordone MP, Gonzalez Fleitas MF, Pasquini LA, Bosco A, Sande PH, Rosenstein RE, & Dorfman D (2017). Involvement of microglia in early axoglial alterations of the optic nerve induced by experimental glaucoma. Journal of Neurochemistry, 142, 323–337. 10.1111/jnc.14070 [DOI] [PubMed] [Google Scholar]
- Borrajo A, Spuch C, Penedo MA, Olivares JM, & Agis-Balboa RC (2021). Important role of microglia in HIV-1 associated neurocognitive disorders and the molecular pathways implicated in its pathogenesis. Annals of Medicine, 53, 43–69. 10.1080/07853890.2020.1814962 [DOI] [PMC free article] [PubMed] [Google Scholar]
- Bose S, Kim S, Oh Y, Moniruzzaman M, Lee G, & Cho J (2016). Effect of CCL2 on BV2 microglial cell migration: Involvement of probable signaling pathways. Cytokine, 81, 39–49. 10.1016/j.cyto.2016.02.001 [DOI] [PubMed] [Google Scholar]
- Buschmann JP, Berger K, Awad H, Clarner T, Beyer C, & Kipp M (2012). Inflammatory response and chemokine expression in the white matter corpus callosum and gray matter cortex region during cuprizone-induced demyelination. Journal of Molecular Neuroscience, 48, 66–76. 10.1007/s12031-012-9773-x [DOI] [PMC free article] [PubMed] [Google Scholar]
- Calabrese M, & Gallo P (2009). Magnetic resonance evidence of cortical onset of multiple sclerosis. Multiple Sclerosis, 15, 933–941. 10.1177/1352458509106510 [DOI] [PubMed] [Google Scholar]
- Carr MW, Roth SJ, Luther E, Rose SS, & Springer TA (1994). Monocyte chemoattractant protein 1 acts as a T-lymphocyte chemoattractant. Proceedings of the National Academy of Sciences of the United States of America, 91, 3652–3656. 10.1073/pnas.91.9.3652 [DOI] [PMC free article] [PubMed] [Google Scholar]
- Cho H, Hashimoto T, Wong E, Hori Y, Wood LB, Zhao L, Haigis KM, Hyman BT, & Irimia D (2013). Microfluidic chemotaxis platform for differentiating the roles of soluble and bound amyloid-beta on microglial accumulation. Scientific Reports, 3, 1823. [DOI] [PMC free article] [PubMed] [Google Scholar]
- Davis LE, Hjelle BL, Miller VE, Palmer DL, Llewellyn AL, Merlin TL, Young SA, Mills RG, Wachsman W, & Wiley CA (1992). Early viral brain invasion in iatrogenic human immunodeficiency virus infection. Neurology, 42, 1736–1739. 10.1212/WNL.42.9.1736 [DOI] [PubMed] [Google Scholar]
- Dhillon NK, Williams R, Callen S, Zien C, Narayan O, & Buch S (2008). Roles of MCP-1 in development of HIV-dementia. Frontiers in Bioscience: A Journal and Virtual Library, 13, 3913–3918. 10.2741/2979 [DOI] [PMC free article] [PubMed] [Google Scholar]
- Elmarakby AA, Quigley JE, Olearczyk JJ, Sridhar A, Cook AK, Inscho EW, Pollock DM, & Imig JD (2007). Chemokine receptor 2b inhibition provides renal protection in angiotensin II - salt hypertension. Hypertension, 50, 1069–1076. 10.1161/HYPERTENSIONAHA.107.098806 [DOI] [PMC free article] [PubMed] [Google Scholar]
- Erecinska M, & Silver IA (1989). ATP and brain function. Journal of Cerebral Blood Flow and Metabolism: Official Journal of the International Society of Cerebral Blood Flow and Metabolism, 9, 2–19. 10.1038/jcbfm.1989.2 [DOI] [PubMed] [Google Scholar]
- Filley CM, & Fields RD (2016). White matter and cognition: Making the connection. Journal of Neurophysiology, 116, 2093–2104. 10.1152/jn.00221.2016 [DOI] [PMC free article] [PubMed] [Google Scholar]
- Folbergrova J, Lowry OH, & Passonneau JV (1970). Changes in metabolites of the energy reserves in individual layers of mouse cerebral cortex and subjacent white matter during ischaemia and anaesthesia. Journal of Neurochemistry, 17, 1155–1162. 10.1111/j.1471-4159.1970.tb03363.x [DOI] [PubMed] [Google Scholar]
- Gu L, Rutledge B, Fiorillo J, Ernst C, Grewal I, Flavell R, Gladue R, & Rollins B (1997). In vivo properties of monocyte chemoattractant protein-1. Journal of Leukocyte Biology, 62, 577–580. 10.1002/jlb.62.5.577 [DOI] [PubMed] [Google Scholar]
- Handel AE, Giovannoni G, Ebers GC, & Ramagopalan SV (2010). Environmental factors and their timing in adult-onset multiple sclerosis. Nature Reviews. Neurology, 6, 156–166. [DOI] [PubMed] [Google Scholar]
- Harrison JK, Jiang Y, Chen S, Xia Y, Maciejewski D, McNamara RK, Streit WJ, Salafranca MN, Adhikari S, Thompson DA, Botti P, Bacon KB, & Feng L (1998). Role for neuronally derived fractalkine in mediating interactions between neurons and CX3CR1-expressing microglia. Proceedings of the National Academy of Sciences of the United States of America, 95, 10896–10901. 10.1073/pnas.95.18.10896 [DOI] [PMC free article] [PubMed] [Google Scholar]
- Hart AD, Wyttenbach A, Perry VH, & Teeling JL (2012). Age related changes in microglial phenotype vary between CNS regions: Grey versus white matter differences. Brain, Behavior, and Immunity, 26, 754–765. 10.1016/j.bbi.2011.11.006 [DOI] [PMC free article] [PubMed] [Google Scholar]
- He M, Dong H, Huang Y, Lu S, Zhang S, Qian Y, & Jin W (2016). Astrocyte-derived CCL2 is associated with M1 activation and recruitment of cultured microglial cells. Cellular Physiology and Biochemistry: International Journal of Experimental Cellular Physiology, Biochemistry, and Pharmacology, 38, 859–870. 10.1159/000443040 [DOI] [PubMed] [Google Scholar]
- Honda S, Sasaki Y, Ohsawa K, Imai Y, Nakamura Y, Inoue K, & Kohsaka S (2001). Extracellular ATP or ADP induce chemotaxis of cultured microglia through Gi/o-coupled P2Y receptors. The Journal of Neuroscience: The Official Journal of the Society for Neuroscience, 21, 1975–1982. [DOI] [PMC free article] [PubMed] [Google Scholar]
- Horvath RJ, Nutile-McMenemy N, Alkaitis MS, & Deleo JA (2008). Differential migration, LPS-induced cytokine, chemokine, and NO expression in immortalized BV-2 and HAPI cell lines and primary microglial cultures. Journal of Neurochemistry, 107, 557–569. 10.1111/j.1471-4159.2008.05633.x [DOI] [PMC free article] [PubMed] [Google Scholar]
- Howell OW, Rundle JL, Garg A, Komada M, Brophy PJ, & Reynolds R (2010). Activated microglia mediate axoglial disruption that contributes to axonal injury in multiple sclerosis. Journal of Neuropathology and Experimental Neurology, 69, 1017–1033. 10.1097/NEN.0b013e3181f3a5b1 [DOI] [PMC free article] [PubMed] [Google Scholar]
- Huang DR, Wang J, Kivisakk P, Rollins BJ, & Ransohoff RM (2001). Absence of monocyte chemoattractant protein 1 in mice leads to decreased local macrophage recruitment and antigen-specific T helper cell type 1 immune response in experimental autoimmune encephalomyelitis. The Journal of Experimental Medicine, 193, 713–726. 10.1084/jem.193.6.713 [DOI] [PMC free article] [PubMed] [Google Scholar]
- Janssen K, Rickert M, Clarner T, Beyer C, & Kipp M (2016). Absence of CCL2 and CCL3 ameliorates central nervous system grey matter but not white matter demyelination in the presence of an intact blood-brain barrier. Molecular Neurobiology, 53, 1551–1564. 10.1007/s12035-015-9113-6 [DOI] [PubMed] [Google Scholar]
- Jensen BK, Roth LM, Grinspan JB, & Jordan-Sciutto KL (2019). White matter loss and oligodendrocyte dysfunction in HIV: A consequence of the infection, the antiretroviral therapy or both? Brain Research, 1724, 146397.– 10.1016/j.brainres.2019.146397 [DOI] [PMC free article] [PubMed] [Google Scholar]
- Jensen JE, Miller J, Williamson PC, Neufeld RW, Menon RS, Malla A, Manchanda R, Schaefer B, Densmore M, & Drost DJ (2006). Grey and white matter differences in brain energy metabolism in first episode schizophrenia: 31P-MRS chemical shift imaging at 4 Tesla. Psychiatry Research, 146, 127–135. 10.1016/j.pscychresns.2005.11.004 [DOI] [PubMed] [Google Scholar]
- Jeon SB, Yoon HJ, Park SH, Kim IH, & Park EJ (2008). Sulfatide, a major lipid component of myelin sheath, activates inflammatory responses as an endogenous stimulator in brain-resident immune cells. Journal of Immunology, 181, 8077–8087. 10.4049/jimmunol.181.11.8077 [DOI] [PubMed] [Google Scholar]
- Kopper TJ, & Gensel JC (2018). Myelin as an inflammatory mediator: Myelin interactions with complement, macrophages, and microglia in spinal cord injury. Journal of Neuroscience Research, 96, 969–977. 10.1002/jnr.24114 [DOI] [PMC free article] [PubMed] [Google Scholar]
- Mandolesi G, Gentile A, Musella A, Fresegna D, De Vito F, Bullitta S, Sepman H, Marfia GA, & Centonze D (2015). Synaptopathy connects inflammation and neurodegeneration in multiple sclerosis. Nature Reviews. Neurology, 11, 711–724. [DOI] [PubMed] [Google Scholar]
- Maranzano J, Rudko DA, Nakamura K, Cook S, Cadavid D, Wolansky L, Arnold DL, & Narayanan S (2017). MRI evidence of acute inflammation in leukocortical lesions of patients with early multiple sclerosis. Neurology, 89, 714–721. 10.1212/WNL.0000000000004227 [DOI] [PMC free article] [PubMed] [Google Scholar]
- Melik-Parsadaniantz S, & Rostene W (2008). Chemokines and neuromodulation. Journal of Neuroimmunology, 198, 62–68. 10.1016/j.jneuroim.2008.04.022 [DOI] [PubMed] [Google Scholar]
- Menten P, Wuyts A, & Van Damme J (2002). Macrophage inflammatory protein-1. Cytokine & Growth Factor Reviews, 13, 455–481. 10.1016/S1359-6101(02)00045-X [DOI] [PubMed] [Google Scholar]
- Nishiyori A, Minami M, Ohtani Y, Takami S, Yamamoto J, Kawaguchi N, Kume T, Akaike A, & Satoh M (1998). Localization of fractalkine and CX3CR1 mRNAs in rat brain: Does fractalkine play a role in signaling from neuron to microglia? FEBS Letters, 429, 167–172. [DOI] [PubMed] [Google Scholar]
- Nutma E, Willison H, Martino G, & Amor S (2019). Neuroimmunology - the past, present and future. Clinical and Experimental Immunology, 197, 278–293. [DOI] [PMC free article] [PubMed] [Google Scholar]
- Paul D, Ge S, Lemire Y, Jellison ER, Serwanski DR, Ruddle NH, & Pachter JS (2014). Cell-selective knockout and 3D confocal image analysis reveals separate roles for astrocyte-and endothelial-derived CCL2 in neuroinflammation. Journal of Neuroinflammation, 11, 10.– 10.1186/1742-2094-11-10 [DOI] [PMC free article] [PubMed] [Google Scholar]
- Perry VH, Matyszak MK, & Fearn S (1993). Altered antigen expression of microglia in the aged rodent CNS. Glia, 7, 60–67. 10.1002/glia.440070111 [DOI] [PubMed] [Google Scholar]
- Prins M, Dutta R, Baselmans B, Breve JJ, Bol JG, Deckard SA, van der Valk P, Amor S, Trapp BD, de Vries HE, Drukarch B, & van Dam AM (2014). Discrepancy in CCL2 and CCR2 expression in white versus grey matter hippocampal lesions of Multiple Sclerosis patients. Acta Neuropathologica Communications, 2, 98, 10.1186/s40478-014-0098-6 [DOI] [PMC free article] [PubMed] [Google Scholar]
- Prins M, Schul E, Geurts J, van der Valk P, Drukarch B, & van Dam AM (2015). Pathological differences between white and grey matter multiple sclerosis lesions. Annals of the New York Academy of Sciences, 1351, 99–113. 10.1111/nyas.12841 [DOI] [PubMed] [Google Scholar]
- Sampaio-Baptista C, & Johansen-Berg H (2017). White matter plasticity in the adult brain. Neuron, 96, 1239–1251. 10.1016/j.neuron.2017.11.026 [DOI] [PMC free article] [PubMed] [Google Scholar]
- Singh S, Metz I, Amor S, van der Valk P, Stadelmann C, & Bruck W (2013). Microglial nodules in early multiple sclerosis white matter are associated with degenerating axons. Acta Neuropathologica, 125, 595–608. 10.1007/s00401-013-1082-0 [DOI] [PMC free article] [PubMed] [Google Scholar]
- Spencer JI, Bell JS, & DeLuca GC (2018). Vascular pathology in multiple sclerosis: Reframing pathogenesis around the blood-brain barrier. Journal of Neurology, Neurosurgery & Psychiatry, 89, 42–52. 10.1136/jnnp-2017-316011 [DOI] [PubMed] [Google Scholar]
- Streit WJ, Walter SA, & Pennell NA (1999). Reactive microgliosis. Progress in Neurobiology, 57, 563–581. 10.1016/S0301-0082(98)00069-0 [DOI] [PubMed] [Google Scholar]
- Wallet C, De Rovere M, Van Assche J, Daouad F, De Wit S, Gautier V, Mallon PWG, Marcello A, Van Lint C, Rohr O, & Schwartz C (2019). Microglial cells: The main HIV-1 reservoir in the brain. Frontiers in Cellular and Infection Microbiology, 9, 362, 10.3389/fcimb.2019.00362 [DOI] [PMC free article] [PubMed] [Google Scholar]
- Wu XM, Liu Y, Qian ZM, Luo QQ, & Ke Y (2016). CX3CL1/CX3CR1 axis plays a key role in ischemia-induced oligodendrocyte injury via p38MAPK signaling pathway. Molecular Neurobiology, 53, 4010–4018. 10.1007/s12035-015-9339-3 [DOI] [PubMed] [Google Scholar]
- Yang X, Zhang JD, Duan L, Xiong HG, Jiang YP, & Liang HC (2018). Microglia activation mediated by toll-like receptor-4 impairs brain white matter tracts in rats. Journal of Biomedical Research, 32, 136–144. [DOI] [PMC free article] [PubMed] [Google Scholar]
- Zephir H (2018). Progress in understanding the pathophysiology of multiple sclerosis. Revue Neurologique, 174, 358–363. 10.1016/j.neurol.2018.03.006 [DOI] [PubMed] [Google Scholar]
- Zhang J, Fox H, & Xiong H (2019). Severer nodular lesion in white matter than in gray matter in simian immunodeficiency virus-infected monkey, but not closely correlated with viral infection. Journal of Biomedical Research, 34, 292–300. [DOI] [PMC free article] [PubMed] [Google Scholar]
- Zhu XH, Qiao H, Du F, Xiong Q, Liu X, Zhang X, Ugurbil K, & Chen W (2012). Quantitative imaging of energy expenditure in human brain. NeuroImage, 60, 2107–2117. 10.1016/j.neuroimage.2012.02.013 [DOI] [PMC free article] [PubMed] [Google Scholar]
Associated Data
This section collects any data citations, data availability statements, or supplementary materials included in this article.
Supplementary Materials
Data Availability Statement
The data that support the findings of this study are available from corresponding authors upon reasonable request (zhang2jd@ucmail.uc.edu and hxiong@unmc.edu).
There are also web-links to the original laboratory from which the data were generated (see the form below).
| Human tissue resource information for Table 1 and all human tissue Western blot | Web-link: https://www.unmc.edu/pharmacology/faculty/primary-faculty/xiong/index.html Email: hxiong@unmc.edu/zhang2jd@ucmai.uc.edu |
| Human tissue Western blot of CCL2, CCL3, and CX3CL1, and GraphPad Prism files | Web-link: https://www.unmc.edu/pharmacology/faculty/primary-faculty/xiong/index.Html Email: hxiong@unmc.edu/zhang2jd@ucmai.uc.edu |
| Rat ELISA data, rat Western blot for CCL2, CCL3, and CX3CL1, and Prism files | Web-link: http://yxy.hbuas.edu-cn/xzzx/bgxz.htm Email: gongxrhbxy@gmail.com/zhang2jd@ucmai.uc.edu |
| Microglia chemotaxis assay using CCL2 as a chemoattractant, and using grey and white matters homogenates as chemoattractant | Web-link: http://yxy.hbuas.edu-cn/xzzx/bgxz.htm Email: gongxrhbxy@gmail.com/zhang2jd@ucmai.uc.edu |