Abstract
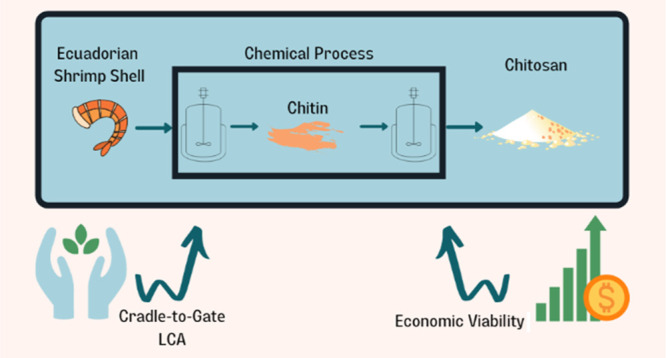
Ecuador is a country where shrimp production is one of its primary industries. It generates annually about 72,000 tons of wastes in the form of shrimp shells. Therefore, using this waste as a raw material resource to produce chitosan, a biopolymer, is established. An environmental and economic performance study is carried out as a possible investment report, where a conceptual design of the process is defined and a financial viability report is obtained. An environmental impact report establishes the degree of harm to the environment. The economic viability study considered costs related to capital and operation to process 5000 tons of shrimp shells each year. On the other hand, a life cycle assessment was performed to obtain the environmental impact for 1 kg of chitosan produce, where a cradle-to-gate approach was established. Results showed that this new industry has a net present value of 10.38 million USD, a rate of return of 67.31%, and a payback period of 3.13 years. Additionally, it was calculated that the environmental impact with a higher normalized value was the human noncarcinogenic toxicity. It is concluded that the production of chitosan in Guayas-Ecuador is economically viable and cost-competitive in the market, and it represents an industrial activity with no considerable environmental impacts.
1. Introduction
The environmental impacts of synthetic plastics have been studied and criticized by many researchers in terms of benefits contrasted to their damage to the planet.1,2 Based on this truth, many alternatives should be considered to minimize plastics’ adverse effects in the future. One of those alternatives could be taking the biopolymers from natural resources into account. Biopolymers cannot replace synthetic nondegradable polymers in the short term, but they can be used partially to decrease synthetic polymers’ harmful effects. Chitin is the second most abundant natural polymer following cellulose, and its most important product or derivative is chitosan. Chitosan is a nontoxic, biodegradable, biocompatible, antimicrobial, and naturally derived polymer. For these properties, this renewable polymer is finding its way through many scientists’ research in many different field studies.3,4
Furthermore, it has many applications that range from the cosmetic industry to water treatment because of its many interesting properties such as biodegradability, nontoxicity, antimicrobial activity.5 Due to its unique properties, it has been used in tissue engineering and drug delivery. Besides, nanofibers of chitosan have some other biomedical industry applications where their antimicrobial and low immunogenicity contribute to future research and development (R & R & R&D). Its capacity is to be processed into different forms such as gels or sponges that make it an ideal biopolymer.6,7 It is mainly studied in the food industry applications as films that can provide a biodegradable alternative to nondegradable plastics as providing a protective layer because of its antimicrobial activity. Some studies reported the use of chitosan as a reinforcement material for synthetic polymers.8−10 Chitin can be extracted from crustacean animals’ shells. Among those, shrimp and crab shells are the most used ones for chitin and chitosan production. Once chitin is extracted from the shell, it can be converted into chitosan via alkaline hydrolysis.11 In other words, chitin is isolated by removing water, proteins, minerals, and pigments from the shrimp shell and then converted into chitosan by a deacetylation process.12 Chitosan is an outstanding alternative for synthetic polymeric materials with a growing commercial market.
Ecuador is a developing country that needs new industries and new products that can be manufactured and exported to change its economic growth positively. However, the more the industrialization, the more the challenges and pollutants released to the environment, which can badly affect the ecosystem.13 Therefore, the environmental point of view must be considered before the industrialization of a product.
One of the industries with more growth in Ecuador is the food industry, with a 4.7% proportion of its gross domestic product with a market of approximately 3 billion dollars.14 Among these, the shrimp industry has an 8% contribution that makes Ecuador one of the world’s leading shrimp exporters. A country like Ecuador, producing 600 thousand tons of shrimps in 2017,14 could and should consider creating a chitosan industry taking only the shells of shrimps into account.
Berrezueta reported a business plan for the production and commercialization of chitin and chitosan in Ecuador,15 while Andrade reported the viability of exportation of shrimp wastes to China.16 On the other hand, Changoluisa and Sánchez analyzed the demand for chitosan in the world.17 Besides that, Chavez and Lopez presented an approach for using every part of the waste obtained from the shrimp industry.18 There is neither a study published in the literature nor a technical report that includes environmental and economic considerations for chitosan production at the industrial level in Ecuador.
The life cycle analysis is a quantitative tool that can help estimate the environmental impact of producing a product considering reagents, residues, and components at both industrial and laboratory levels.19−21 For this purpose, Gómez-Ríos et al. reported a technical design for the chitosan production plant in Colombia with a plant simulation, equipment with dimensions, and cost analysis associated with the plant designed.22 On the other hand, Muñoz et al. analyzed and compared the life cycle of chitosan production from shrimp shells and crab shells in two different manufacturing locations in India and Europe.23,24 They have focused on chitosan production’s environmental performance taking the process conditions and reagents into account to obtain chitosan.
Due to its unique properties, chitosan has many potential applications in different industries such as food packaging, materials, and biomedical applications.25−27
This study aimed to analyze the environmental and economic viability of a chitosan production plant in Ecuador. For this purpose, extended environmental and life cycle analyzes have been performed. Besides, produced chitosan is exported, and the financial analysis part of this study counts on a chitosan production plant that can use 7% of the total waste of shrimp shells produced in Ecuador. Both environmental and economic approaches will give the necessary tools to a potential investor to decide whether to invest in this new industry to benefit the country’s economy or not.
2. Results and Discussion
2.1. Economic Viability Analysis
The chitosan production plant designed has a 5000 ton processing capacity, representing 7% of the total shrimp waste produced in Ecuador. It means that depending on the amount of shrimp shells considered, the plant’s capacity and design could be changed.
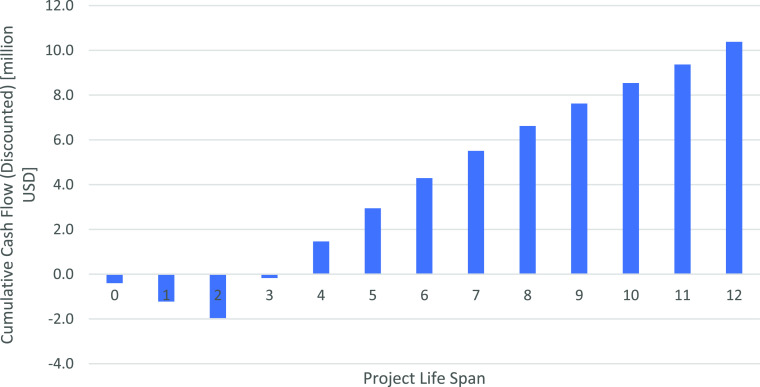
Figure 1 presents the projected cash flows obtained from CapCost.28 The figure shows a 2 year investment and construction of the chitosan plant; afterward, a 10 year production of chitosan as an established time is shown. As seen in the figure, a quick investment recovery occurs, and a final value of over 10 million dollars is reached in the plant’s projected lifespan.
Figure 1.
Chitosan plant, cashflow [$, USD].
Table 1 shows the calculated economic criteria, where discounted criteria indicate the current study’s investment viability. A positive return rate suggests that investment is viable. Besides, as seen in Table 1, a high return rate of 67% is probable for this type of investment. As seen both in Figure 1 and Table 1, the payback period is reached between the years of 3 and 4, which is about 1 year after chitosan production begins. Negative cumulative values from years 0–3 come from fixed capital investment (≈1.5 million), working capital, and manufacturing cost. However, rapid recovery can be found after plant construction is completed.
Table 1. Discounted Economic Criteria.
| criterion | value |
|---|---|
| net present value (millions) | 10.38 |
| internal return rate | 67.31 |
| payback period (years) | 3.13 |
Several studies show different plant designs and cost analyses. In Spain, a study focused on chitosan production was performed using white prawn as a raw material with a capacity of 130 tons of exoskeletons.29 This study requires an investment of $750 thousand and the fifth year of production as its lifespan. It reaches a net present value of $5 million and a return rate of 75%. The location and type of raw materials generate profit for the investor, which gives us an idea of the type of market that can be tackled. Production of 1 kg of chitosan in Spain has a cost of $14.
Contrary to this, in the current project, 1 kg of chitosan production cost in Ecuador is $8.39. Therefore, it is almost two times less than the production cost in the scenario presented in this study. The difference is because of scaling concepts, as the present work aims to produce 110 tons of chitosan, while the plant in Spain produces only 32 tons. However, both studies have similar return rates of 67% (Ecuador) versus 75% (Spain). On the other hand, the price point for the research carried out by Moreno29 is $82 (70€), and for the present study, it is only $5. This critical comparison explains the difference between the returns rates and gives the current research a competitive advantage because of the lower price for chitosan production.
Additionally, Gómez-Ríos et al. estimated the cost for a kilogram of chitosan production of $10.5–12 in Colombia, taking a processing capacity of 230 kg/batch of dry shrimp shells into account.22 In comparison, the plant designed in this study can process 550–600 kg/batch. Once again, it should be reminded that the scaling factor is involved. In the study of Gómez-Ríos et al., there is a techno-economic approach that considers many parameters that reduce any cost variability to almost certainty. Design, economic factors such as the country risk rate, or the type of economic investment methodology can cause a variation of 15–20% in our projected cost analysis. The production cost for countries such as Colombia or Ecuador can be set in a range of $10–11/kg with a selling price of $58, which is very competitive within the market. Roberts30 analyzed 30 years of research in the chitosan production industry and reported an average manufacturing cost of $11.5. With this report, the production cost of chitosan production in Ecuador would be one of the most economically viable ones.
Two key points that arise the costs in the study are as follows: first, taxes for imports, equipment, or reagents, making 1.8 times more costly than it is bought; second, reuse of reagents have not been considered; for instance, ethanol can be recycled, and reuse in removing pigments and the 50% sodium hydroxide used in the deacetylation process can also be reused as its basicity remains almost the same, and this can significantly reduce manufacturing cost as reagents are one of the main contributors in this parameter. In this last regard, operational costs have the most impact, as said before, which affects the rate of returns which depends significantly on operational expenditure.31 It is estimated that variable cost counts for 60% of manufacturing costs, so they need to be tightly managed.
2.2. Environmental Viability
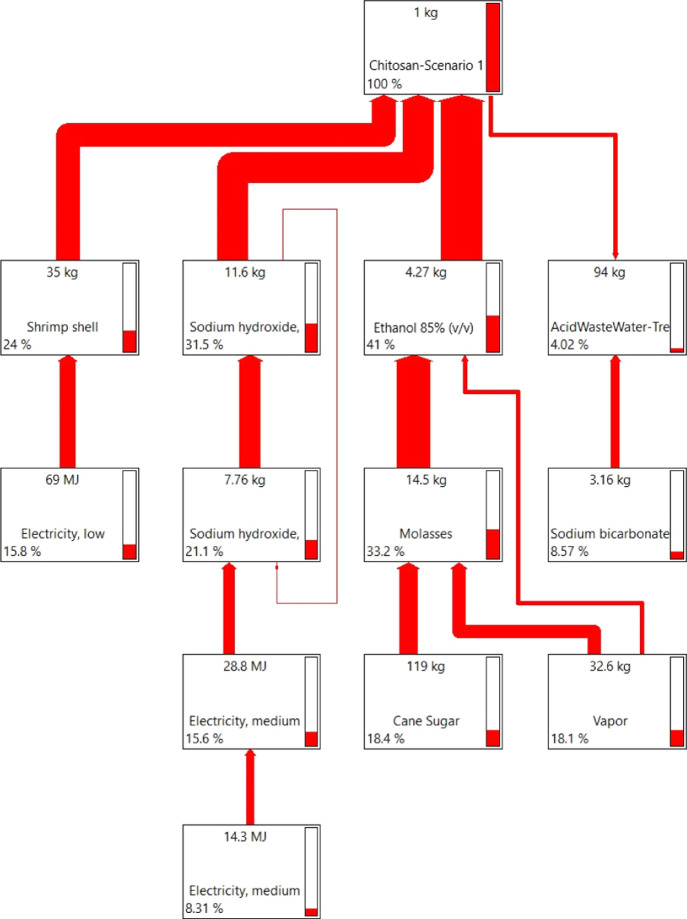
Figure 2 presents the life cycle assessment network’s main stages, simulating the network graph obtained from SimaPro software, using the ReCiPe Midpoint H32,33 method, where contributions to the overall environmental impacts are noted in percentages in each block. As seen in Figure 2, electricity and vapor are essential parts in almost every process within the system for the primary process or for the reagents needed to change the raw material. Additionally, ethanol and sodium hydroxide contribute the most to the system (see Figure 2).
Figure 2.
LCA network output report for chitosan production with the corresponding environmental impact of each step in % obtained.
Table 2 shows the results from all 18 categories for the life cycle assessment taking the hierarchy method32,33 into account, which considers long-term impacts on the environment. Detailed information about the contribution of each process to the total impact score of each of the 18 categories can be seen in Table S6 in Supporting Information.
Table 2. Life Cycle Analysis Outputs Obtained by the RECIPE Midpoint H Method for 1 kg of Chitosan Production.
| impact category | unit | value |
|---|---|---|
| global warming | kg CO2 equiv | 59.22 |
| stratospheric ozone depletion | kg CFC11 equiv | 4.03 × 10⁻⁵ |
| ionizing radiation | kBq Co-60 equiv | 2.47 |
| ozone formation, human health | kg NOx equiv | 7.98 × 10⁻² |
| fine particulate matter formation | kg PM2.5 equiv | 6.07 × 10⁻² |
| ozone formation, terrestrial ecosystems | kg NOx equiv | 8.13 × 10⁻² |
| terrestrial acidification | kg SO2 equiv | 1.97 × 10⁻¹ |
| freshwater eutrophication | kg P equiv | 1.39 × 10⁻² |
| marine eutrophication | kg N equiv | 3.14 × 10⁻³ |
| terrestrial ecotoxicity | kg 1,4-DCB | 105.87 |
| freshwater ecotoxicity | kg 1,4-DCB | 1.12 |
| marine ecotoxicity | kg 1,4-DCB | 1.554 |
| human carcinogenic toxicity | kg 1,4-DCB | 1.31 |
| human noncarcinogenic toxicity | kg 1,4-DCB | 28.18 |
| land use | m2a crop equiv | 5.69 |
| mineral resource scarcity | kg Cu equiv | 1.09 × 10⁻¹ |
| fossil resource scarcity | kg oil equiv | 11.31 |
| water consumption | m3 | 34.45 |
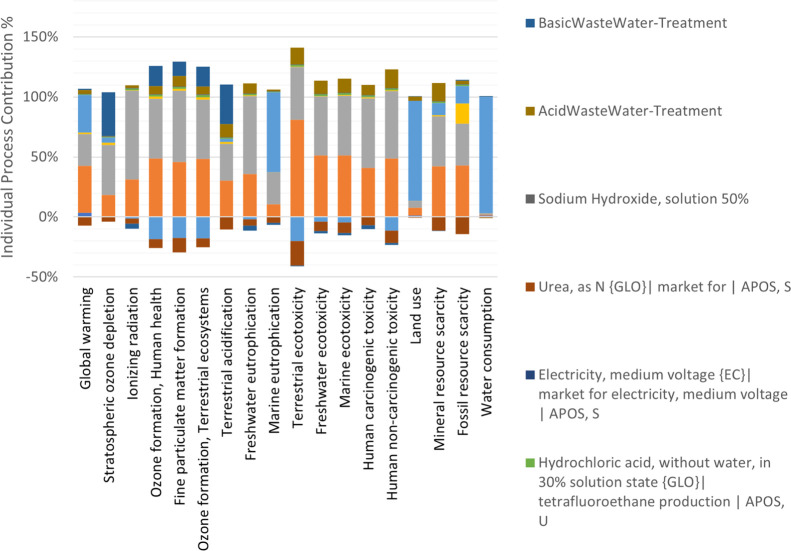
In this study, especially the categories with the highest impacts have been analyzed. Ethanol, sodium hydroxide, and shrimp shells are the three major processes contributing to the “global warming” category with 27, 31, and 39%, respectively. The shrimp shells and sodium hydroxide processes negatively impact the “marine ecotoxicity” category. Nevertheless, urea, which replaces the protein slurry that drops the production of mineral fertilizers, positively impacts this category. Figure 3 shows the detailed information of each process’s impact on the environment using the ReCiPe Midpoint H32,33 method. Since there are different stages in chitosan production, several processes are involved in every impact indicator. As sodium hydroxide is one of the primary reagents used in almost every stage in chitosan production, it is no surprise that its waste treatment denotes the two contributors in every impact category. Ethanol consumption is directly related to the land used to raise the crops for ethanol production and water for their life cycle. As aforementioned, some specific contributors affect the environment positively in the process by presenting negative percentages in LCA. These positively impacting processes mean that the reagent used in this process can be recovered and avoid an industrial production that affects the environment. The detailed information about how each inventory item contributes to the environmental impact can be found in the process contribution of additional excel files (see Input&Output files) and inventory analysis in Supporting Information.
Figure 3.
Impact of each process in chitosan production on the environment.
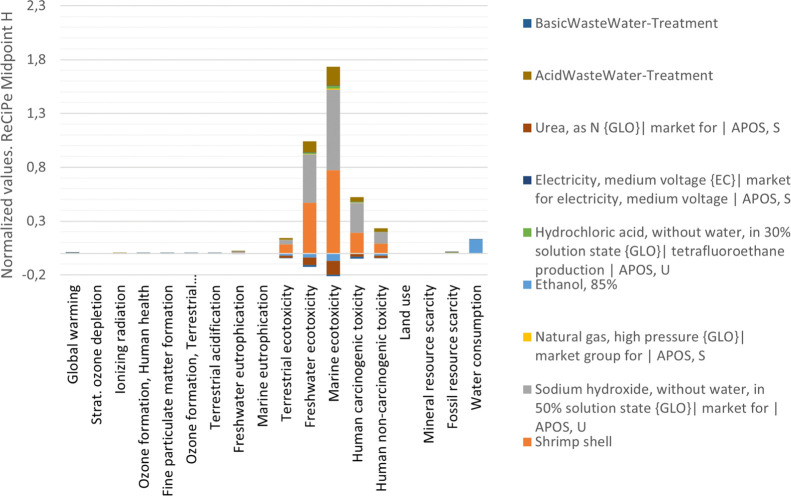
Figure 4 shows the normalized values for the 18 impact categories using the ReCiPe Midpoint H32,33 method. The normalized values given are based on the World Data (2010)32,33 and exist within SimaPro34 software. This conversion allows us to introduce the obtained production results to the real world. Additionally, these values represent how much each process pollutes compared to a single human being,35,36 making it easier to compare and analyze results. As seen in Figure 4, two main processes reach the level of contamination of a specific region, country, or geography.37 Those are freshwater ecotoxicity and marine ecotoxicity, as expected because of the high basicity needed for process conditions. Additionally, global warming has a score of 0.0074, hundred times lower than the average baseline. On the other hand, water consumption reaches a score of 0.13, which is 10 times lower than the baseline, and most of its contribution, as stated, is for sugarcane crops.
Figure 4.
Normalized impact of each process in chitosan production on the environment.
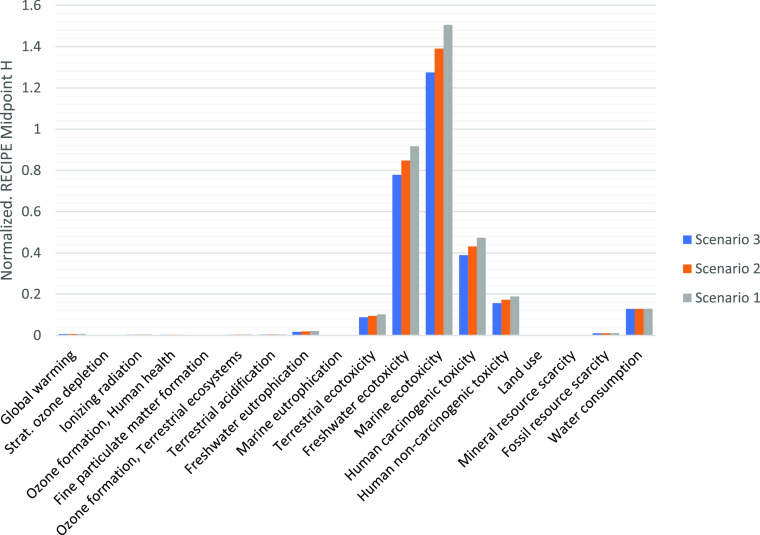
The effect of various concentrations of NaOH on chitosan production and their impact on the environment have been analyzed. For this purpose, 50 wt % (scenario 1) to 40 wt % (scenario 2) and 30 wt % (scenario 3) NaOH solutions have been taken into account to be used in the deacetylation process in chitosan production (scenario 1, 2, and 3, respectively). The deacetylation process converts chitin into chitosan, which is the most NaOH-demanding step in chitosan production. Figure 5 embodies the changes stated above, as seen in the graph that the process that uses 50 wt % NaOH solution always shows higher impact values. Data were obtained using the ReCiPe Midpoint H32,33 method. The most remarkable changes are found in the freshwater eutrophication category with 10 and 20% when lowering the amount of NaOH used in the solution, followed by the impact category of human carcinogenic toxicity.
Figure 5.
Impact assessment results considering different concentrations of NaOH (scenario 1: 50 wt % NaOH; scenario 2: 40 wt % NaOH; and scenario 3: 30 wt % NaOH).
Additionally, reducing NaOH solution to 30 wt % (scenario 3) can affect the highest score category, marine ecotoxicity, 17% lower than scenario 1. These scenarios serve as the ground for further analysis of the best conditions to produce chitosan, considering how significant the impact of the basic solution in the deacetylation process is on the environment. The detailed and comparative impact of each scenario can be seen in Table S7 in Supporting Information.
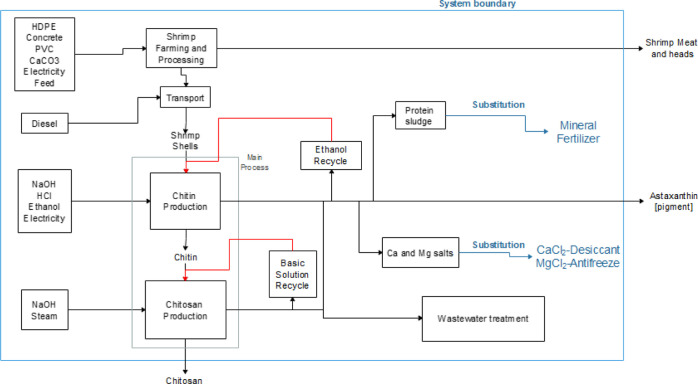
Muñoz et al.23,24 studied the life cycle of chitosan production in India and Europe. Since Muñoz considered using shrimp shells for chitosan production in India, the finding comparisons between that study and this study are very realistic. For this purpose, data reported by the study of India and Europe are compared to findings from this study. Although the analyzed product is chitosan, methodology (ILCD 2011+ MIDPOINT38), assumptions, and more key points differ from the current study. For these reasons, only comparable results have been analyzed in terms of units. It is important to differentiate that the current study considers shrimp farming, shrimp processing, ethanol production from sugarcane, and the treatment of the effluents generated by the process (for details, see Figure 10). In contrast, we found no information regarding shrimp farming in the study of Muñoz et al.23,24 but a regular wastewater treatment from SimaPro software.34
Figure 10.
System’s limits of the life cycle assessment for 1 kg chitosan production in Ecuador.
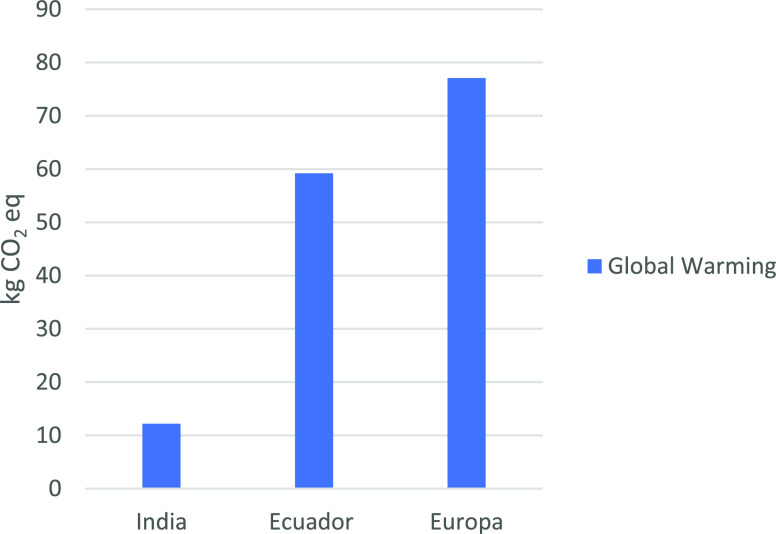
Figure 6 presents the comparison of global warming impact category results among Ecuador, India, and Europe. The current study has almost five times higher than the chitosan production in India but 1.3 times lower than the European case. The main contributors to this impact in the study are ethanol, sodium hydroxide, and shrimp shell. In contrast, for Europe, the main contributors in this category are chitin production and electricity. The highest values in chitosan production in Europe are associated with HCl production, NaOH production and disposal, transport, and heat from coal as the primary energy source for production. The highest impact contributors in India’s case are electricity and HCl production. Similarly, both in this study and Europe’s case23,24 the wastewater treatment makes a considerable contribution to the overall score of this impact category.
Figure 6.
Comparison of LCA results considering the global warming category.
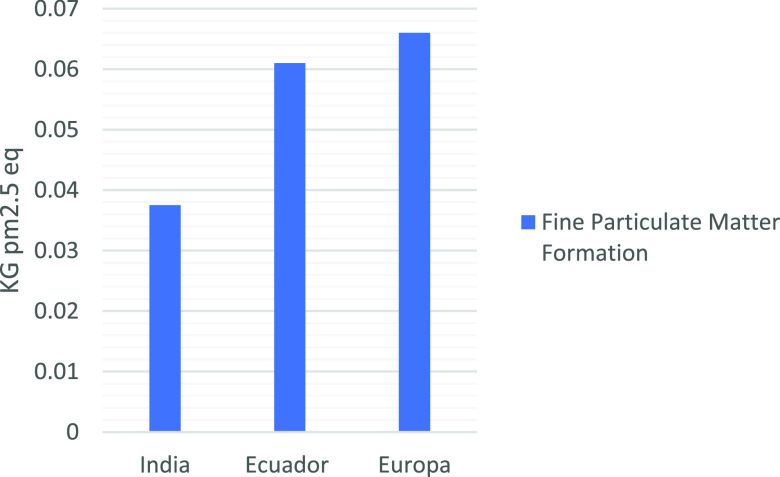
Figure 7 illustrates comparative results for the fine particulate matter category for chitosan production. The results of this study make less impact than Europe’s case but more impact than India’s case in terms of score. The higher contributions in both Indian and European cases come from biomass or coal used for heat production. In the current study, the main contributors are shrimp shell production, ethanol, and sodium hydroxide. These processes are the most energy-demanding ones. For example, diesel is used in shrimp farming and ethanol production biomass (bagasse) as an energy supply in the ethanol production system.
Figure 7.
Comparison of LCA results considering fine particulate matter formation category.
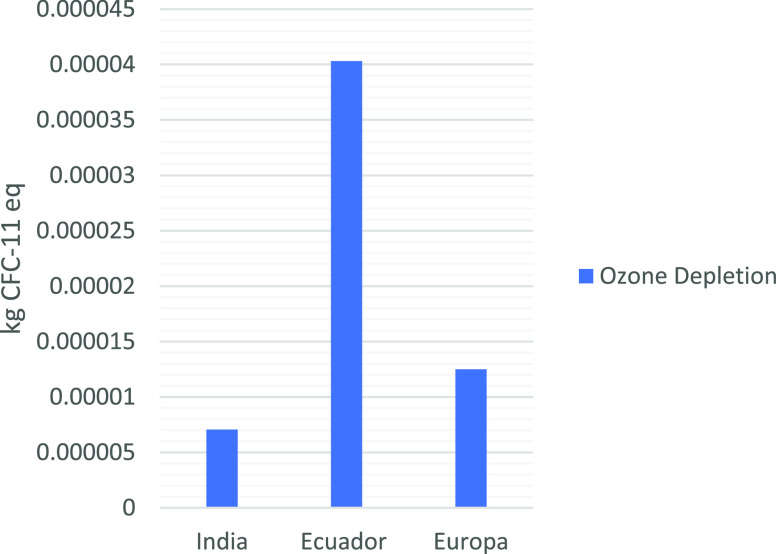
As seen in Figure 8, chitosan production in Ecuador ranks as the highest value in the ozone depletion category. This score is attributed to the sodium hydroxide production, once again a focal point for more elaborate work and a further improvement in process conditions, not only for economic but also for environmental reasons.
Figure 8.
Comparison of LCA results considering the ozone depletion category.
On the other hand, chitosan production in Ecuador shows higher values for noncarcinogenic toxicity. Because the decolorization step in chitosan production design in the current study is based on ethanol, it increases some of the environmental impacts in LCA. Besides that, Muñoz et al.23,24 did not include the decolorization step in their LCA analysis. Due to this, the current study shows a higher impact in the noncarcinogenic toxicity category.
Besides, Meramo-Hurtado et al.39 conducted an exergetic study, including the environmental impact, using an algorithm (abbreviated as WAR) to reduce waste. The normalized value obtained by Meramo-Hurtado et al. for global warming was 2.44 × 10⁻⁴ PEI/kg, while the value obtained in this study reaches a value of 6.23 × 10⁻² PEI/kg, which shows a noticeable increase in climate change potential. The higher scores obtained in this study are primarily because of the more processes impacting the environment than similar literature.23,24,39 Even with more processes considered, the current study showed scores below the baseline. The higher values obtained in this study can be attributed to the type and the method for environmental impact assessment. Because while Meramo-Hurtado et al. only assessed the process,39 the current study includes the life cycle assessment of chitosan with many more stages and more profound environmental impact contributions.
Leceta et al.40 carried out a comparative LCA study between polypropylene (PP) and chitosan-based packaging films in a 1 m2 functional unit. Leceta et al.40 used the Eco-Indicator 99 method, while in this study, the ReCiPe Midpoint method32,33 has been used. However, both methods comply with a hierarchy (H) view of impacts. The results for their specific types of environmental impact indicators have a range between 10–9 and 10–5 in Leceta and co-workers’ study. For instance, the land use indicator for the PP film has a value of 4.1 × 10⁻⁶ PEI/m2, while raw chitosan has a value of 8.5 × 10⁻⁴ PEI/kg. Their study’s impact values are mostly lower than the values presented in this study because chitosan films prepared by Leceta et al.40 require 15 wt % of glycerol, and the difference between the functional units (1 kg to 1 m2) does not represent the same amount of chitosan. Chitosan-based products have more significant environmental advantages than using any other synthetic material type, even more, when considering that its waste is also eco-friendly.
Suwanmanee and Lertworasirikul reported the LCA of chitosan solutions (0.5–2.0%) for papaya coating41 using the CML 2 Baseline 2000 method considering especially three impact categories, marine ecotoxicity, global warming, and human toxicity. The authors indicated that the areas that make significant impacts are related to using hazardous chemicals and electricity-based energy to carry out the process. Once again, the main difference in the current study’s findings is the amount of chitosan analyzed. However, both studies concord that further analysis of chemical demand in the chitosan process focuses on this biopolymer to become even more desirable soon as an industry.
A sensitivity analysis was conducted where the ethanol consumption and shrimp shell usage were varied. These two parameters were defined as the processes with the most uncertainty. The ethanol production process involves several steps such as cane production, sugar and molasses production, and fermentation to obtain ethanol. The shrimp shell has the shrimp farming and processing processes. Both parameters have several chain block activities linked to those quantities. Thus, changes in quantity could have the potential variations in the impact assessment.
Figures S1 and S2 show the results for the characterized impact categories for the sensitivity analysis. Figure S1 displays changes when ethanol quantities for the process are modified. It exhibits, for most categories, a very slight change in the impact assessment. However, 15% or more change in the impact can be found in Marine eutrophication, land use, and water consumption with an increase in the amount of alcohol used in the process. The more the ethanol is used, the more the water and more the crops are needed.
Another impacted category is global warming. Increasing the amount of ethanol from −10 to +10%, the normalized value for this category varies from 7.52 × 10⁻³ to 8.03 × 10⁻³. This change is about 6.7% increase in the impact category mentioned. There are other categories where there are no significant changes; for instance, marine ecotoxicity with normalized values changing from 1.51 to 1.52 by the variation in the amount of ethanol considered.
On the other hand, Figure S2 displays changes when the shrimp shell amount is changed between −10 and +10%. In the same way, when analyzing the global warming category, the sensitivity can be assessed. A decrease of 5% in the quantity of shrimp shell gives a normalized value of 7.25 × 10⁻³, and an increase of 10% gives a score of 7.83 × 10⁻³. Once again, a variation of 8% increase in the impact category with respect to the total change of 20% in the quantity of shrimp shell is used. All these results indicate that the assumptions and theoretical model were well adjusted.
As seen in the figure, the changes do not make a significant impact. Therefore, it can be said that system has been appropriately configurated. In addition, Figures S1 and S2 exhibit a direct linear relationship between the variables analyzed by a reliable and robust system.
Besides the changes in quantities analyzed for sensitivity analysis, two different methods have also been used for LCA to compare the results with the ReCiPe Midpoint H32,33 method (see Table S8). For this purpose, the environmental impacts of chitosan production (scenario 1) have been analyzed with TRACI 2.142 and ILCD 2011+ MIDPOINT38 methods (see Table S8). As these two new methods take specific geography and categories into account, units and values change accordingly. Despite this fact, ReCiPe Midpoint H32,33 shows an extensive overview of impacts, perhaps considered the more detailed and precise method.43,44 Figure S3 (in Supporting Information) shows the contribution and scores for normalized impact categories for three different methods. When the results of each method have been analyzed, it is seen that the only method that analyzed all the impact categories is ReCiPe Midpoint H.32,33 The TRACI 2.142 method showed two different categories, which are not included in those 18 categories. The categories such as smog or respiratory effects are unique to TRACI 2.1.42 Furthermore, in categories such as water consumption or noncarcinogenic toxicity, normalized results for the ReCiPe Midpoint H32,33 are slightly higher than ILCD 2011+ MIDPOINT.38
A more realistic environmental impact analysis could be carried out if there were data from the Ecuadorian industry. The impact score obtained by the ReCiPe Midpoint H32,33 method could be much lesser if shrimp shells and ethanol are not the main products of their production processes.
3. Conclusions
In this work, an economic and environmental feasibility study was carried out as a decision tool for a potential investor to initiate economic activities using shrimp shells in a marketable value-added product such as chitosan. This work’s strength relies on the weight that it provides to show effects on the environment while considering that the purpose of any entrepreneurial activity is to generate profit. The first work of this nature in Ecuador was applied to this agro-industrial waste shrimp shell, laying the foundations for industrial and business proposals to consider the methodology and environmental analysis carried out in this work. Furthermore, an environmental impact analysis of chitosan production using the ReCiPe Midpoint H method32,33 has also been carried out. The most impacted categories among those 18 parameters are marine and freshwater ecotoxicity and human carcinogenic toxicity. The concentration of NaOH used for both deacetylation and deproteinization processes impacts some categories directly, while ethanol recycling can significantly reduce the environmental impact. Among the methods used for life cycle assessment’s sensitivity analysis of chitosan production, the ReCiPe Midpoint H method32,33 is more detailed and precise. Besides, the changes in the amounts of shrimp shell and ethanol simulated for sensitivity analysis do not significantly impact the environment.
It can be concluded that chitosan production in Ecuador has repercussions on the ecosystem as any other industrial activity. However, when compared to other studies, lower impacts were reached. Furthermore, according to indicators presented, chitosan production in Guayas-Ecuador is economically viable with a good margin for profit and rapid investment recovery. Besides, chitosan production in Ecuador has one of the lowest costs among the studies analyzed. This new industry can compete with other countries’ industries established in the market.
4. Methods
The methodology of this study has been divided into three main stages: (1) process definition, process conditions, and identifying possible equipment needed, (2) calculation of the dimensions of the equipment, input of raw materials and output of the product, and costs of raw materials and equipment, and (3) establishing the life cycle objective, functional unit, limits, and method for calculating the environmental impact.
Therefore, the methods presented are related to the potential chitosan production plant located in Guayas province in Ecuador. Most of the shrimp production (∼60%) in Ecuador takes place in this province,45 making this region the ideal location for the plant design to minimize transport costs and rapid availability of the raw material.
4.1. Chitosan Production Process
The chitosan production process is divided into two main steps: isolation (extraction) of chitin and its conversion into chitosan by alkaline deacetylation. There are two ways to produce chitosan: a chemical or a biological path.12,46 However, the chemical production method has been considered for this study because of its low cost and accessible reagent availability.
The chemical production of chitosan is well defined in the literature. The main stages involved are deproteinization, demineralization, and decolorization, which result in chitin isolation and then deacetylation of chitin to obtain chitosan.18,22,29Figure 9 shows the block diagram for the chitosan production process established with the main stages and secondary stages needed to obtain high-quality chitosan.
Figure 9.
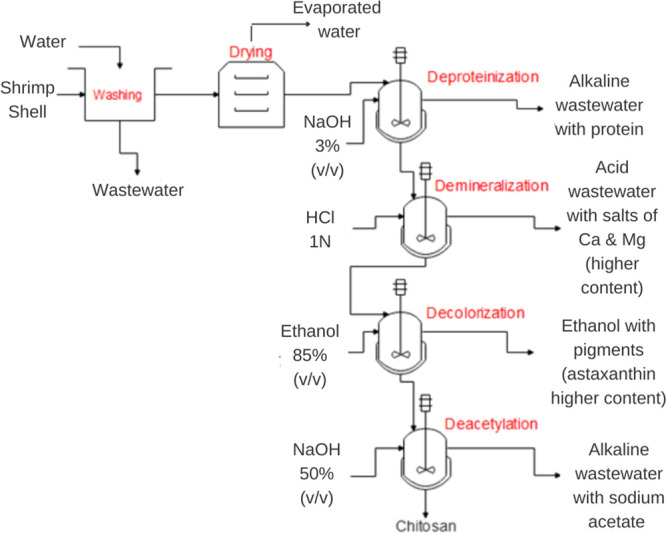
Chitosan production block diagram.
Table 3 presents all process conditions for the primary reaction stages and secondary stages such as shrimp shell drying. These conditions were based on the literature review and proven by the experimental procedure at small-scale production of chitosan. Besides, the rough material balance to produce chitosan is as follows:
Washing and drying the shrimp shells: Exoskeletons lose 70–80% of the weight.
Reduction of the shell size to obtain a higher surface area.
Deproteinization step where 33–40% of the dry weight is lost as proteins.
Demineralization step: possible calcium- and magnesium-based minerals are removed, which corresponds to 30–35% of the dried deproteinized shrimp shells.
Decolorization step: removal pigments from the shrimp shells correspond to a small amount of dried shrimp shells.
Table 3. Chitosan Production Process Conditions and Steps (1–4).
| deproteinization |
demineralization |
decolorization |
deacetylation |
||||
|---|---|---|---|---|---|---|---|
| factor | description | factor | description | factor | description | factor | description |
| NaOH (% w/v) | 3 | HCl | 1N | ethanol-C2H5OH | 85% | NaOH (% w/v) | 50% |
| shrimp shell/alkaline solution proportion (w/v) | 1:10 | shrimp shell/acid solution proportion (w/v) | 1:15 | shrimp shell/alkaline solution proportion (w/v) | 1:03 | chitin/alkaline solution proportion (w/v) | 1:10 |
| temperature (°C) | 65 | temperature (°C) | 25 | temperature (°C) | 40 | temperature (°C) | 100 |
| time (h) | 2 | time (h) | 6 | time (h) | 1 | time (h) | 5 |
Taking all the steps mentioned above, only 20–25% of chitin can be extracted from the shrimp shells’ dry weight;22,31,47 then, approximately 1.2 kg of chitin is needed to produce 1 kg of chitosan. Therefore, according to the numbers given, the yield of conversion of the chitin into chitosan is ∼83%. The biological variability of the shrimps changes the expected ranges in which the material balance is performed.
4.2. Economic Viability Analysis
With the steps involved in the process, the material balance, and process conditions, the next step in the economic analysis is to define other parameters needed to know the dimensions of the equipment in the designed plant. One of these parameters is the quantity of shrimp shells that the plant will process. As we know, there are 72,000 tons of shrimp shells available each year, from which it was chosen 5000 thousand tons (7% of the total) to be processed each year in the plant. This amount is equal to the conversion of 2.77 tons of shrimp shells in a day, which allows us to design the equipment needed for the daily intake of raw materials.
Two primary cost estimation sources have been used in the study. The first one is an excel-based design tool, CapCost,28 which is a well-known chemical engineering design software that has many equipment options and parameters that allow quicker estimations. The second one is based on Alibaba,48 a robust online cost estimation facility to estimate the cost for importing the equipment at low prices.
For this purpose, the equipment’s dimensions needed input into CapCost28 software for the cost estimations for the equipment available in the program, considering the installation cost of the equipment and other parameters (see Table 4). While if any equipment was not available in CapCost,28 then a search in Alibaba was carried out, and the obtained results were added manually to CapCost28 software. In both cases, importation fees are considered to raise each piece of equipment by about 80%.
Table 4. Dimensions and the Cost of the Equipment Necessary.
| equipment | costs (USD) | dimensions | source |
|---|---|---|---|
| semiautomatic washer | $2500 | 2.60 m × 0.85 m × 0.80 m | Alibaba49 |
| dryer | $15,500 | 1.20 m × 1.50 m | CapCost28 |
| mill | $15,000 | 7.10 m × 1.30 m × 3.65 m | Alibaba50 |
| batch reactor deproteinization | $196,000 | 7 m3 | CapCost28 |
| batch reactor demineralization | $125,000 | 3 m3 | CapCost28 |
| batch reactor deacetylation | $92,300 | 1.70 m3 | CapCost28 |
| ethanol recovery | $85,000 | 2.30 m × 0.7 m × 7 m | Alibaba51 |
| Nutsche filters (4 filters) (44–170 μm) | $207,000 | 6.40 m3, 2.79 m3, 2.79 m3 | Alibaba52 |
| pumps (4) | $83,100 | 1.40 bar | CapCost28 |
| storage tank (5) | $102,000 | 10 m3 c/u | Alibaba53 |
| water deionizer | $3500 | 2000 L/h | Alibaba54 |
| boiler | $150,000 | 2 ton/h | Alibaba55 |
Each equipment’s energy requirements were then typed in the energy cost estimation program. The corresponding cost analysis of energy consumption of all the equipment (see Table 5) has been carried out considering the average electricity rate in Ecuador as $30.55 per GJ.56 The next step is to input the cost and flow of the raw material, reagents, and every chemical needed in each process, as shown in Table 5. The table shows the values estimated for the current design.
Table 5. Market Prices of the Raw Material, Reagents, and Products.
| material | classification | price ($/kg) | flow rate (kg/h) |
|---|---|---|---|
| chitosan | product | $(58.00) | 15.20 |
| NaOH | reagent | $0.57 | 94.00 |
| HCl | reagent | $0.39 | 52.00 |
| shrimp shell | raw material | $0.10 | 277.00 |
| ethanol | reagent | $1.20 | 76.00 |
| sodium bicarbonate (waste treatment) | reagent | $0.27 | 25.00 |
| carbon dioxide (waste treatment) | reagent | $0.12 | 88.00 |
Finally, other parameters such as land cost, taxes, and labor cost were estimated either by directly entering data or with the software’s aid (see Table 6). The parameters considered are an industrial site at Inmaconsa industrial park57 in Guayaquil-Ecuador ($400,000.00), taxation rates ranging from 11 to −18% (15% chosen),58 and labor cost $800 per operator, which is much higher than the basic monthly salary of $407 in Ecuador.59 Once all these data are appropriately input into the software, it allowed us to calculate the economic parameters such as cash flow, rate of return, and net present value.
Table 6. Estimated Energy Consumption.
| equipment | utility | energy (kW) |
|---|---|---|
| dryer | electricity | 119 |
| pumps | electricity | 1.16 |
| reactor-1 | LPS | 260 |
| reactor-2 | LPS | 150 |
| reactor-3 | LPS | 100 |
| mill | electricity | 13.30 |
| Nutsche filter | electricity | 13.30 |
| ethanol recovery | LPS | 400 |
| boiler | GLP | 4.70 |
4.3. Environmental Impact Assessment
As any new business or industry that begins its activities in the country by law, they are compelled to present a detailed environmental impact report about the process included in the production. Hence, information considering more complex relations between main processes and the actual environmental concerns has been reported in this study.
4.3.1. Goal
The goal is to provide quantitative life cycle data as a critical point in a robust investment and environmental report to produce chitosan in Guayas-Ecuador.
4.3.2. Scope
Chitosan production’s life cycle has been assessed to quantify its impact as a new Ecuadorian industry as a start-up. The research scheme of study begins with shrimp production and shrimp farming, as their shells are the raw material. Besides, the transportation of the raw material to chitosan production and storage facility has also been considered.
Following, chitosan production has been modeled using situation A among the situations included in the ILCD Handbook (European Commission–Joint Research Centre–Institute for Environment and Sustainability, 2010),60 where chitosan would be produced in the assigned geography (Guayas-Ecuador). The innovative part of this study is that no chitosan has been produced in Ecuador despite abundant raw material and shrimp shells.
Furthermore, data have been obtained basically from the literature. Some background processes use average market consumption/production processes found in the libraries of SimaPro34 software.
4.3.3. Functional Unit
The system has a functional unit of 1 kg of chitosan produced by chemical conversion of the shrimp shells from the waste of the Ecuadorian shrimp production industry as a ready to be commercialized chemical product (Business-to-Business) in Guayas-Ecuador.
The detailed life cycle assessment report and inventory analysis can be found in Tables (S1–S8) in the additional Supporting Information.
4.3.4. System Boundaries
The system considers the environmental impacts of producing chitosan and considers the effects of the raw material and reagents required. Water treatment is contemplated within the production activity as legally required by the state and aiming to minimize the impact from this effluent. Moreover, energy sources and quantity are examined, where vapor production is needed for some equipment, and the rest of the energy comes from the state grid. Figure 10 shows the system limits for our life cycle assessment of chitosan, with inlets and outlets.
4.3.5. Inventory Analysis
SimaPro34 software (with 1 year non-OECD SimaPro Faculty license) is used for the LCA, which requires input data to be transformed into environmental indicators. These data include reagents, materials, raw material, and even the energy needed in each step covered by the system mentioned before.
Inventory analysis is an extensive component of the LCA because every aspect and step of the process and reagent production processes must be included. The processes and reagents included are Ecuador’s power and type of power grid and the materials needed to produce shrimp,61,62 ethanol,63−65 sodium hydroxide, and hydrochloric acid.
4.3.6. Power Grid
The energy source considered in this study is based on an electricity grid, medium voltage for Ecuador found in SimaPro34 software. It is assumed that conversion to low voltage is performed within the factory. The energy mixture follows the array presented in Table 7. The total energy sources used for electricity production in Ecuador are based on the report of the Electricity Regulation and Control Agency in 2018.66
Table 7. Electricity Generation by the Fuel Type.
| energy source | percentage |
|---|---|
| nonrenewable | 39.24 |
| hydro | 58.45 |
| biogas | 0.09 |
| solar | 0.32 |
| biomass | 1.66 |
| wind | 0.24 |
4.3.7. Carbon Dioxide in Chitosan
Chitosan’s chemical structure has a repeating unit of C6H11NO4, with a carbon content of 0.45 kg per kg of chitosan. Then, chitosan stores approximately 1.64 kg of CO2 per kilogram based on the stoichiometry.23 The carbon that chitosan has does not get converted into CO2. This is why it is considered carbon credit. Therefore, this reality can positively impact the environment as this carbon content will not end up in the environment as CO2.
4.3.8. Chitosan Production
4.3.8.1. Shrimp Farming and Processing
LCA data for shrimp farming were based on the study of Cao et al.62 which is semi-intensive farming. It is also the most common farming type in Ecuadorian aquaculture. Thus, these data were chosen where 30% weight is associated with the shell, the raw material. In addition, shrimp processing67 is also included where shrimp meat is removed from the head and shells and stored for domestic consumption or exports. The detailed inventory of this section can be seen in Table S1 in Supporting Information.
The shrimp shell’s chemical composition was based on average data from different sources, where median values were chosen as the input in the life cycle inventory of this study.22,23,68,69 The raw shrimp shell contains 70–80% of water.70−72 Therefore, the dried shrimp shell to be used in the chitin extraction process is around 20%.
4.3.8.2. Chitin Processing
This step involves demineralization and deproteinization processes needing effluent treatment (see Tables S2 and S3 in Supporting Information). Additionally, this step requires some type of neutralization.
The demineralization process is based on the data that the shrimp shell contains 35% of minerals as an average, as stated in Table 8. It is known that the significant part of these minerals are calcium salts and mostly calcium carbonate.70−72 Theoretically, to remove carbonates and phosphates from the shell, 1.86 kg of HCl(aq) is required. However, an excess amount of HCl(aq) has been taken into account to assure that the chitin is demineralized and obtained with a high yield. Therefore, 3.1 kg of HCl(aq) is used in the system, so the excess of acidity in the effluent is considered to be treated afterward. Sodium bicarbonate was used as the neutralization of acidic wastewater. The treatment process produces calcium chloride and other compounds that can be recovered for later use as desiccants. Detailed inventory for this step in chitosan production is presented in Table S4 in Supporting Information.
Table 8. Chemical Composition of the Dry Shrimp Shell.
| component | percentage % |
|---|---|
| chitin | 20–25 |
| protein | 35–40 |
| minerals | 32–38 |
| fat | 0.30–0.50 |
| water | 3–5 |
| astaxanthin | 0.40–0.50 |
| ashes | 2–3 |
The average protein content in the deproteinization process is estimated as 35% (see Table 8). The theoretical22 consumption of NaOH is 0.858 kg, but once again, excess, 1.766 kg, of NaOH has been included in LCA calculations. The wastewater effluent must not be disposed to the municipal wastewater system because of its high basicity. Therefore, wastewater treatment was taken into account. Protein can be recovered and used as fertilizer or animal feed. According to Boldrin,73 a kilogram of protein recovered replaces 0.4 kg of mineral fertilizer. An amount of HCl(aq) is also considered to lower the pH to 5.5 to precipitate the protein. Inventory data for the alkaline wastewater treatment are shown in Table S3 in Supporting Information.
SimaPro34 libraries only have maize as the primary raw material for ethanol production. However, in Ecuador, ethanol is produced mainly as a coproduct of the sugarcane industry. For this reason, a new process based on the literature and data was created to adjust the reality of the Ecuadorian industry.63−65,74 Details for the ethanol production process can be seen in Table S4 in Supporting Information.
The chitin extraction process requires the use of HCl(aq), NaOH, and ethanol, while conversion of chitin into chitosan needs only a strong NaOH solution (scenario1: 50 wt %). As aforementioned, excess amounts of HCl(aq) (3.1 kg), NaOH (1.766 kg), and ethanol (4.27 kg) have been considered in the chitin extraction process. The conversion of chitin into chitosan requires 8.75 kg of NaOH.
The potential losses of ethanol and sodium hydroxide (deacetylation) were defined as 2 and 1%, respectively. Sodium acetate production in chitin–chitosan conversion with an 85% deacetylation yield was calculated using the average molecular weight of chitin between 200 and 500 × 105 Da. The results showed a negligible amount of sodium acetate. This is why sodium acetate was not included in the environmental impact assessment calculation.
The production processes of both chitin and chitosan in LCA analysis have been included in the same input file to avoid any type of recounting of environmental impacts. Additionally, water consumption reaches 300 L for preparations of solutions in the 1 kg chitosan production process. However, additional water is needed to neutralize and wash the solid products at each step in the process. Therefore, the total water consumption is around 446 L. Details for this process are shown in Table S5 in Supporting Information.
4.3.9. Impact Analysis Method
ReCiPe Midpoint H32,33 is the only method applied globally, providing the right approach. This method provided within SimaPro34 analyzes 18 different environmental impact indicators (see Figures 3 and 4). Moreover, the H (hierarchy) is a moderate cultural perspective used as a consensus model by default.32,33
There is not a standard normalization process defined by ISO 14040.75 However, it is considered essential when comparing the results of different methods and scenarios in LCIA or to make a decision about the environmental impact. In this study, ReCiPe World Data 201032,76,77 normalization parameters provided by SimaPro34 have been used by default. Therefore, the normalization was used as a tool for better interpretation of the results obtained by the LCIA method. Because the normalized results are without units, they are easy to be used for any comparison to another method’s results. Hence, any reader who does not have knowledge about LCA can get an idea when he/she analyzes the normalized results.
4.3.10. Sensitivity
In addition, a sensitivity analysis was performed to address uncertainties in the inputted data. ISO 140044 does not have an established methodology. However, according to the literature of past sensitivity studies63,64,78−80 and the ILCD handbook,60 the proposed sensitivity analysis has been performed. Sensitivity analysis is carried out to check whether some changes in the processes or the LCA method used affect the environmental impact assessment or not. It was found out that variation in these two key points has a direct impact on the results. Analyzing the variations and their impacts can assess that the LCA data had a high uncertainty or acceptable quality of data. Table S8 and Figures S1–S3 (in Supporting Information) show the changes addressed by the analysis.
Acknowledgments
We would like to express our deepest appreciation to the Pré Sustaintability team for giving us the opportunity and permission to use SimaPro software.34 Also, we would like to thank Escuela Superior Politécnica del Litoral and the Faculty of Natural Science and Mathematics for allowing us the use of space, equipment, and resources to properly define our production process. Finally, we thank Angel Ramirez and Silvia Mariela Mendez Prado, professors from ESPOL, for their feedback on this study.
Supporting Information Available
The Supporting Information is available free of charge at https://pubs.acs.org/doi/10.1021/acsomega.1c01672.
Shrimp farming (semi-intensive) and processing inventory, demineralization wastewater inventory, deproteinization wastewater inventory, ethanol production inventory, chitosan production inventory, chitosan impact assessment results for 1 kg of chitosan production in Guayas-Ecuador, chitosan production scenarios’ comparison varying NaOH concentration (wt % 30–40–50% NaOH solution), normalized sensitivity analysis results by changing the method used, sensitivity analysis results based on different amounts of ethanol used, sensitivity analysis results based on different amounts of shrimp shell used, and sensitivity analysis results by changing the LCIA method (PDF)
Shrimp farming (semi-intensive) and processing input data, ethanol 85% production input data, molasses production input data, sugarcane production input data, chitosan scenario 1 production input data, chitosan scenario 2 production input data, chitosan scenario 3 production input data, acid waste stream input data, alkaline waste stream input data, chitosan scenario 1–2–3 result output data, chitosan scenario 1–2–3 normalized result output data, freshwater ecotoxicity output data, human carcinogenic toxicity output data, marine ecotoxicity output data, sensitivity ethanol output data, sensitivity shrimp farming output data, and sensitivity impact assessment output data (XLSX)
The authors declare no competing financial interest.
Supplementary Material
References
- Cole M.; Lindeque P.; Halsband C.; Galloway T. S. Microplastics as Contaminants in the Marine Environment: A Review. Mar. Pollut. Bull. 2011, 62, 2588–2597. 10.1016/j.marpolbul.2011.09.025. [DOI] [PubMed] [Google Scholar]
- Wright S. L.; Thompson R. C.; Galloway T. S. The Physical Impacts of Microplastics on Marine Organisms: A Review. Environmental pollution 2013, 178, 483–492. 10.1016/j.envpol.2013.02.031. [DOI] [PubMed] [Google Scholar]
- Ravi Kumar M. N. V. A Review of Chitin and Chitosan Applications. React. Funct. Polym. 2000, 46, 1–27. 10.1016/s1381-5148(00)00038-9. [DOI] [Google Scholar]
- Ahmed S.; Ikram S. Chitosan & Its Derivatives: A Review in Recent Innovations. Int. J. Pharm. Sci. Res. 2015, 6, 14–30. 10.13040/IJPSR.0975-8232.6(1).14-30. [DOI] [Google Scholar]
- Al-Manhel A. J.; Al-Hilphy A. R. S.; Niamah A. K. Extraction of Chitosan, Characterisation and Its Use for Water Purification. J. Saudi Soc. Agric. Sci. 2018, 17, 186–190. 10.1016/j.jssas.2016.04.001. [DOI] [Google Scholar]
- Jayakumar R.; Prabaharan M.; Nair S. V.; Tamura H. Novel Chitin and Chitosan Nanofibers in Biomedical Applications. Biotechnol. Adv. 2010, 28, 142–150. 10.1016/j.biotechadv.2009.11.001. [DOI] [PubMed] [Google Scholar]
- Jayakumar R.; Menon D.; Manzoor K.; Nair S. V.; Tamura H. Biomedical Applications of Chitin and Chitosan Based Nanomaterials - A Short Review. Carbohydr. Polym. 2010, 82, 227–232. 10.1016/j.carbpol.2010.04.074. [DOI] [Google Scholar]
- Rabea E. I.; Badawy M. E.-T.; Stevens C. V.; Smagghe G.; Steurbaut W. Chitosan as Antimicrobial Agent: Applications and Mode of Action. Biomacromolecules 2003, 4, 1457–1465. 10.1021/bm034130m. [DOI] [PubMed] [Google Scholar]
- Elsabee M. Z.; Abdou E. S. Chitosan Based Edible Films and Coatings: A Review. Mater. Sci. Eng., C 2013, 33, 1819–1841. 10.1016/j.msec.2013.01.010. [DOI] [PubMed] [Google Scholar]
- Kong M.; Chen X. G.; Xing K.; Park H. J. Antimicrobial Properties of Chitosan and Mode of Action: A State of the Art Review. Int. J. Food Microbiol. 2010, 144, 51–63. 10.1016/j.ijfoodmicro.2010.09.012. [DOI] [PubMed] [Google Scholar]
- Younes I.; Rinaudo M. Chitin and Chitosan Preparation from Marine Sources. Structure, Properties and Applications. Mar. Drugs 2015, 13, 1133–1174. 10.3390/md13031133. [DOI] [PMC free article] [PubMed] [Google Scholar]
- Hirano S.Chitin and Chitosan. In Ullman’s Encyclopedia of Industrial Chemistry; Gehartz W., Schulz T., Elvers B., Hawkins S., Winter U., Eds.; Wiley, 2005; pp 5116–5128. [Google Scholar]
- Victor O.; Kingsley Chukwuemeka P.-I.; Eucharia Oluchi N. Heavy Metals Contents and Health Risk Assessment of Classroom Corner Dusts in Selected Public Primary Schools in Rivers State, Nigeria. J. Environ. Pollut. Hum. Health 2018, 6, 138–147. 10.12691/jephh-6-4-3. [DOI] [Google Scholar]
- Corporación Financiera Nacional . Ficha Sectorial Sector Manufacturero. Alimentos Preparados y Bebidas, 2017; p 16.
- Berrezueta S.Propuesta de Un Plan de Negocio Para Producir y Comercializar Quitina y Quitosano Como Materia Prima Biodegradable. Bachelor Thesis, University of Guayaquil, 2014. [Google Scholar]
- Andrade P.Estudio de Viabilidad de Ecportación de Desechos Procesados de Camaron Generados Por Las Mayores Exportadoras Ecuatorianas Hacia China. Engineer in Sciences Business Thesis, Universidad de Especialidades Espiritu Santo, 2013. [Google Scholar]
- Changoluisa D.; Sánchez E.. Análisis de La Demanda Internacional de Quitosano a Base de Camaron. Bachelor Thesis, University of the Armed Forces ESPE, 2016. [Google Scholar]
- Chavez D.; Lopez M.. Factibilidad Técnica Para El Aprovechamiento Integral Del Camarón de La Especia Penaeus Vannamei. Bachelor Thesis, ESPOL, 2009. [Google Scholar]
- Goedkoop M. J.; Heijungs R.; Huijbregts M. A. J.; De Schryver A.; Struijs J.; van Zelm R.. ReCiPe 2008: A Life Cycle Impact Assessment Method Which Comproses Harmonised Category Indicators at the Midpoint and the Endpoint Level, 2013; p 126.
- Goedkoop M.; Heijungs R.; Huijbregts M.; De Schryver A.; Struijs J.; van Zelm R.. ReCiPe 2008. Potentials, 2009; pp 1–44.
- Piccinno F.; Hischier R.; Seeger S.; Som C. Life Cycle Assessment of a New Technology to Extract, Functionalize and Orient Cellulose Nanofibers from Food Waste. ACS Sustainable Chem. Eng. 2015, 3, 1047–1055. 10.1021/acssuschemeng.5b00209. [DOI] [Google Scholar]
- Gómez-Ríos D.; Barrera-Zapata R.; Ríos-Estepa R. Comparison of Process Technologies for Chitosan Production from Shrimp Shell Waste: A Techno-Economic Approach Using Aspen Plus®. Food Bioprod. Process. 2017, 103, 49–57. 10.1016/j.fbp.2017.02.010. [DOI] [Google Scholar]
- Muñoz I.; Rodríguez C.; Gillet D.; M Moerschbacher B. Life Cycle Assessment of Chitosan Production in India and Europe. Int. J. Life Cycle Assess. 2018, 23, 1151–1160. 10.1007/s11367-017-1290-2. [DOI] [Google Scholar]
- Muñoz I.; Rodríguez C.; Gillet D.; Moerschbacher B. M. Erratum to: Life Cycle Assessment of Chitosan Production in India and Europe. Int. J. Life Cycle Assess. 2018, 23, 1161–1162. 10.1007/s11367-017-1357-0. [DOI] [Google Scholar]
- Shariatinia Z. Pharmaceutical Applications of Chitosan. Adv. Colloid Interface Sci. 2019, 263, 131. 10.1016/j.cis.2018.11.008. [DOI] [PubMed] [Google Scholar]
- Li H.; Gao X.; Wang Y.; Zhang X.; Tong Z. Comparison of Chitosan/Starch Composite Film Properties before and after Cross-Linking. Int. J. Biol. Macromol. 2013, 52, 275–279. 10.1016/j.ijbiomac.2012.10.016. [DOI] [PubMed] [Google Scholar]
- Wang H.; Qian J.; Ding F. Emerging Chitosan-Based Films for Food Packaging Applications. J. Agric. Food Chem. 2018, 66, 395. 10.1021/acs.jafc.7b04528. [DOI] [PubMed] [Google Scholar]
- Turton R.CapCost; Prentice Hall Publishing, 2017.
- Moreno J.Estudio de Viabilidad de Una Planta de Producción de Quitosano. Master thesis, Industriales, 2019. [Google Scholar]
- Roberts G. Thirty Years of Progress in Chitin and Chitosan. Prog. Chem. Appl. Chitin Its Deriv. 2008, XIII, 7–15. [Google Scholar]
- Cogollo-Herrera K.; Bonfante-Álvarez H.; De Ávila-Montiel G.; Barros A. H.; González-Delgado Á. D. Techno-Economic Sensitivity Analysis of Large Scale Chitosan Production Process from Shrimp Shell Wastes. Chem. Eng. Trans. 2018, 70, 2179–2184. 10.3303/CET1870364. [DOI] [Google Scholar]
- Huijbregts M. A. J.; Steinmann Z. J. N.; Elshout P. M. F.; Stam G.; Verones F.; Vieira M.; Zijp M.; Hollander A.; van Zelm R. ReCiPe2016: A Harmonised Life Cycle Impact Assessment Method at Midpoint and Endpoint Level. Int. J. Life Cycle Assess. 2017, 22, 138–147. 10.1007/s11367-016-1246-y. [DOI] [Google Scholar]
- National Institute for Public Health and the Environment . ReCiPe 2016 v1.1, 2017.
- Pré-Sustaintability B.V. SimaPro 9.0, 2019.
- Aymard V.; Botta-Genoulaz V. Normalisation in Life-Cycle Assessment: Consequences of New European Factors on Decision-Making. Supply Chain Forum 2017, 18, 76–83. 10.1080/16258312.2017.1333385. [DOI] [Google Scholar]
- Pizzol M.; Laurent A.; Sala S.; Weidema B.; Verones F.; Koffler C. Normalisation and Weighting in Life Cycle Assessment: Quo Vadis?. Int. J. Life Cycle Assess. 2017, 22, 853–866. 10.1007/s11367-016-1199-1. [DOI] [Google Scholar]
- Crenna E.; Secchi M.; Benini L.; Sala S. Global Environmental Impacts: Data Sources and Methodological Choices for Calculating Normalization Factors for LCA. Int. J. Life Cycle Assess. 2019, 24, 1851–1877. 10.1007/s11367-019-01604-y. [DOI] [Google Scholar]
- European Commission–Joint Research Centre–Institute for Environment and Sustainability . Technical Notes for Characterisation Factors of the ILCD Recommended Life Cycle Impact Assessment Methods, 2012.
- Meramo-Hurtado S.; Alarcón-Suesca C.; González-Delgado Á. D. Exergetic Sensibility Analysis and Environmental Evaluation of Chitosan Production from Shrimp Exoskeleton in Colombia. J. Cleaner Prod. 2020, 248, 119285. 10.1016/j.jclepro.2019.119285. [DOI] [Google Scholar]
- Leceta I.; Guerrero P.; Cabezudo S.; Caba K. d. l. Environmental Assessment of Chitosan-Based Films. J. Cleaner Prod. 2013, 41, 312–318. 10.1016/j.jclepro.2012.09.049. [DOI] [Google Scholar]
- Suwanmanee S.; Lertworasirikul S.. Environmental Impact Assessment of Coating Fresh-Cut Papaya Cv. Holland with Chitosan. Proceedings of 35th the IIER International Conference, 2015; pp 31–34.
- Bare J.Tool for the Reduction and Assessment of Chemical and Other Environmental Impacts (TRACI) TRACI Version 2.1 User’s Guide; U.S. Environmental Protection Agency, 2012; 600/R-12/5 (August), p 24.
- Tobergte D. R.; Curtis S.. ILCD Handbook, 2013; Vol. 53. [Google Scholar]
- Basosi R.; Bonciani R.; Frosali D.; Manfrida G.; Parisi M. L.; Sansone F. Life Cycle Analysis of a Geothermal Power Plant: Comparison of the Environmental Performance with Other Renewable Energy Systems. Sustain 2020, 12, 2786. 10.3390/su12072786. [DOI] [Google Scholar]
- Cámara Nacional de Acuacultura . Estadísticas CNA de Diciembre 2019: Guayaquil, 2019.
- Khoushab F.; Yamabhai M. Chitin Research Revisited. Mar. Drugs 2010, 8, 1988–2012. 10.3390/md8071988. [DOI] [PMC free article] [PubMed] [Google Scholar]
- Rodde R.; Einbu A.; Vårum K. A Seasonal Study of the Chemical Composition and Chitin Quality of Shrimp Shells Obtained from Northern Shrimp (Pandalus Borealis). Carbohydr. Polym. 2008, 71, 388–393. 10.1016/j.carbpol.2007.06.006. [DOI] [Google Scholar]
- Alibaba.com. Alibaba.com: Manufacturers, Suppliers, Exporters & Importers from the world’s largest online B2B marketplace. https://www.alibaba.com/ (accessed July 18, 2020).
- Alibaba.com. Precio Barato De Máquina De Lavado De Camarones. https://spanish.alibaba.com/product-detail/cheap-price-shell-washing-machine-shrimp-cleaning-machine-62249006622.html?spm=a2700.galleryofferlist.0.0.61053346cFGUGV (accessed July 18, 2020).
- Alibaba.com. Máquina De Molienda De Cáscara De Camarón Seco. https://spanish.alibaba.com/product-detail/dry-mushroom-shrimp-shell-tea-and-herb-leaves-henna-flower-dates-powder-grinding-mill-machine-60837694754.html?spm=a2700.galleryofferlist.0.0.61053346cFGUGV (accessed July 18, 2020).
- Alibaba.com. Torre De Recuperación De Alcohol. https://spanish.alibaba.com/product-detail/ethanol-distiller-alcohol-recovery-tower-alcohol-distiller-60458208231.html?spm=a2700.galleryofferlist.0.0.5c3441060bK9ar (accessed July 18, 2020).
- Alibaba.com. Modelo Nvi Serie Nutsche Filtro Industrial (nutsche). https://spanish.alibaba.com/product-detail/model-nvi-series-nutsche-filter-industrial-nutsche--62013288447.html?spm=a2700.galleryofferlist.0.0.4ea82c53urxHgv (accessed July 18, 2020).
- Alibaba.com. Vertical,Tanque De Almacenamiento Frp 5 10 15 20 25 30 M3 De Fibra De Vidrio. https://spanish.alibaba.com/product-detail/vertical-frp-storage-tank-5-10-15-20-25-30-m3-fiberglass-container-for-water-oil-gasoline-acid-alkali-from-china-factory-rockpro-62164908343.html?spm=a2700.galleryofferlist.0.0.18d766a8zMQs5h (accessed July 24, 2020).
- Alibaba.com. Deionizador De Agua Industrial. https://spanish.alibaba.com/product-detail/industrial-water-deionizer-water-deionizer-deionized-water-equipment-60371892429.html?spm=a2700.galleryofferlist.0.0.14ff68ebRJ8vxQ (accessed July 24, 2020).
- Alibaba.com. Caldera de vapor. https://spanish.alibaba.com/product-detail/textile-mill-5-ton-diesel-steam-generator-boiler-62541079215.html?spm=a2700.galleryofferlist.0.0.75504695zQynKn&s=p (accessed July 24, 2020).
- Macías Centeno J. E.; Valarezo Molina L. A.; Loor Castillo G. Los Diferentes Costos Que Tiene La Energía Eléctrica En El Ecuador Considerando Los Cambios de La Estructura Actual. Rev. de Investig. en Energ., medio Ambient. y Tecnol. 2018, 3, 29. 10.33936/riemat.v3i2.1628. [DOI] [Google Scholar]
- Properati. Lote en Venta en Norte De Guayaquil USD 318.900.
- Banco Central del Ecuador . Instructivo Tasas de Interés: Quito-Ecuador, 2021.
- Ministerio del Trabajo . SALARIOS MÍNIMOS SECTORIALES 2021-Ecuador: Quito-Ecuador, 2021.
- European Commission–Joint Research Centre–Institute for Environment and Sustainability . International Reference Life Cycle Data System (ILCD) Handbook—General Guide for Life Cycle Assessment—Detailed Guidance, 2010. [Google Scholar]
- FAO . Visión general del sector acuícola nacional—Ecuador. http://www.fao.org/fishery/countrysector/naso_ecuador/es (accessed Nov 22, 2020).
- Cao L.; Diana J. S.; Keoleian G. A.; Lai Q. Life Cycle Assessment of Chinese Shrimp Farming Systems Targeted for Export and Domestic Sales. Environ. Sci. Technol. 2011, 45, 6531–6538. 10.1021/es104058z. [DOI] [PubMed] [Google Scholar]
- Muñoz I.; Flury K.; Jungbluth N.; Rigarlsford G.; i Canals L. M.; King H. Life Cycle Assessment of Bio-Based Ethanol Produced from Different Agricultural Feedstocks. Int. J. Life Cycle Assess. 2014, 19, 109–119. 10.1007/s11367-013-0613-1. [DOI] [Google Scholar]
- Tsiropoulos I.; Faaij A. P. C.; Seabra J. E. A.; Lundquist L.; Schenker U.; Briois J.-F.; Patel M. K. Life Cycle Assessment of Sugarcane Ethanol Production in India in Comparison to Brazil. Int. J. Life Cycle Assess. 2014, 19, 1049–1067. 10.1007/s11367-014-0714-5. [DOI] [Google Scholar]
- Soam S.; Kumar R.; Gupta R. P.; Sharma P. K.; Tuli D. K.; Das B. Life Cycle Assessment of Fuel Ethanol from Sugarcane Molasses Innorthern and Western India and Its Impact on Indian Biofuel Programme. Energy 2015, 83, 307–315. 10.1016/j.energy.2015.02.025. [DOI] [Google Scholar]
- Agencia de Regulacion y Control de Electricidad . Atlas Del Sectore Electrico Ecuatoriano 2018: Quito-Ecuador, 2018.
- Ramírez Á.; Duque J.. Análisis Ambiental Del Producto de Acuicultura de Camarón Ecuatoriana Desde Una Perspectiva de Ciclo de Vida. 2008, 1–68. [Google Scholar]
- García F. Analisis Del Sector Camaronero. Apunt. Econ. 2003, 29, 1–60. [Google Scholar]
- Escorcia D.; Hernández D.; Sánchez M.; Benevente M. Diseño y Montaje de Una Planta Piloto Para La Extracción de Quitina y Proteínas. Nexo Rev. Científica 1970, 22, 45–55. 10.5377/nexo.v22i2.42. [DOI] [Google Scholar]
- Bajaj M.; Freiberg A.; Winter J.; Xu Y.; Gallert C. Pilot-Scale Chitin Extraction from Shrimp Shell Waste by Deproteination and Decalcification with Bacterial Enrichment Cultures. Appl. Microbiol. Biotechnol. 2015, 99, 9835–9846. 10.1007/s00253-015-6841-5. [DOI] [PubMed] [Google Scholar]
- Núñez-Gómez D.; Rodrigues C.; Lapolli F. R.; Lobo-Recio M. A. Physicochemical Characterization of White Shrimp (Litopenaeus Vannamei) Waste as a Low-Cost Chitinous Biomaterial. J. Polym. Environ. 2021, 29, 576–587. 10.1007/s10924-020-01887-5. [DOI] [Google Scholar]
- Samuthirapandian R.; Rameshkumar G.; Prince A. R. Biochemical Composition of Shell and Flesh of the Indian White Shrimp Penaeus Indicus (H.Milne Edwards 1837). Am.-Eurasian J. Sustain. Agric. 2009, 4, 191–194. [Google Scholar]
- Boldrin A.; Andersen J. K.; Møller J.; Christensen T. H.; Favoino E. Composting and Compost Utilization: Accounting of Greenhouse Gases and Global Warming Contributions. Waste Manage. Res. 2009, 27, 800–812. 10.1177/0734242X09345275. [DOI] [PubMed] [Google Scholar]
- Souza S. P.; de Ávila M. T.; Pacca S. Life Cycle Assessment of Sugarcane Ethanol and Palm Oil Biodiesel Joint Production. Biomass Bioenergy 2012, 44, 70–79. 10.1016/j.biombioe.2012.04.018. [DOI] [Google Scholar]
- Technical Committee ISO/TC 207, Environmental management, Subcommittee SC 5, Life cycle assessment . ISO 14040:2006 Environmental Management—Life Cycle Assessment—Principles and Framework, 2006, pp 1–47.
- Pré-Sustaintability B.V. Simapro Database Manual, 2014.
- National Institute for Public Health and the Environment . ReCiPe 2016 v1.1, 2017.
- Wei W.; Larrey-Lassalle P.; Faure T.; Dumoulin N.; Roux P.; Mathias J.-D. How to Conduct a Proper Sensitivity Analysis in Life Cycle Assessment: Taking into Account Correlations within LCI Data and Interactions within the LCA Calculation Model. Environ. Sci. Technol. 2015, 49, 377–385. 10.1021/es502128k. [DOI] [PubMed] [Google Scholar]
- Huang Y.; Spray A.; Parry T. Sensitivity Analysis of Methodological Choices in Road Pavement LCA. Int. J. Life Cycle Assess. 2013, 18, 93–101. 10.1007/s11367-012-0450-7. [DOI] [Google Scholar]
- Benini L.; Sala S. Uncertainty and Sensitivity Analysis of Normalization Factors to Methodological Assumptions. Int. J. Life Cycle Assess. 2016, 21, 224–236. 10.1007/s11367-015-1013-5. [DOI] [Google Scholar]
Associated Data
This section collects any data citations, data availability statements, or supplementary materials included in this article.


