

Abstract
Aim
To assess the association of country‐level obesity prevalence with COVID‐19 case and mortality rates, to evaluate the impact of obesity prevalence on worldwide variation.
Methods
Data on COVID‐19 prevalence and mortality, country‐specific governmental actions, socioeconomic, demographic, and healthcare capacity factors were extracted from publicly available sources. Multivariable negative binomial regression was used to assess the independent association of obesity with COVID‐19 case and mortality rates.
Results
Across 168 countries for which data were available, higher obesity prevalence was associated with increased COVID‐19 mortality and prevalence rates. For every 1% increase in obesity prevalence, the mortality rate was increased by 8.3% (incidence rate ratio [IRR] 1.083, 95% confidence interval [CI] 1.048‐1.119; P < 0.001) and the case rate was higher by 6.6% (IRR 1.066, 95% CI 1.035‐1.099; P < 0.001). Additionally, higher median population age, greater female ratio, higher Human Development Index (HDI), lower population density, and lower hospital bed availability were all significantly associated with higher COVID‐19 mortality rate. In addition, stricter governmental actions, higher HDI and lower mean annual temperature were significantly associated with higher COVID‐19 case rate.
Conclusion
These findings demonstrate that obesity prevalence is a significant and potentially modifiable risk factor of increased COVID‐19 national caseload and mortality. Future research to study whether weight loss improves COVID‐19 outcomes is urgently required.
Keywords: COVID‐19, negative binomial regression, obesity prevalence
1. INTRODUCTION
The novel coronavirus disease 2019 (COVID‐19), caused by severe acute respiratory syndrome coronavirus 2 (SARS‐CoV‐2), has rapidly spread across the globe since being first identified in Wuhan City, China, in December 2019. It was declared a pandemic by the World Health Organization (WHO) on March 11, 2020. 1 By January 2021 the virus had spread to over 180 countries, infecting more than 95 million people, of whom two million or more have died. 2 For most people, infection with SARS‐CoV‐2 requires no immediate medical attention, but some will develop severe respiratory distress requiring hospitalization, often in intensive care units (ICUs) with respiratory support. 1 , 3 This has overwhelmed health systems worldwide. Furthermore, governments have implemented stringent containment and prevention policies to restrict the spread of the virus, impacting the physical and mental well‐being of individuals as well as devastating economies globally. The estimated world output in gross domestic product (GDP) for 2020 was −3.5%, with the UK being amongst the worst affected countries, having an estimated drop in GDP of −10.0%. 4 With the attainment of herd immunity being considered an exit strategy, a worldwide vaccination initiative on an unprecedented scale is being implemented. Early data are promising, with one study showing a single dose reduces hospitalization and COVID‐19‐related mortality by 80% and 85%, respectively. 5 However, there is increasing recognition that vaccination alone will not eradicate COVID‐19. As SARS‐CoV‐2 continues to evolve, new variants are emerging with the potential of escaping vaccine‐mediated immunity, posing the risk of recurring outbreaks. This has forced societies to accept a new and uncertain future as governments and individuals will likely need to uphold containment and prevention measures as a long‐term reality, adopting behaviours such as mask wearing, social distancing and hand hygiene as part of the new normal, whilst returning to sustainable social and economic activities. 6 , 7 Thus, identifying risk factors to predict individuals at high risk of contracting and developing serious illness from the disease are crucial to prevent further loss of life and reduce economic and healthcare burden.
COVID‐19‐related prevalence and mortality rates vary significantly among countries. 1 The United Kingdom and United States have demonstrated some of the worst COVID‐19 outcomes, with 1400 mortalities (52 000 cases) per million and 1200 mortalities (73 000 cases) per million, respectively, compared to countries such as China and Thailand with 3.3 mortalities (68 cases) per million and 1.0 mortality (180 cases) per million respectively, by late January 2021. 2 This inter‐country variation has fuelled research efforts into understanding and explaining the variation. Studies have suggested that older age, male sex, healthcare capacity, government containment policies and population compliance with restrictive measures are associated with increased COVID‐19 burden. 1 , 8 , 9 , 10 , 11 , 12 , 13 , 14 , 15 , 16
Increasingly, obesity has been associated with both COVID‐19 severity and mortality. 11 , 17 , 18 , 19 , 20 , 21 , 22 , 23 , 24 , 25 , 26 Similar associations have been observed with other respiratory illnesses such as seasonal influenza, H1N1 and Middle East respiratory syndrome, as those with obesity are disproportionately at risk of hospitalization and mortality. 23 , 27 , 28 , 29 However, the extent to which obesity prevalence independently contributes to country‐level case and mortality rates is uncertain. A country‐level exploratory analysis found that obesity was associated with increased caseloads and mortality. 15 However that study was limited to 50 countries with the highest caseloads, analysed outcome data only for a few months after the start of the pandemic (up to May 1, 2020), and did not consider additional factors that may have an impact on COVID‐19 outcomes. A different study used a multivariable regression model to assess the association of obesity with COVID‐19 mortality rate at the country level; however, there was no analysis of COVID‐19 case rate with obesity and only 30 industrialized countries were included in the model. 30 Thus, the aim of this analysis was to evaluate the extent to which obesity prevalence contributes to the variation in COVID‐19 worldwide, by performing a country‐level observational analysis assessing country‐specific COVID‐19 case and mortality rates in relation to country‐specific obesity prevalence rates, whilst accounting for other potential confounding factors.
2. METHODS
2.1. Data extraction
All data were extracted from publicly available sources and, to ensure as complete a dataset as possible, multiple sources were frequently used. At the point of collection, the most recently available data were obtained from the source cited. The number of cases and mortalities (per million population), as well as date of first reported case, were extracted from the WHO COVID‐19 Dashboard. 2 Due to the dynamic nature of the pandemic, all case and mortality rates were collected within a single time frame (up to January 22, 2021). Data on adult obesity prevalence (%), the main predictor variable of interest, were extracted from the WHO Global Health Observatory, World Obesity Federation, and ProCon.org. It is defined as the proportion of the population (%) with a body mass index (BMI) greater than or equal to 30 kg/m2. 31 , 32 , 33 , 34 Government response characteristics regarding testing (daily tests/1000 population) and containment policy (Containment and Health Index [CHI]) were both collected from Our World in Data (OWD) on January 22, 2021 and February 2, 2021 respectively. 35 , 36 The CHI is a composite measure of 13 policy response indicators, scaled from 0 to 100 (100 = strictest): school closures; workplace closures; public event cancellations; restrictions on gatherings; public transport closures; public information campaigns; stay‐at‐home measures; restrictions on internal movement; international travel controls; testing policy; contact tracing; face coverings; and vaccination policies.
Data collected included characteristics on demographics of countries. OWD and the World Population Review were used to extract data on median population age, an indicator of age structure. 37 , 38 Gender ratio was recorded as the female population proportion (%), with data collected from OWD and NationMaster. 39 , 40 Data on population density, recorded as the number of people per km2 of land area, were taken from the World Bank (WB) and World Population Review. 41 , 42 Alongside population density, urban population (%) was also recorded as urban areas have emerged as epicentres of the pandemic, with data collected from OWD and the United Nations. 43 , 44 , 45
Several social, economic and political variables were also included as potential confounding factors. Human development was measured using the Human Development Index (HDI), obtained from OWD, which assesses three key dimensions of human development, scaled from 0 to 1 (1 = most developed): a long and healthy life measured by life expectancy at birth; access to knowledge of younger and older generations, respectively, measured by the expected and average years of schooling; and a decent standard of living, measured by gross national income per capita. 46 Democracy was measured using a scale for political regime ranging from −10 (full autocracy) to +10 (full democracy), taken from OWD. 47 Data on GDP per capita, measured at current $US, were obtained from the International Monetary Fund and the WB. 48 , 49
Data on healthcare capacity and the strain on healthcare regarding lifestyle and comorbidity factors, including the number of hospital beds per 1000 population and daily tobacco smoking prevalence rates (%), were collected from the WB and OWD, respectively. 50 , 51 The total burden of cardiovascular, respiratory, cancer and endocrine diseases was measured using disability‐adjusted life‐years (DALYs) lost (millions) from OWD. DALYs were the chosen metric as prevalence rates were not recorded at the population level for all four groups of diseases. 52
Furthermore, data regarding a number of additional factors that have been previously hypothesized to influence the transmission, infectivity and severity of COVID‐19 were further collected. 53 , 54 , 55 , 56 , 57 , 58 Data on Bacillus Calmette‐Guérin (BCG) vaccination coverage were extracted from the WHO and measured as the proportion of 1‐year‐olds vaccinated with BCG (%). 59 Temperature was measured as the mean annual temperature from 1901 to 2016 (°C), obtained from the WB. 60 Finally, OWD provided data on air pollution, measured as the mean annual exposure (μg/m3) to particulate matter ≤2.5 μg (PM2.5). 61
2.2. Statistical analysis
The outcome variables of interest were the rates of COVID‐19‐related mortalities and COVID‐19 cases (expressed per million population). As mortality rate is an indicator of more severe disease and is less likely to be influenced by factors such as COVID‐19 testing and containment and health policies, this was identified as the primary outcome of interest. The unit of analysis was each individual country. A univariate analysis was first performed to examine an association between outcome and obesity prevalence. Scatter graphs were plotted with a regression line and Spearman ρ was calculated to assess any significant correlation (defined as P ≤ 0.01). However, a range of confounding variables are known to influence COVID‐19 infection and mortality rates, thus a multivariable analysis was conducted to assess the independent association of obesity prevalence with COVID‐19 case and mortality rates.
Poisson regression is typically used to assess count data. However, overdispersion (when the conditional variance exceeds the conditional mean) was predicted with the country‐level nature of the dataset, thus precluding it as an appropriate model. Multivariable negative binomial regression accounts for overdispersion and was therefore used as a more appropriate model.
Variables included in the analyses were based on prior knowledge or biological plausibility. Analyses were conducted to assess the effect of obesity and other variables on COVID‐19‐related mortalities per million population and COVID‐19 cases per million population. In the primary analysis, in addition to obesity prevalence, the covariates in the multivariable negative binomial regression model included median age, gender ratio, population density, HDI, hospital beds per 1000 population, smoking prevalence, and CHI. The exposure variable was set as the (log) duration of COVID‐19 exposure in days, calculated as the interval between the date of the first reported case for each country until January 22, 2021. Additionally, a series of secondary analyses were performed to assess the effect of further variables, including: (a) daily tests per 1000 population; (b) BCG vaccination coverage; (c) mean annual temperature; (d) percentage of urban population; (e) democracy scale; (f) GDP per capita; (g) mean annual air pollution; and (h) DALYs lost to cardiovascular, cancer, respiratory and endocrine diseases (a total of eight additional models). These variables were not included in the primary model due to concerns over model overfitting. Furthermore, the relationships between these variables and the dependent outcomes are still unclear and therefore these analyses are exploratory.The goodness of fit of the primary model compared to secondary models was assessed by Akaike's information criterion, whereby lower values of the index indicate the preferred model. 62 The statistical significance of the model was assessed with an Omnibus test. Statistical significance was defined as P < 0.05 and confidence intervals (CIs) were set at 95%. All outcomes of the regression analysis were reported as exponential β coefficients (referred to as incidence rate ratio [IRR]), whereby a value less than one suggests a decreased likelihood and a value greater than one suggests an increased likelihood of the outcome. All data were analysed using IBM SPSS Statistics (version 27), Chicago, Illinois. Predictive graphs were generated using Stata/SE (version 16), College Station, Texas.
3. RESULTS
3.1. Descriptive statistics
The characteristics of 168 countries, for which complete data regarding COVID‐19, demographics, socioeconomic and health‐related factors were available, are summarized in Table 1. The median (interquartile range [IQR]) number of COVID‐19‐related cases and mortalities (per one million population) were 7350.0 (928.5‐30 911.0) and 85.0 (12.0‐496.5), respectively. The median (IQR) prevalence of obesity was 20.6 (8.9‐25.6)% and for the CHI it was 60.3 (47.8‐68.7). The median of median ages was 29.5 (22.3‐38.7) years and the median proportion of females was 50.2% (49.7‐50.9). The median (IQR) population density was 84.6 (34.3‐211.3) people per km2 of land area and the median (IQR) HDI was 0.7 (0.6‐0.8). The median (IQR) number of hospital beds per 1000 people was 2.2 (1.1‐4.0) and the proportion of daily smokers was 16.4 (10.4‐23.1)%. Finally, the median (IQR) interval between the first reported case of COVID‐19 until January 22, 2021, was 320.0 (310.0‐329.3) days.
TABLE 1.
Descriptive statistics of country‐level characteristics (n = 168 a )
| Median (IQR) | |
|---|---|
| Deaths/million population | 85.0 (12.0‐496.5) |
| Cases/million population | 7350.0 (928.5‐30 911.0) |
| Obesity prevalence, % | 20.6 (8.9‐25.6) |
| Containment and health index | 60.3 (47.8‐68.7) |
| Median age, years | 29.5 (22.3‐38.7) |
| Female ratio, % | 50.2 (49.7‐50.9) |
| Population density, people/km2 of land area | 84.6 (34.3‐211.3) |
| Human development index | 0.7 (0.6‐0.8) |
| Hospital beds/1000 population | 2.2 (1.1‐4.0) |
| Daily smoking prevalence, % | 16.4 (10.4‐23.1) |
| Duration of exposure, % | 320.0 (310.0‐329.3) |
Note: The Containment and Health Index is a composite measure of 13 policy response indicators, scaled from 0 to 100 (100 = strictest). The Human Development Index assesses three key dimensions of human development, scaled from 0 to 1 (1 = most developed). The duration of COVID‐19 in days is calculated from the date of the first reported case for that particular country until January 22, 2021.
Abbreviation: IQR, interquartile range.
Of the 191 countries included in the initial univariate analysis, only 168 countries had complete multivariate data available and were thus included.
3.2. Association of obesity with COVID‐19 mortality rate
A total of 191 out of 196 countries (97.4%) were included in the univariate analysis assessing the association between obesity prevalence and the rates of COVID‐19‐related mortalities (primary outcome) and COVID‐19 cases (secondary outcome) expressed per million population for each country. The countries excluded from this analysis due to an incomplete univariate dataset were: Aruba, Liechtenstein, Monaco, San Marino, and Taiwan. There was a positive correlation between obesity prevalence and COVID‐19 mortality rate (Spearman ρ = 0.37; 95% CI 0.24‐0.49; P < 0.001). The correlation was stronger when the analysis was restricted to 168 countries with complete multivariate data availability (Spearman ρ = 0.55; 95% CI 0.43‐0.65; P < 0.001).
A total of 168 out of 196 countries (85.7%) had a complete multivariate dataset for the range of additional characteristics and, thus, were included in the primary analysis (Table 1). The countries excluded from this analysis due to an incomplete dataset were: Aruba, Antigua and Barbuda, Armenia, Comoros, Equatorial Guinea, Grenada, Guinea‐Bissau, Kiribati, Liechtenstein, Maldives, Marshall Islands, Micronesia, Monaco, Montenegro, Nauru, North Korea, North Macedonia, Palau, Saint Kitts and Nevis, Saint Lucia, Saint Vincent and the Grenadines, Samoa, San Marino, Sao Tome and Principe, Taiwan, Tonga, Turkmenistan, and Tuvalu (Table 2). Obesity prevalence was positively, significantly and independently associated with COVID‐19 mortality rate (Table 3). For every 1% increase in obesity prevalence, the mortality rate was higher by 8.3% (IRR 1.08, 95% CI 1.05‐1.12; P < 0.001; Figure 1). Other variables that significantly predicted COVID‐19 mortality rate were median age (every 1‐year increase in median age associated with a 5.7% higher mortality rate), gender ratio (every 1% increase in female population increasing the mortality rate by 10.5%), population density (every one person increase per km2 of land area decreasing the mortality rate), HDI (with every one‐unit increase raising the mortality rate by 2456.1%), and hospital bed availability per 1000 population (with every additional bed per 1000 population decreasing the association with mortality rate by 15.2%). CHI (P = 0.067) and daily smoking prevalence (P = 0.63) were not associated with mortality rate.
TABLE 2.
Available data for the countries excluded from the primary analysis due to an incomplete multivariate dataset (n = 28)
| Available data, % | |
|---|---|
| Deaths/million population a | 96.4 |
| Cases/million population a | 96.4 |
| Obesity prevalence, % | 89.3 |
| Containment and health index | 28.6 |
| Median age, years | 100.0 |
| Female ratio, % | 100.0 |
| Population density, people/km2 of land area | 96.4 |
| Human development index | 78.6 |
| Hospital beds/1000 population | 96.4 |
| Daily smoking prevalence, % | 71.4 |
| Duration of exposure, days | 71.4 |
Note: The Containment and Health Index is a composite measure of 13 policy response indicators, scaled from 0 to 100 (100 = strictest). The Human Development Index assesses three key dimensions of human development, scaled from 0 to 1 (1 = most developed). The duration of COVID‐19 in days is calculated from the date of the first reported case for that particular country until January 22, 2021.
Taiwan was the only country with missing data on COVID‐19 case and death rates.
TABLE 3.
Association of obesity prevalence and other variables with COVID‐19 mortality rate across 168 countries
| Variable | IRR (95% CI) | P |
|---|---|---|
| Obesity prevalence, % | 1.083 (1.048‐1.119) | <0.001 |
| Containment and health index | 1.014 (0.999‐1.030) | 0.067 |
| Median age, years | 1.057 (1.005‐1.112) | 0.033 |
| Female ratio, % | 1.105 (1.043‐1.171) | <0.001 |
| Population density, people/km2 of land area | 1.000 (0.999‐1.000) | 0.001 |
| Human development index | 24.561 (0.994‐607.160) | 0.050 |
| Hospital beds/1000 population | 0.848 (0.751‐0.957) | 0.007 |
| Daily smoking prevalence, % | 1.008 (0.976‐1.042) | 0.30 |
Note: The Containment and Health Index is a composite measure of 13 policy response indicators, scaled from 0 to 100 (100 = strictest). The Human Development Index assesses three key dimensions of human development, scaled from 0 to 1 (1 = most developed). The duration of COVID‐19 in days is calculated from the date of the first reported case for that particular country until January 22, 2021.
Abbreviations: CI, confidence interval; IRR, incidence rate ratio.
FIGURE 1.
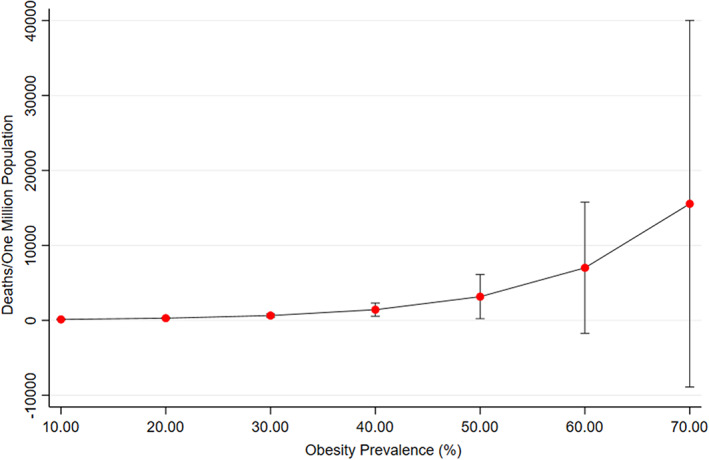
The relationship of predicted COVID‐19 mortality rate associated with obesity prevalence. Error bars show 95% confidence intervals. The predicted COVID‐19 mortality rate associated with obesity prevalence is independent of other factors included in the primary model
The additional variables included in the series of secondary analyses did not show any significant association with mortality rate, including: (a) new daily tests/1000 (P = 0.41); (b) BCG immunization coverage among 1‐year olds (P = 0.93); (c) mean annual temperature (°C; P = 0.93); (d) urban population (%) in place of population density (P = 0.89); (e) political regime (P = 0.23); (f) GDP per capita (current $US) in place of the HDI (P = 0.65); (g) PM2.5 air pollution (μg/m3; P = 0.80); and (h) DALYs (millions) lost to cardiovascular (P = 0.56), cancer (P = 0.56), respiratory (P = 0.83), and endocrine (P = 0.47) diseases. Obesity prevalence continued to demonstrate a positive and significant association with COVID‐19 mortality in all secondary analyses.
3.3. Association of obesity with COVID‐19 case rate
Univariate analysis demonstrated that, across the 191 countries with a complete univariate dataset there was a significant and positive correlation between obesity prevalence and COVID‐19 case rate (Spearman ρ = 0.38; 95% CI 0.25‐0.50; P < 0.001). The correlation was stronger when the analysis was restricted to 168 countries with complete multivariate data availability (Spearman ρ = 0.58; 95% CI 0.45‐0.67; P < 0.001).
Across the 168 countries with a complete multivariate dataset, obesity prevalence was positively, significantly and independently associated with COVID‐19 case rate (Table 4). For every 1% increase in obesity prevalence, the case rate was higher by 6.6% (IRR 1.07, 95% CI 1.04‐1.10; P < 0.001). Thus, as obesity prevalence increases, the predicted case rate is higher (Figure 2). Other variables that significantly predicted COVID‐19 case rate were the CHI (every one‐unit increase raising the case rate by 2.6%) and the HDI (every one‐unit increase raising the case rate by 2374.0%). Median age (P = 0.071), gender ratio (P = 0.51), population density (P = 0.76), daily smoking prevalence (P = 0.49), and hospital bed availability (P = 0.28) were not associated with case rate.
TABLE 4.
Association of obesity prevalence and other variables with COVID‐19 case rate across 168 countries
| Variable | IRR (95% CI) | P |
|---|---|---|
| Obesity prevalence, % | 1.066 (1.035‐1.099) | <0.001 |
| Containment and health index | 1.026 (1.011‐1.040) | 0.009 |
| Median age, years | 1.041 (0.997‐1.087) | 0.071 |
| Female ratio, % | 1.017 (0.968‐1.067) | 0.510 |
| Population density, people/km2 of land area | 1.000 (1.000‐1.000) | 0.760 |
| Human development index | 23.740 (1.410‐399.677) | 0.028 |
| Hospital beds/1000 population | 0.942 (0.844‐1.051) | 0.280 |
| Daily smoking prevalence, % | 1.011 (0.981‐1.041) | 0.490 |
Note: The Containment and Health Index is a composite measure of 13 policy response indicators, scaled from 0 to 100 (100 = strictest). The Human Development Index assesses three key dimensions of human development, scaled from 0 to 1 (1 = most developed). The duration of COVID‐19 in days is calculated from the date of the first reported case for that particular country until January 22, 2021.
Abbreviation: IRR, incidence rate ratio.
FIGURE 2.

The relationship between predicted COVID‐19 case rate with obesity prevalence. Error bars show 95% confidence intervals. The predicted COVID‐19 case rate associated with obesity prevalence is independent of other factors included in the primary model
Upon including the eight additional variables in the series of secondary analyses, only mean annual temperature showed a significant association with case rate, with every 1°C increase lowering the case rate by 3.5% (IRR 0.965; P = 0.040). All other variables showed no significant association with case rate, including: (a) new daily tests/1000 (P = 0.67); (b) BCG immunization coverage among 1‐year‐olds (P = 0.37); (c) urban population (%) in place of population density (P = 0.41); (d) political regime (P = 0.26); (e) GDP per capita (current $US) in place of the HDI (P = 0.61); (f) PM2.5 air pollution (μg/m3; P = 0.99); and (g) DALYs (millions) lost to cardiovascular (P = 0.41), cancer (P = .43), respiratory (P = 0.36) and endocrine (P = 0.83) diseases. Obesity prevalence continued to demonstrate a positive and significant association with COVID‐19 case rate in all secondary analyses.
4. DISCUSSION
In support of a growing body of evidence, the results of the present study demonstrate that the level of obesity is a clear independent predictor of COVID‐19 mortality and risk of infection. 15 , 19 , 20 , 21 , 22 , 24 , 25 , 26 , 63 , 64 A global meta‐analysis that assessed the epidemiological relationship between obesity and COVID‐19 demonstrated that, across 35 studies, individuals with obesity were at a significantly higher risk of mortality (odds ratio [OR] 1.48, 95% CI 1.22‐1.80) and an early study in China demonstrated that individuals with obesity were significantly more likely to develop severe disease (OR 3.40, 95% CI 1.40‐2.86). 20 , 23 A recent prospective, community‐based, cohort study of 6.9 million people in England has reported that, at a BMI of more than 23 kg/m2, there was a linear increase in risk of severe COVID‐19 leading to admission to hospital and death, and a linear increase in admission to ICUs across the whole BMI range, which was not attributable to excess risks of related diseases. 65 There have also been some reports of insignificant and inverse correlations between obesity and COVID‐19 severity and mortality, such as one meta‐analysis which demonstrated that across four studies there was no significant association between obesity and COVID‐19 mortality (P = 0.072). 20 , 23 The extent to which obesity prevalence independently contributes to country‐level case and mortality rates is uncertain, and our analysis adds to the evidence. Furthermore, our analysis has a greater power to detect population‐level risk factors for COVID‐19‐related morbidity and mortality as it utilised population‐level data available from publicly available, reliable sources and used each country as the per capita rather than individuals.
Whilst the underlying mechanisms on how obesity influences COVID‐19 severity and mortality are not completely understood, several hypotheses have been suggested. Obesity is thought to bring about changes in pulmonary mechanics and function which, coupled with a possibly dysfunctional immune system and increased likelihood of comorbidities, predisposes individuals with obesity to severe respiratory infections. 17 Obesity has a range of effects on the pulmonary mechanics of the lungs. For example, the accumulation of fat deposits within the thorax and abdominal cavity, associated with central obesity, has adverse effects on lung compliance as intra‐abdominal fat mass restricts movement of the diaphragm and chest well. This reduces the functional residual capacity of the lung, with a possible detriment to COVID‐19 prognosis. 17 , 66 Additionally, there are a range of physical challenges to the critical care of COVID‐19 patients with obesity. Prone‐positioning is a recommended practice in the treatment of acute respiratory distress syndrome (ARDS), a common respiratory manifestation in severe COVID‐19, as it improves both air entry to posterior lung regions and drainage of airway secretions. 17 This is particularly important in the treatment of COVID‐19 patients with obesity as they demonstrate an increased susceptibility to developing ARDS compared to lean adults. 67 However, prone‐positioning requires regular turning of the sedated individual, which can prove physically demanding for ICU staff treating those with obesity. 17 Being an individual with obesity is also associated with dysregulation of the immune system, potentially having adverse effects upon infection with SARS‐CoV‐2. Adipose tissue is a recognized endocrine organ that secretes adipokines, cytokines and chemokines which maintain a balanced pro‐ and anti‐inflammatory environment. However, obesity significantly alters the profile of immune cells and offsets this balance. An increase in proinflammatory cells, such as CD8+ T cells and M1 macrophages, with the consequent release of proinflammatory cytokines such as interleukin‐6 and C‐reactive protein, induces a state of low‐grade chronic inflammation which is characteristic of obesity. Recent studies have linked COVID‐19 severity with a dysregulation of proinflammatory cytokines. Therefore, acute inflammation from COVID‐19 may exacerbate the underlying state of chronic inflammation, which can ultimately trigger a hyper‐inflammatory response. 17 , 20 , 68 This is consistent with a study that identifies low‐grade inflammation as a risk factor for severe COVID‐19, suggesting it partly explains the high hospitalization rate amongst those with obesity. 69 Obesity in an individual is also associated with a range of additional comorbidities and risk factors for COVID‐19. 11 , 17 , 20 , 68 , 70 A meta‐analysis demonstrated that the relative risk of developing severe COVID‐19 or mortality was significantly higher in patients with cardiovascular disease (OR 3.11, 95% CI 2.55‐3.79), hypertension (OR 2.50, 95% CI 2.15‐2.9) and diabetes (OR 2.25, 95% CI 1.89‐2.69), conditions which are all associated with obesity. 70 Thus, worse COVID‐19 prognosis in individuals with obesity may partly be explained by pre‐existing comorbidity; however, it is clear that there are also various additional mechanisms that possibly explain the effect of obesity on COVID‐19 severity and mortality.
Consistent with a range of literature, the findings of this study clearly identify obesity as an independent predictor of COVID‐19 prevalence. 15 , 20 , 24 , 63 , 64 As presented in the previous global meta‐analysis, the pooled data of 20 studies demonstrated an increased odds of testing positive for COVID‐19 in those with obesity compared to individuals of normal weight (OR 1.46, 95% CI 1.30‐1.65). 20 One study using UK Biobank data showed that obesity almost doubles the risk of COVID‐19 (RR 1.97, 95% CI 1.46‐2.65). 63 A study in Mexico showed a significantly higher proportion of obesity amongst patients who tested positive for COVID‐19 compared to those without a confirmed diagnosis (17.4% vs. 12.8% respectively). 24 Although the majority of literature support the findings of this study, there has been some conflicting evidence. 71 For example, one analysis using UK Biobank data showed an insignificant association between obesity and testing COVID‐19 positive (OR 1.09, CI 0.99‐1.19). 72
There is a lack of available literature that proposes underlying mechanisms which explain the effect of obesity on COVID‐19 prevalence. The high prevalence of obesity amongst COVID‐19‐positive individuals may be rooted in the disrupted T‐cell response outlined above, making the individual more susceptible to infection. 20 , 73 However, it is likely that the high prevalence of obesity among COVID‐19 cases is reflective of the high obesity prevalence in the general population, with a global rate of 13%. 33 This highlights the need for further research into explaining how obesity influences COVID‐19 prevalence.
Obesity does not account for all the variation in COVID‐19 cases and mortalities worldwide, and a number of additional variables have been identified as independent predictors of COVID‐19 prevalence and mortality. Across all variables, the HDI showed the largest association with COVID‐19 case and mortality rate. A recent commentary postulates that the “hygiene hypothesis” may partly explain this observation, suggesting that low socioeconomic countries with poorer hygiene may train a more robust innate immune system during childhood due to frequent exposure to environmental microbes, ultimately minimizing the susceptibility and severity to COVID‐19. 74 Older age was identified as an independent predictor of COVID‐19 mortality, which is consistent with an extensive range of studies that identify age as a risk factor for COVID‐19 severity. 1 , 8 , 10 , 11 , 19 , 71 , 75 , 76 Similarly, greater hospital bed availability was shown to independently predict a lower COVID‐19 mortality rate, which is unsurprising as increased healthcare capacity would allow countries to treat surges in COVID‐19 cases more effectively. 14 An unexpected finding was that the proportion of females in a population was positively associated with COVID‐19 mortality rate, contradicting the majority of the available literature which implicate male sex as a risk factor for COVID‐19 severity. 8 , 10 , 12 , 19 , 64 , 69 This may reflect global variations in socioeconomic and work‐related factors amongst the sexes, or it may have arisen from using two sources to complete data collection, which could have impeded the accuracy of the dataset. However, in support of our findings one study showed that a higher BMI was associated with a stronger risk of COVID‐19 mortality in women than men. 77 The association of sex with COVID‐19 mortality requires further investigation. Interestingly, smoking prevalence was not significantly associated with COVID‐19 prevalence or mortality. The available literature suggests that the effect of daily smoking on COVID‐19 is controversial; however, the majority of studies suggest smoking is positively associated with COVID‐19 severity. 78 , 79 , 80 , 81 Additionally, the CHI was associated with a higher prevalence of COVID‐19, which is intriguing as this contradicts the very purpose of introducing containment and prevention measures. Alternatively, this may reflect the fact that countries with a higher caseload may need to implement more stringent containment and prevention measures. Studies analysing government response to COVID‐19 have mixed findings and it is clear that further investigation is needed to firmly assess the effect of containment and prevention measures on the spread of COVID‐19. 15 , 45 , 82 , 83 Population density has been shown to be a significant predictor of COVID‐19 mortality, although the magnitude of the effect appears to be modest. There are conflicting studies assessing the impact of population density on COVID‐19 mortality. 30 , 84 , 85 Surprisingly, population density was not associated with COVID‐19 prevalence in the present study, which contradicts much of the available literature. 56 , 85 , 86 Mean annual temperature was shown to be an independent predictor of COVID‐19 prevalence and was the only variable in the secondary analyses that yielded a significant result. This contributes to an emerging body of evidence that implicates higher temperature in reduced spread of COVID‐19. 55 , 57 , 87 However, the evidence surrounding this association is under a lot of debate and requires further investigation.
To the best of our knowledge, this is the first observational study to assess the association of obesity with COVID‐19 case and mortality rates on a global scale, accounting for a wide range of country‐level characteristics. The proportion of missing data in the primary analysis was low and 86% of countries had complete datasets, making the analysis largely generalizable to the global population. Furthermore, incomplete datasets for countries may indicate less reliable reporting from countries, thus their exclusion from the analysis may have improved the reliability of results. Nonetheless, the 14% of countries excluded from the analysis due to incomplete datasets may have introduced some unintended bias. Additionally, in order to obtain as complete datasets as possible, multiple sources were often used for a single variable, potentially affecting the accuracy of data. The prevalence rates for cardiovascular and respiratory diseases were not available, thus “DALYs lost” was the chosen metric for the country‐level burden of comorbidities associated with COVID‐19 as data were readily available. This also ensured consistency across all four categories of disease. The results demonstrate no significant association of comorbidities with COVID‐19 case or mortality rate, even when obesity was excluded from the regression model, which contradicts extensive literature. 1 , 8 , 11 , 64 , 70 , 71 , 72 , 75 , 88 , 89 DALYs may not have been the most appropriate metric to use, with possible impacts on the reliability of results.
The findings of this study strengthen evidence for an independent association of obesity with increased COVID‐19 prevalence and mortality rates worldwide. This has important implications for those with obesity, as well as for healthcare professionals and policy makers. Further research is required to better understand the cellular and molecular mechanisms that predispose those with obesity to increased risk of COVID‐19 infection and mortality. This will aid the development of interventional and prophylactic therapies against COVID‐19 and potentially future pandemics. Importantly, the immunological impairment of individuals with obesity should be considered in the improvement and development of vaccines. Policy makers should continue to recognize the immediate risk of those with obesity in the current pandemic, with emphasis on shielding prior to vaccination. Ultimately, further research into the biological, socio‐cultural and economic drivers of obesity is necessary in combating the obesity crisis worldwide. Public health interventions, such as weight loss initiatives, may be critical in reducing the level of obesity in the general population, however, this will require concerted and sustained efforts by governments, industry and society. This will help improve resilience and reduce the burden on individuals, as well as on healthcare systems and the economy in future pandemics.
In conclusion, the findings of this study demonstrate that obesity is a significant and independent predictor of COVID‐19 prevalence and mortality. This is the first study to assess the statistical and independent association of obesity with COVID‐19 case and mortality rates on a global scale.
CONFLICT OF INTEREST
The authors declare that there is no conflict of interest.
AUTHORS CONTRIBUTIONS
Oliver Foo: This author helped design the study, collect the data, perform the data analysis, interpret the data and write the manuscript. Shaun Hiu: This author helped with statistical advice and provided critical input in writing the manuscript. Akheel Syed: This author provided critical input in writing the manuscript. Dawn Teare: This author helped with statistical advice and provided critical input in writing the manuscript. Salman Razvi: This author helped design the study, perform the data analysis, interpret the data and provide critical input in writing the manuscript.
PEER REVIEW
The peer review history for this article is available at https://publons.com/publon/10.1111/dom.14523.
Foo O, Hiu S, Teare D, Syed AA, Razvi S. A global country‐level analysis of the relationship between obesity and COVID‐19 cases and mortality. Diabetes Obes Metab. 2021;23(12):2697‐2706. doi: 10.1111/dom.14523
DATA AVAILABILITY STATEMENT
The authors declare that the data collected for the study was gathered from publicly available databases. All sources have been stated in the list of references and thus are available to others. This data includes country‐level characteristics which were used in the statistical analysis.
REFERENCES
- 1. Sorci G, Faivre B, Morand S. Explaining among‐country variation in COVID‐19 case fatality rate. Sci Rep. 2020;10:18909. [DOI] [PMC free article] [PubMed] [Google Scholar]
- 2. The World Health Organisation . WHO Coronavirus Disease (COVID‐19) Dashboard. 2021. https://covid19.who.int/. Accessed January 22, 2021.
- 3. CDC . Interim Clinical Guidance for Management of Patients with Confirmed Coronavirus Disease (COVID‐19). 2021. https://www.cdc.gov/coronavirus/2019-ncov/hcp/clinical-guidance-management-patients.html. Accessed February 23, 2021.
- 4. International Monetary Fund. World Economic Outlook . 2021. https://www.imf.org/en/Publications/WEO/Issues/2021/01/26/2021-world-economic-outlook-update. Accessed March 16, 2021.
- 5. Bernal J, Andrews N & Gower C et al. Early effectiveness of COVID‐19 vaccination with BNT162b2 mRNA vaccine and ChAdOx1 adenovirus vector vaccine on symptomatic disease, Hospitalisations and mortality in older adults in the UK: a test negative case control study. 10.1101/2021.03.01.21252652 [DOI]
- 6. Skegg D, Gluckman P, Boulton G, et al. Future scenarios for the COVID‐19 pandemic. Lancet. 2021;397:777‐778. [DOI] [PMC free article] [PubMed] [Google Scholar]
- 7. Kasai T. From the “new Normal” to a “new future”: a sustainable response to COVID‐19. Lancet Reg Health West Pac. 2020;4:100043. 10.1016/j.lanwpc.2020.100043 [DOI] [PMC free article] [PubMed] [Google Scholar]
- 8. Abu Hammad O, Alnazzawi A, Borzangy S, et al. Factors influencing global variations in COVID‐19 cases and fatalities; a review. Healthcare (Basel). 2020;8:216. [DOI] [PMC free article] [PubMed] [Google Scholar]
- 9. Hashim M, Alsuwaidi A, Khan G. Population risk factors for COVID‐19 mortality in 93 countries. J Epidemiol Glob Health. 2020;10:204‐208. [DOI] [PMC free article] [PubMed] [Google Scholar]
- 10. Cao Y, Hiyoshi A, Montgomery S. COVID‐19 case‐fatality rate and demographic and socioeconomic influencers: worldwide spatial regression analysis based on country‐level data. BMJ Open. 2020;10:e043560. [DOI] [PMC free article] [PubMed] [Google Scholar]
- 11. Gao Y, Ding M, Dong X, et al. Risk factors for severe and critically ill COVID‐19 patients: a review. Allergy. 2021;76:428‐455. [DOI] [PubMed] [Google Scholar]
- 12. Jin J, Bai P, He W, et al. Gender differences in patients with COVID‐19: focus on severity and mortality. Front Public Health. 2020;8:152‐152. [DOI] [PMC free article] [PubMed] [Google Scholar]
- 13. Peckham H, de Gruijter N, Raine C, et al. Male sex identified by global COVID‐19 meta‐analysis as a risk factor for death and ITU admission. Nat Commun. 2020;11:6317. [DOI] [PMC free article] [PubMed] [Google Scholar]
- 14. Pan J, St Pierre J, Pickering T, et al. Coronavirus disease 2019 (COVID‐19): a modeling study of factors driving variation in case fatality rate by country. Int J Environ Res Public Health. 2020;17:8189. [DOI] [PMC free article] [PubMed] [Google Scholar]
- 15. Chaudhry R, Dranitsaris G, Mubashir T, Bartoszko J, Riazi S. A country level analysis measuring the impact of government actions, country preparedness and socioeconomic factors on COVID‐19 mortality and related health outcomes. EClinicalMedicine. 2020;25:100464. 10.1016/j.eclinm.2020.100464 [DOI] [PMC free article] [PubMed] [Google Scholar]
- 16. Gelfand J, Jackson C, Pan X, et al. The relationship between cultural tightness–looseness and COVID‐19 cases and deaths: a global analysis. Lancet Planet Health. 2021;5(3):e135‐e144. 10.1016/S2542-5196(20)30301-6 [DOI] [PMC free article] [PubMed] [Google Scholar]
- 17. Kwok S, Adam S, Ho JH, et al. Obesity: a critical risk factor in the COVID‐19 pandemic. Clin Obes. 2020;10:e12403. [DOI] [PMC free article] [PubMed] [Google Scholar]
- 18. Yu W, Rohli K, Yang S, Jia P. Impact of obesity on COVID‐19 patients. J Diabetes Complications. 2021;35:107817. [DOI] [PMC free article] [PubMed] [Google Scholar]
- 19. Tartof S, Qian L, Hong V, et al. Obesity and mortality among patients diagnosed with COVID‐19: results from an integrated health care organization. Ann Intern Med. 2020;173:773‐781. [DOI] [PMC free article] [PubMed] [Google Scholar]
- 20. Popkin B, Du S, Green W, et al. Individuals with obesity and COVID‐19: a global perspective on the epidemiology and biological relationships. Obes Rev. 2020;21:e13128. [DOI] [PMC free article] [PubMed] [Google Scholar]
- 21. Huang Y, Lu Y, Huang Y, et al. Obesity in patients with COVID‐19: a systematic review and meta‐analysis. Metabolism. 2020;113:154378. [DOI] [PMC free article] [PubMed] [Google Scholar]
- 22. Chu Y, Yang J, Shi J, Zhang P, Wang X. Obesity is associated with increased severity of disease in COVID‐19 pneumonia: a systematic review and meta‐analysis. Eur J Med Res. 2020;25:64. [DOI] [PMC free article] [PubMed] [Google Scholar]
- 23. Zhao X, Gang X, He G, et al. Obesity increases the severity and mortality of influenza and COVID‐19: a systematic review and meta‐analysis. Front Endocrinol (Lausanne). 2020;11:595109. [DOI] [PMC free article] [PubMed] [Google Scholar]
- 24. Denova‐Gutiérrez E, Lopez‐Gatell H, Alomia‐Zegarra J, et al. The Association of Obesity, type 2 diabetes, and hypertension with severe coronavirus disease 2019 on admission among Mexican patients. Obesity. 2020;28:1826‐1832. [DOI] [PMC free article] [PubMed] [Google Scholar]
- 25. Cai Q, Chen F, Wang T, et al. Obesity and COVID‐19 severity in a designated Hospital in Shenzhen. China Diabetes Care. 2020;43:1392‐1398. [DOI] [PubMed] [Google Scholar]
- 26. Poly T, Islam M, Yang H, et al. Obesity and mortality among patients diagnosed with COVID‐19: a systematic review and meta‐analysis. Front Med. 2021;8:620044. 10.3389/fmed.2021.620044 [DOI] [PMC free article] [PubMed] [Google Scholar]
- 27. Luzi L, Radaelli M. Influenza and obesity: its odd relationship and the lessons for COVID‐19 pandemic. Acta Diabetol. 2020;57:759‐764. [DOI] [PMC free article] [PubMed] [Google Scholar]
- 28. Fezeu L, Julia C, Henegar A, et al. Obesity is associated with higher risk of intensive care unit admission and death in influenza a (H1N1) patients: a systematic review and meta‐analysis. Obes Rev. 2011;12:653‐659. [DOI] [PubMed] [Google Scholar]
- 29. Badawi A, Ryoo S. Prevalence of comorbidities in the Middle East respiratory syndrome coronavirus (MERS‐CoV): a systematic review and meta‐analysis. Int J Infect Dis. 2016;49:129‐133. [DOI] [PMC free article] [PubMed] [Google Scholar]
- 30. Gardiner J, Oben J, Sutcliffe A. Obesity as a driver of international differences in COVID‐19 death rates. Diabetes Obes Metab. 2021;23:1463‐1470. [DOI] [PMC free article] [PubMed] [Google Scholar]
- 31. The World Health Organisation . Prevalence of Obesity Among Adults, BMI ≥ 30, Age‐Standardized Estimates by Country. 2016. https://apps.who.int/gho/data/view.main.CTRY2450A?lang=en. Accessed January 24, 2021.
- 32. ProCon.org . Global Obesity Levels. 2016. https://obesity.procon.org/global-obesity-levels/. Accessed January 25, 2021
- 33. World Obesity . Prevalence of Adult Overweight and Obesity (%). 2021. https://data.worldobesity.org/tables/prevalence-of-adult-overweight-obesity-2/. Accessed January 25, 2021
- 34. The World Health Organisation . South Sudan 2016. https://www.who.int/diabetes/country-profiles/ssd_en.pdf. Accessed January 24, 2021.
- 35. Roser M, Ritchie H, Ortiz‐Ospina E, Hasell J. Coronavirus (COVID‐19) Testing 2020. https://ourworldindata.org/coronavirus-testing. Accessed January 22, 2021
- 36. Roser M RH, Ortiz‐Ospina E, Hasell J. Policy Responses to the Coronavirus Pandemic. 2020. https://ourworldindata.org/policy-responses-covid. Accessed February 2, 2021
- 37. Ritchie H, Roser M. Age Structure. 2019. https://ourworldindata.org/age-structure. Accessed January 20, 2021
- 38. World Population Review . Median Age 2021. https://worldpopulationreview.com/country-rankings/median-age. Accessed January 27, 2021
- 39. Ritchie H, Roser M. Gender Ratio. 2019. https://ourworldindata.org/gender-ratio. Accessed January 21, 2021
- 40. NationMaster . Total Population: Countries Compared. 2013. https://www.nationmaster.com/country-info/stats/People/Sex-ratio/Total-population. Accessed January 27, 2021
- 41. The World Bank Data . Population Density 2021. https://data.worldbank.org/indicator/EN.POP.DNST. Accessed January 21, 2021
- 42. World Population Review . Countries by Density. 2021. https://worldpopulationreview.com/country-rankings/countries-by-density. Accessed January 27, 2021.
- 43. Ritchie H, Roser M. Urbanisation 2018. https://ourworldindata.org/urbanization. Accessed February 2, 2021.
- 44. United Nations . Policy Brief: COVID‐19 in an Urban World. New York City: UN; 2020. [Google Scholar]
- 45. Leffler C, Ing E, Lykins J, Hogan M, McKeown C, Grzybowski A. Association of Country‐wide Coronavirus Mortality with demographics, testing, lockdowns, and public wearing of masks. Am J Trop Med Hyg. 2020;103:2400‐2411. [DOI] [PMC free article] [PubMed] [Google Scholar]
- 46. Roser M. Human Development Index (HDI) 2014. https://ourworldindata.org/human-development-index. Accessed February 2, 2021
- 47. Roser M. Democracy 2013. https://ourworldindata.org/democracy. Accessed February 2, 2021
- 48. International Monetary Fund . GDP per Capita, Current Prices. 2021. https://www.imf.org/external/datamapper/NGDPDPC@WEO/OEMDC/ADVEC/WEOWORLD. Accessed February 21, 2021
- 49. The World Bank . GDP per Capita (Current US$). 2021. https://data.worldbank.org/indicator/NY.GDP.PCAP.CD. Accessed February 27, 2021
- 50. Ritchie H, Roser M. Smoking 2013. https://ourworldindata.org/smoking. Accessed January 26, 2021
- 51. The World Bank . Hospital beds (per 1,000 people). 2019. https://data.worldbank.org/indicator/SH.MED.BEDS.ZS. Accessed January 20, 2021
- 52. Roser M, Ritchie H. Burden of Disease 2016. https://ourworldindata.org/burden-of-disease. Accessed February 6, 2021.
- 53. Urashima M, Otani K, Hasegawa Y, Akutsu T. BCG vaccination and mortality of COVID‐19 across 173 countries: an ecological study. Int J Environ Res Public Health. 2020;17(15):5589. 10.3390/ijerph17155589 [DOI] [PMC free article] [PubMed] [Google Scholar]
- 54. Escobar L, Molina‐Cruz A, Barillas‐Mury C. BCG vaccine Rrotection from severe coronavirus disease 2019 (COVID‐19). Proc Natl Acad Sci U S A. 2020;117:17720‐17726. [DOI] [PMC free article] [PubMed] [Google Scholar]
- 55. Li H, Xu X, Dai D, Huang Z, Ma Z, Guan Y. Air pollution and temperature are associated with increased COVID‐19 incidence: a time series study. Int J Infect Dis. 2020;97:278‐282. [DOI] [PMC free article] [PubMed] [Google Scholar]
- 56. Pequeno P, Mendel B, Rosa C, et al. Air transportation, population density and temperature predict the spread of COVID‐19 in Brazil. PeerJ. 2020;8:e9322. [DOI] [PMC free article] [PubMed] [Google Scholar]
- 57. Wu Y, Jing W, Liu J, et al. Effects of temperature and humidity on the daily new cases and new deaths of COVID‐19 in 166 countries. Sci Total Environ. 2020;729:139051. [DOI] [PMC free article] [PubMed] [Google Scholar]
- 58. Comunian S, Dongo D, Milani C, Palestini P. Air pollution and Covid‐19: the role of particulate matter in the spread and increase of Covid‐19's morbidity and mortality. Int J Environ Res Public Health. 2020;17:4487. [DOI] [PMC free article] [PubMed] [Google Scholar]
- 59. The World Health Organisation . BCG Immunization Coverage Estimates by Country. 2020. https://apps.who.int/gho/data/view.main.80500?lang=en. Accessed February 2, 2021.
- 60. World Bank Group . Climate Change Knowledge Portal 2021. https://climateknowledgeportal.worldbank.org/. Accessed February 8, 2021.
- 61. Ritchie H, Roser M. Outdoor Air Pollution 2019. https://ourworldindata.org/outdoor-air-pollution. Accessed February 8, 2021
- 62. Everitt B. Medical Statistics from A to Z: A Guide for Clinicians and Medical Students. 2nd ed. Cambridge: Cambridge University Press; 2006. [Google Scholar]
- 63. Ho F, Celis‐Morales C, Gray S, et al. Modifiable and non‐modifiable risk factors for COVID‐19, and comparison to risk factors for influenza and pneumonia: results from a UKbiobank prospective cohort study. BMJ Open. 2020;10:e040402. [DOI] [PMC free article] [PubMed] [Google Scholar]
- 64. de Lusignan S, Dorward J, Correa A, et al. Risk factors for SARS‐CoV‐2 among patients in the Oxford Royal College of general practitioners research and surveillance Centre primary care network: a cross‐sectional study. Lancet Infect Dis. 2020;20:1034‐1042. [DOI] [PMC free article] [PubMed] [Google Scholar]
- 65. Gao M, Piernas C, Astbury NM, et al. Associations between Body‐Mass Index and COVID‐19 severity in 6.9 million people in England: a prospective, community‐based, Cohort Study. Lancet Diabetes Endocrinol. 2021;9(6):350‐359. 10.1016/S2213-8587(21)00089-9 [DOI] [PMC free article] [PubMed] [Google Scholar]
- 66. Albashir A. The potential impacts of obesity on COVID‐19. Clin Med. 2020;20:e109‐e113. [DOI] [PMC free article] [PubMed] [Google Scholar]
- 67. Gong M, Bajwa E, Thompson B, Christiani D. Body mass index is associated with the development of acute respiratory distress syndrome. Thorax. 2010;65:44‐50. [DOI] [PMC free article] [PubMed] [Google Scholar]
- 68. Mohammad S, Aziz R, Al Mahri S, et al. Obesity and COVID‐19: what makes obese host so vulnerable? Immun Age. 2021;18:1. [DOI] [PMC free article] [PubMed] [Google Scholar]
- 69. Hamer M, Kivimäki M, Gale C, Batty D. Lifestyle risk factors, inflammatory mechanisms, and COVID‐19 hospitalization: a community‐based cohort study of 387,109 adults in UK. Brain Behav Immun. 2020;87:184‐187. [DOI] [PMC free article] [PubMed] [Google Scholar]
- 70. Bae S, Kim S, Kim M, Shim W, Park S. Impact of cardiovascular disease and risk factors on fatal outcomes in patients with COVID‐19 according to age: a systematic review and meta‐analysis. Heart. 2021;107:373‐380. [DOI] [PubMed] [Google Scholar]
- 71. Reilev M, Kristensen K, Pottegård A, et al. Characteristics and predictors of hospitalization and death in the first 11 122 cases with a positive RT‐PCR test for SARS‐CoV‐2 in Denmark: a Nationwide cohort. Int J Epidemiol. 2020;49:1468‐1481. [DOI] [PMC free article] [PubMed] [Google Scholar]
- 72. Chadeau‐Hyam M, Bodinier B, Elliott J, et al. Risk factors for positive and negative COVID‐19 tests: a cautious and in‐depth analysis of UKbiobank data. Int J Epidemiol. 2020;49:1454‐1467. [DOI] [PMC free article] [PubMed] [Google Scholar]
- 73. Petrakis D, Margină D, Tsarouhas K, et al. Obesity ‐ a risk factor for increased COVID‐19 prevalence, severity and lethality (review). Mol Med Rep. 2020;22:9‐19. [DOI] [PMC free article] [PubMed] [Google Scholar]
- 74. Sehrawat S, Rouse B. Does the hygiene hypothesis apply to COVID‐19 susceptibility? Microbes Infect. 2020;22:400‐402. [DOI] [PMC free article] [PubMed] [Google Scholar]
- 75. Ou M, Zhu J, Ji P, et al. Risk factors of severe cases with COVID‐19: a meta‐analysis. Epidemiol Infect. 2020;148:e175. [DOI] [PMC free article] [PubMed] [Google Scholar]
- 76. Wang D, Hu B, Hu C, et al. Clinical characteristics of 138 hospitalized patients with 2019 novel coronavirus‐infected pneumonia in Wuhan, China. JAMA. 2020;323:1061‐1069. [DOI] [PMC free article] [PubMed] [Google Scholar]
- 77. Peters A, MacMahon S, Woodward M. Obesity as a risk factor for COVID‐19 mortality in women and men in the UKbiobank: comparisons with influenza/pneumonia and coronary heart disease. Diabetes Obes Metab. 2021;23:258‐262. [DOI] [PMC free article] [PubMed] [Google Scholar]
- 78. Kashyap V, Dhasmana A, Massey A, et al. Smoking and COVID‐19: adding fuel to the flame. Int J Mol Sci. 2020;21:6581. [DOI] [PMC free article] [PubMed] [Google Scholar]
- 79. Hopkinson N, Rossi N, El‐Sayed Moustafa J, et al. Current smoking and COVID‐19 risk: results from a population symptom app in over 2.4 million people. Thorax. 2021;76:714‐722. [DOI] [PubMed] [Google Scholar]
- 80. Zhao Q, Meng M, Kumar R, et al. The impact of COPD and smoking history on the severity of COVID‐19: a systemic review and meta‐analysis. J Med Virol. 2020;92:1915‐1921. [DOI] [PMC free article] [PubMed] [Google Scholar]
- 81. Alqahtani J, Oyelade T, Aldhahir A, et al. Prevalence, severity and mortality associated with COPD and smoking in patients with COVID‐19: a rapid systematic review and meta‐analysis. PLoS One. 2020;15:e0233147. [DOI] [PMC free article] [PubMed] [Google Scholar]
- 82. Meo S, Abukhalaf A, Alomar A, AlMutairi F, Usmani A, Klonoff D. Impact of lockdown on COVID‐19 prevalence and mortality during 2020 pandemic: observational analysis of 27 countries. Eur J Med Res. 2020;25:56. [DOI] [PMC free article] [PubMed] [Google Scholar]
- 83. Aleta A, Moreno Y. Evaluation of the potential incidence of COVID‐19 and effectiveness of containment measures in Spain: a data‐driven approach. BMC Med. 2020;18:157. [DOI] [PMC free article] [PubMed] [Google Scholar]
- 84. Gerli A, Centanni S, Miozzo M, et al. COVID‐19 mortality rates in the European Union, Switzerland, and the UK: effect of timeliness, lockdown rigidity, and population density. Minerva Med. 2020;111:308‐314. [DOI] [PubMed] [Google Scholar]
- 85. Bhadra A, Mukherjee A, Sarkar K. Impact of population density on COVID‐19 infected and mortality rate in India. Model Earth Syst Environ. 2021;7:623‐629. [DOI] [PMC free article] [PubMed] [Google Scholar]
- 86. Kadi N, Khelfaoui M. Population density, a factor in the spread of COVID‐19 in Algeria: statistic study. Bull Natl Res Cent. 2020;44:138. [DOI] [PMC free article] [PubMed] [Google Scholar]
- 87. Wang J, Tang K, Feng K, et al. Impact of temperature and relative humidity on the transmission of COVID‐19: a Modelling study in China and the United States. BMJ Open. 2021;11:e043863. [DOI] [PMC free article] [PubMed] [Google Scholar]
- 88. Singh AK, Gillies CL, Singh R, et al. Prevalence of co‐morbidities and their association with mortality in patients with COVID‐19: a systematic review and meta‐analysis. Diabetes Obes Metab. 2020;22:1915‐1924. [DOI] [PMC free article] [PubMed] [Google Scholar]
- 89. Vas P, Hopkins D, Feher M, Rubino F. M BW. Diabetes, obesity and COVID‐19: a complex interplay. Diabetes Obes Metab. 2020;22:1892‐1896. [DOI] [PMC free article] [PubMed] [Google Scholar]
Associated Data
This section collects any data citations, data availability statements, or supplementary materials included in this article.
Data Availability Statement
The authors declare that the data collected for the study was gathered from publicly available databases. All sources have been stated in the list of references and thus are available to others. This data includes country‐level characteristics which were used in the statistical analysis.