

Abstract
Coronavirus disease 2019 (COVID‐19) global pandemic is caused by severe acute respiratory syndrome‐coronavirus 2 (SARS‐CoV‐2) viral infection, which can lead to pneumonia, lung injury, and death in susceptible populations. Understanding viral dynamics of SARS‐CoV‐2 is critical for development of effective treatments. An Immune‐Viral Dynamics Model (IVDM) is developed to describe SARS‐CoV‐2 viral dynamics and COVID‐19 disease progression. A dataset of 60 individual patients with COVID‐19 with clinical viral load (VL) and reported disease severity were assembled from literature. Viral infection and replication mechanisms of SARS‐CoV‐2, viral‐induced cell death, and time‐dependent immune response are incorporated in the model to describe the dynamics of viruses and immune response. Disease severity are tested as a covariate to model parameters. The IVDM was fitted to the data and parameters were estimated using the nonlinear mixed‐effect model. The model can adequately describe individual viral dynamics profiles, with disease severity identified as a covariate on infected cell death rate. The modeling suggested that it takes about 32.6 days to reach 50% of maximum cell‐based immunity. Simulations based on virtual populations suggested a typical mild case reaches VL limit of detection (LOD) by 13 days with no treatment, a moderate case by 17 days, and a severe case by 41 days. Simulations were used to explore hypothetical treatments with different initiation time, disease severity, and drug effects to demonstrate the usefulness of such modeling in informing decisions. Overall, the IVDM modeling and simulation platform enables simulations for viral dynamics and treatment efficacy and can be used to aid in clinical pharmacokinetic/pharmacodynamic (PK/PD) and dose‐efficacy response analysis for COVID‐19 drug development.
Study Highlight.
WHAT IS THE CURRENT KNOWLEDGE ON THE TOPIC?
Several viral dynamics models have been developed to describe severe acute respiratory syndrome‐coronavirus 2 (SARS‐CoV‐2) viral infection. However, the connections among SARS‐CoV‐2 viral dynamics, immune response, and coronavirus disease 2019 (COVID‐19) disease severity are still not established, and a model that incorporate these mechanisms and can be readily applied to inform drug development is not available.
WHAT QUESTION DID THIS STUDY ADDRESS?
This study successfully developed the Immune‐Viral Dynamics Model (IVDM) for SARS‐CoV‐2 viral infection and COVID‐19 disease progression based on current biological mechanisms of SARS‐CoV‐2 viral infection. The model parameters are informed with a large public clinical dataset from literature. Viral infection and replication mechanisms of SARS‐CoV‐2, viral‐induced cell death, and time‐dependent immune response are incorporated in the model to describe the dynamics of viruses and immune response. Simulations are performed to explore possible clinical outcomes in response to different treatment options.
WHAT DOES THIS STUDY ADD TO OUR KNOWLEDGE?
The IVDM parameters are adequately informed and can well describe the individual viral load profiles from the dataset. Estimated time‐dependent immune response parameters suggests a potentially important role of adaptive immunity in controlling SARS‐CoV‐2 viral infection by actively killing infected cells. Disease severities are identified as a strong covariate for infected cell death rate, suggesting that slow immune killing of infected cell might prolong viral shedding and increase the risk of progression into severe disease.
HOW MIGHT THIS CHANGE CLINICAL PHARMACOLOGY OR TRANSLATIONAL SCIENCE?
The study also shows that the IVDM‐based modeling and simulations can be used to optimize treatment options to achieve clinical end points by simulating treatment effects and exploring optimal treatment options of SARS‐CoV‐2 antivirals. The IVDM can be readily integrated with population pharmacokinetic (PK) model of COVID‐19 study drugs to drive clinical trial simulations. It might serve as a useful tool to help develop treatment and prophylactic drugs for COVID‐19.
INTRODUCTION
Rapid spreading of severe acute respiratory syndrome‐coronavirus 2 (SARS‐CoV‐2) virus has caused the global pandemic of coronavirus disease 2019 (COVID‐19), which have infected over 150 million and killed over 3.2 million of people worldwide as of April 2021. 1 SARS‐CoV‐2 can infect multiple types of human endothelial cells that express angiotensin converting enzyme 2 (ACE2) receptor, the infection can lead to tissue damage in multiple organs and cause severe COVID‐19 disease and death. Effective antiviral drugs for SARS‐CoV‐2 are urgently needed to suppress within‐host SARS‐CoV‐2 viral infection and help combat the COVID‐19 pandemic.
Modeling the SARS‐CoV‐2 within‐host viral dynamics based on biological mechanisms of viral infection, replication, and viral‐induced cell death can provide help to quantitatively understand disease progression of COVID‐19. Such models can also provide platforms to explore and optimize treatment schemes in clinical studies. Immune response plays an important role in COVID‐19 disease progression. But it is not clear how and to what extend the immune response helps control the within‐host viral replication, and how viral load (VL) dynamics are related to disease severity. It is also not understood how efficacy of SARS‐CoV‐2 antivirals is impacted by differences in treatment timing and disease severity.
In this study, an Immune‐Viral Dynamics Model (IVDM) was developed to characterize the viral dynamics of SARS‐CoV‐2 and link the viral dynamics with COVID‐19 disease severity by incorporating key biological mechanisms of the viral infection. Mechanisms of time‐dependent immune response are incorporated to describe the generation of immunity against SARS‐CoV‐2. Disease severity levels are used as a covariate to link disease severity with SARS‐CoV‐2 viral dynamics. A dataset of 60 individual patients with COVID‐19 with clinical time course VL and reported disease severity levels were assembled from published literature to inform the model.
METHODS
Dataset
A set of longitudinal VL data from five published studies of SARS‐CoV‐2 infected patients 2 , 3 , 4 , 5 , 6 were assembled and the IVDM model was fitted to these data. Disease severity level for each subject was extracted from the publications and converted to the quantitative World Health Organization (WHO) ordinal severity scale 7 based on individual symptom descriptions from the publication. Both original symptom description and derived disease severity are included in Table S3. Some studies collected VL samples from multiple different locations and tissues, but the nasal/nasopharyngeal swab sampling provides the richest data and are available in all the studies. Oral swab data are not available for all subjects. Data from other sampling locations/tissues are sparse and not used for model fitting. Therefore, we choose to inform the model based on only nasal/nasopharyngeal data. Final analysis dataset includes 60 subjects with 5 mild cases, 36 moderate cases, and 19 severe cases. The dataset used in this study is described in Supporting information (SI) and summarized in Table S1. A summary of the final analysis dataset is shown in Table S2 and Table S3.
Viral dynamics model
The previously published HIV IVDM 8 was leveraged to develop a SARS‐CoV‐2 viral dynamics system. We assume the human lung epithelial cells are the main target cells (T). Based on current knowledge, the main lung epithelial cells targeted by SARS‐CoV‐2, alveolar type 1 (AT1) cells, have a limited regeneration capacity and take a few weeks to repopulate and regenerate in adult humans after acute injuries. 9 , 10 , 11 Therefore, a target‐cell (T) limited viral dynamics model was developed to describe the biological mechanisms (Figure 1), and we ignore target cell regeneration in the current model and only estimate the initial size of SARS‐CoV‐2 susceptible target cell T 0. After the cell is infected by the virus with an infectivity β, it becomes an infected cell (I), which can be actively killed at a per capita rate δ by mechanisms, including viral cytopathic effects, innate immunity, and cell‐based adaptive immunity. The infected cells produce infectious viruses at a rate p. The virus is cleared at rate c from the host. We consider infected cell death rate may increase when SARS‐CoV‐2 adaptive immunity is generated, usually a few weeks post infection, 12 , 13 similar to the scenario in influenza infection. 14 The immune‐induced cell death rate is modeled with a time‐dependent immune effect assuming that it takes T 50 days of time to generate 50% of the maximum adaptive immunity with an added maximum immune‐induced cell killing rate maximum unbound systemic concentration (I max), and a Hill coefficient (n) for the immune response. The model equations are shown in Equation 1.
| (1) |
FIGURE 1.
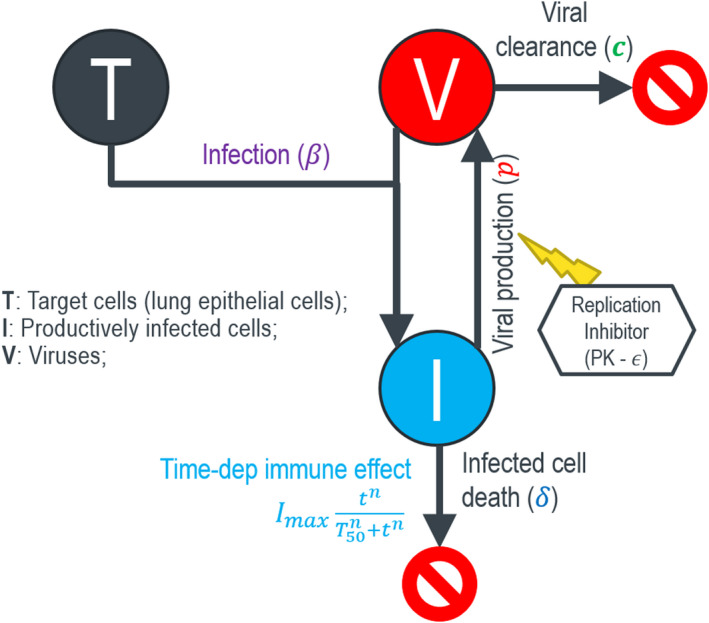
Target‐cell limited viral dynamics model for SARS‐CoV‐2 viral infection and disease severity. Imax, maximum unbound systemic concentration; PK, pharmacokinetic; SARS‐CoV‐2, severe acute respiratory syndrome‐coronavirus 2
The drug effect parameter ε is used to model and simulate the treatment efficacy of an assumed antiviral. In current study, we represent drug effects as acting to reduce viral production rate (p) with no effects on other parameters. As data emerges from future treatment studies, this assumption will be further tested and evaluated.
Population modeling estimation was conducted in Monolix 2019R1. 15 The viral infection rate parameter (β), the amount of target cells (λ), the maximum adaptive immune killing rate (I max), and the Hill exponent (n) are estimated for their typical population parameters as a constant without interindividual variability. Other parameters, including viral production rate (p), infected cell death rate (δ), viral clearance rate (c), and the immune activation parameter (T 50) are estimated with interindividual variabilities. Disease severity was tested as a discrete covariate on all four parameters with random effect. Given the individual demographics were not available for most patients, typical covariate exploration for demographic factors was not possible.
Nasal swab VL data may contain considerable sampling variability. 16 Although there may be inter‐site and inter‐study variabilities in VL data, it is challenging to detect them from this small dataset with high sampling variability in the background. Therefore, we lump these variabilities into the residual error, and implemented a constant error model to capture it without differentiating sites and studies. We assume the residual error of log10 VL follows a Gaussian distribution, and the standard deviation (SD) is estimated (Table 1). Detailed description about the approach can be found in the SI. All estimated parameter values along with their precisions are presented in Table 1. The adequacy of the final model was evaluated using the visual predictive check (VPC).
TABLE 1.
Estimated parameters of the COVID‐19 IVDM
| Parameter | Description | Value | Stochastic approximation | ||
|---|---|---|---|---|---|
| SE | RSE (%) | ||||
| Fixed effects | |||||
|
|
Number of target cells (cells/ml) | 5.76e+3 | 1.13e+3 | 19.6 | |
|
|
Viral infection rate () | 5.97e−5 | 1.36e−5 | 22.7 | |
|
|
Infected cell death rate in mild cases () | 0.994 | 0.327 | 32.9 | |
|
|
covariate for moderate cases (0.7) | −0.294 | 0.325 | 111 | |
|
|
covariate for severe cases (0.28) | −0.942 | 0.367 | 39 | |
|
|
Viral production rate () | 3.84e+3 | 2.62e+3 | 68.3 | |
|
|
Viral clearance rate () | 25.4 | 16.9 | 66.5 | |
|
|
Time of half immune activation () | 32.6 | 6.52 | 20 | |
|
|
Hill exponent for time‐dependent immune suppression | 8.18 | 0.793 | 9.69 | |
|
|
Max immune induced cell death rate () | 175 | 47.9 | 27.3 | |
| Standard deviation of the random effects (CV%) | |||||
|
|
Variability for | 0.414 (43.2) | 0.0713 | 17.2 | |
|
|
Variability for | 1.72 (427%) | 0.563 | 32.6 | |
|
|
Variability for | 1.23 (188%) | 0.338 | 27.4 | |
|
|
Variability for | 0.686 (77.5%) | 0.165 | 24 | |
| Error model parameters | |||||
|
|
Residual error | 1.65 | 0.0851 | 5.16 | |
Abbreviations: CV%, percent coefficient of variation; COVID‐19, coronavirus disease 2019; IVDM, Immune‐Viral Dynamics Model.
RESULTS
Characteristics of patient population
Viral load data of the 60 subjects in the analysis dataset are grouped by disease severity (Figure 2). The majority of subjects have VL samples starting from one or more days after symptom onset. Typical trajectory does not have VL data in the upslope phase and is almost monotonically declining from the first time point to below the limit of quantification (LOQ) in the end. Most likely the starting time of VL sampling has already passed the peak VL. The declining VL profile is similar to other respiratory viral infections, such as influenza A virus (IAV) 17 and respiratory syncytial virus (RSV). 18 , 19 These respiratory viral infections are typically acute infections in that most infected people can clear the virus autonomously, which are different from other long‐term persistent viruses, such as HIV and cytomegalovirus (CMV), in which the VL is maintained relatively stable around a setpoint and progress to chronic long‐term infection when not treated. Remarkably, the data show that the VL dynamics persist longer in more severe disease than in mild disease (Figure 2 and Figure 4). Positive VL persists 8.6 days on average in mild cases, 12.0 days in moderate cases, and 19.6 days in severe cases (Table S4).
FIGURE 2.
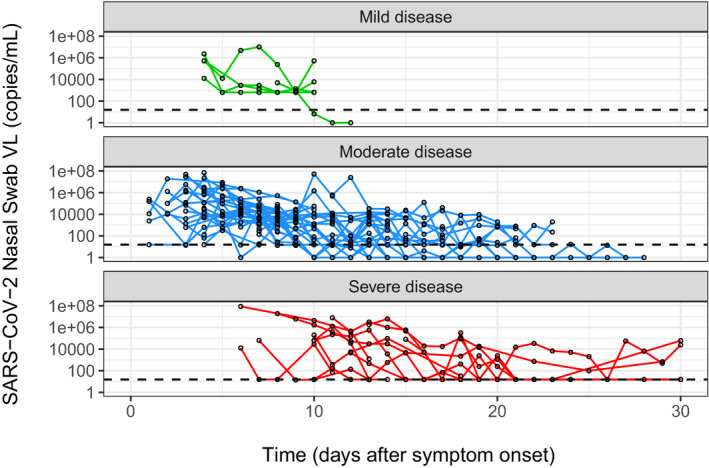
Viral dynamics profiles in different disease severity levels. SARS‐CoV‐2, severe acute respiratory syndrome‐coronavirus 2; VL, viral load
FIGURE 4.

Correlations between predicted +VL days, VL AUC and severity. Positive VL duration and VL AUC are calculated from individually simulated VL profiles from the dataset. Duration of positive VL calculated from the dataset are overlaid to show the consistence between data and simulations. AUC, area under the curve; SARS‐CoV‐2, severe acute respiratory syndrome‐coronavirus 2; VL, viral load
To note, because all the samples are collected after symptom onset with unknown time of infection and most after the peak VL, data during exponential growth phase are largely missing, and it is infeasible to accurately infer the time of infection.
Model fitting and parameter estimates
Proposed IVDM well‐described the individual viral dynamics (Figure 3). Individually simulated VL profiles are able to adequately capture the height of the VL peaks, the duration of positive VL, and the slopes of VL declines across disease severity levels (Figure 3). The model simulates and captures the two‐phase VL decay dynamics, with the slow first‐phase decay and a fast second‐phase decay. The goodness of fits plot (Figure S3) shows the model‐predicted VL are well aligned with observations from the dataset, and VPCs (Figure S4) are able to reproduce the data in different disease severity levels, both suggesting the model is well performed. Parameters are estimated with reasonable precisions (Table 1).
FIGURE 3.

VL data and fitting. Black dots are VL data. Horizontal red dashed lines are the LLOQ of VL (15.49 copies/ml). Solid lines are fits of VL for each subject based on their individual parameters. Subjects with green, blue, and red solid lines are mild, moderate, and severe cases, respectively. LLOQ, lower limit of quantification; SARS‐CoV‐2, severe acute respiratory syndrome‐coronavirus 2; VL, viral load
Typical VL profiles differ in different disease severity levels (Figure S1). Mathematically, the IVDM parameters are supported by specific viral dynamic features. As examples, viral production and clearance rates p and c are determined by the peak and overall setpoint VL. High viral production and low viral clearance produce a high VL peak and setpoint, and vice versa. The typical value of viral production rate was estimated as viruses per cell per day, and viral clearance rate was estimated as per day. The viral infectivity was estimated as . The density of target cells λ was estimated as 5,760 cells/ml. Note that λ is not linked to physiological meaning as lack of data to inform susceptible cell number in lung tissue. Mechanistically, the rate of first phase VL decline depends on the rate of infected cell death, which was estimated as , suggesting a half‐life of the infected cells around 0.7 days. If without immune effect, VL will decline in a log‐linear fashion until reaching below the LOQ. However, the fitted VL curves (Figure 3) show a clear inflection point in many subjects, after which VL declines more rapidly. This suggests a second phase VL decline may be driven by adaptive immune effects and the inflection point informs the time‐dependent immune parameter T 50 and the slope of the second phase decline inform the maximum immune killing parameter I max. The Hill coefficient n was estimated as n = 8.18, and the time‐dependent immune response parameters are estimated as and . Note that the estimated large Hill coefficient suggests a steep immune response, whether this reflects the biological truth needs to be further validated with evidences from future studies. Fitting the model with fixed n = 5 was tested, which did not further improve the fits. Similar immune‐controlled two‐phase VL decay was also observed in other respiratory viral infections. 14
Link disease severity with infected cell death rate
To link COVID‐19 severity with the viral dynamics, correlations between disease severity levels and parameter random effects are tested using Pearson correlation and analysis of variance (ANOVA) using Monolix 2019R1. 15 Among the four parameters with random effects, only the infected cell killing rate shows significant correlation with disease severity. Therefore, disease severity was incorporated into the model to modify the infected cell death rate in moderate and severe cases relative to in mild cases. Based on estimated parameters, the typical infected cell death rate in moderate cases is 0.75‐fold () of that in mild cases, and in severe cases is 0.39‐fold () of that in mild cases (Table 1). Slower cell killing rates estimated for moderate and severe cases produce prolonged duration of positive VL. Although evidences showed implications of immune response with COVID‐19 severity, the disease severity level was not identified as a covariate for time‐dependent immune parameter T 50 in this study. The hypothesis will be further tested when more data are available.
To further investigate the relationship between disease severity and VL dynamics, duration of positive VL (+VL) and VL area under the curve (AUC) were calculated for each subject and plotted with the disease severity (Figure 4). Strong correlations are shown between disease severity and +VL duration. This association between disease severity and VL persistence are consistent and supported by findings from other studies. 20 , 21 , 22 , 23 Simulated individual profiles also showed an elevated VL AUC in severe cases than in mild and moderate cases, but no difference between mild and moderate cases (Figure 4).
Simulations
Moderate and severe disease population was generated from mild virtual population by multiplying the estimated disease severity covariate parameter on infected cell death rate. Simulations of VL dynamics in mild, moderate, and severe diseases were performed without treatment (Figure S2). Typical simulated VL dynamics go through a rapid exponential growth to the peak VL at around day 1 post symptom onset and start to decline after the peak. Note that the time to reach the peak VL is extremely short, which might not be biologically realistic. The current model starts from the time of symptom onset rather than of infection due to lack of data between infection and symptom onset. As a result, model parameters may be biased toward generating a rapid viral growth to capture the peak VL. Future human challenge study data may help address these issues. The peak has a >2 log10 variability between individuals, consistent with observed data. Table S4 shows summary statistics for simulated VL profiles in mild, moderate, and severe diseases. Notably, both VL duration and VL AUC are roughly doubled in severe cases than in mild cases, whereas the mean peak VL does not change as much, further suggesting that the duration rather than the height of VL may serve as a better indicator for disease severity.
Exploring treatment options in reducing VL AUC and +VL duration
To demonstrate the use of such modeling to inform decisions, simulations with hypothetical antivirals were performed to show the potential efficacy in reducing +VL days and VL AUC at different possible scenarios of disease severity (mild, moderate, and severe), drug effect (0.80 and 0.95), and treatment start time (0, 1, …, 20 days post symptom onset). Two treatment options with long‐term and short‐term treatment durations were explored. Long‐term treatment was to continue the treatment until the viral infection is eradicated, and the short‐term option will continue the treatment only for a fixed duration (i.e., 10 days in this study). More descriptions about modeling and simulation approaches can be found in SI.
Simulation results show that initiation of long‐term treatment with drug effect at day 0 after infection may reduce the VL AUC by 14‐fold for mild, 15‐fold for moderate, and 17‐fold for severe diseases (Figure 5). A 10‐day treatment starting at day 0 may reduce the VL AUC by 8.7‐fold, 9.0‐fold, and 7.4‐fold for mild, moderate, and severe cases, respectively (Figure 5). However, a less potent drug with effect at starting at day 0 may only reduce the VL AUC by ~4.5‐fold compared to no treatment. Regardless of treatment duration and drug effect, magnitude of VL AUC reduction diminishes when start time of treatment is further delayed. If treatment is initiated 10 days post symptom onset in severe cases and ~5 days post symptom onset in mild and moderate cases, it will not effectively reduce any VL AUC comparing to no treatment (Figure 5). This finding suggests the critical importance of early initiation of antiviral treatment, and is consistent with other modeling studies. 24 , 25
FIGURE 5.
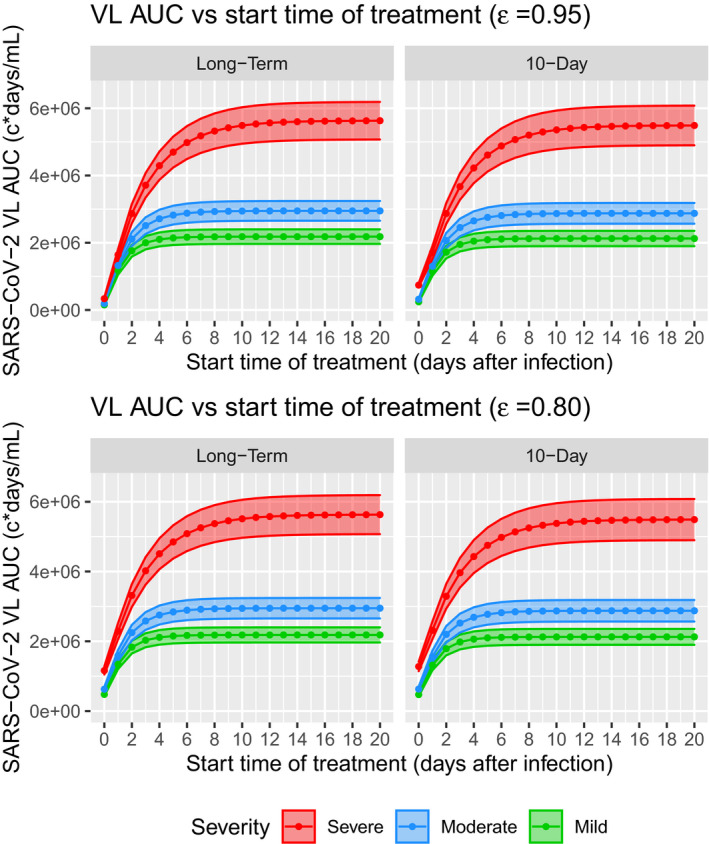
Predicted responses in hypothetical scenarios of VL AUC versus start time of treatment from virtual population simulations. Solid lines and dots are the mean VL AUC, and shaded areas are 95% confidence intervals. AUC, area under the curve; SARS‐CoV‐2, severe acute respiratory syndrome‐coronavirus 2; VL, viral load
Reduction in +VL duration is another important indicator for treatment efficacy, however, the simulations showed mixed results. For long‐term treatment, simulations showed that with strong drug effect (), starting the treatment at day 1 post symptom onset can reduce +VL duration most significantly across disease severity levels (Figure 6). Specifically, the +VL duration can be reduced from 11.3 to 8.2 days (27%) for mild disease, from 13.9 to 10.6 days (24%) for moderate disease, and from 20.0 to 16.8 days (16%) for severe disease. The effect for less potent drug () is smaller, specifically 13%, 11%, and 7.5% for mild, moderate, and severe diseases, respectively (Figure 6). This result further suggests it is important to initiate antiviral treatment early.
FIGURE 6.
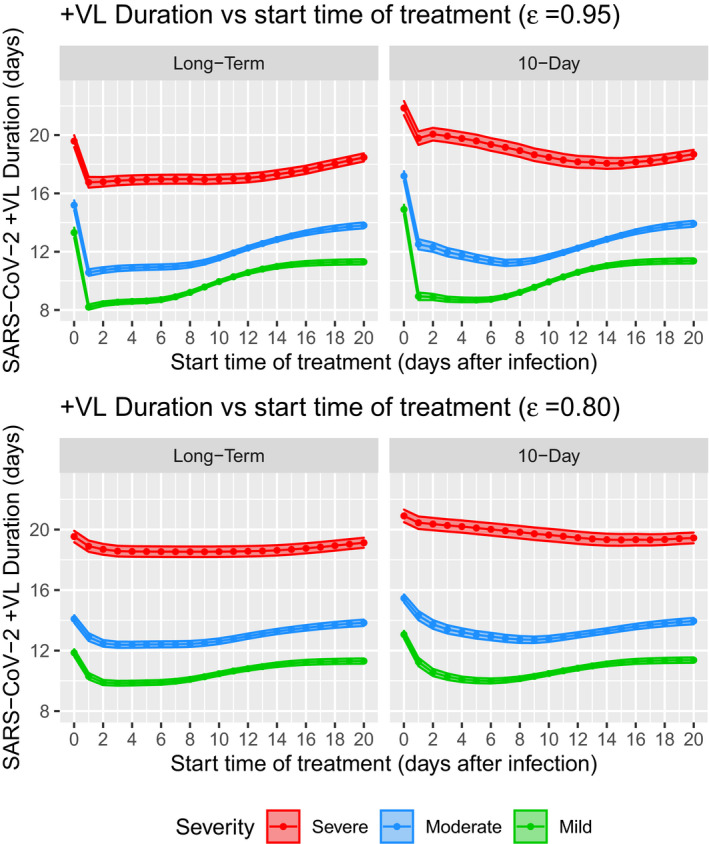
Predicted positive in hypothetical scenarios of VL duration versus start time of treatment from virtual population simulations. Solid lines and dots are the mean +VL duration, and shaded areas are 95% confidence intervals. SARS‐CoV‐2, severe acute respiratory syndrome‐coronavirus 2; VL, viral load
However, for short‐term regimen of 10 days with , simulations showed largest reduction in +VL duration can be achieved by initiating the treatment at 5, 7, and 15 days post symptom onset in mild, moderate, and severe cases (Figure 6), with maximum reduction of +VL duration by 23%, 19%, and 9.5%, respectively. For less potent drug with , largest reduction of +VL duration can be achieved when initiating the treatment at 6, 9, and 17 days post symptom onset for mild, moderate, and severe cases with maximum reduction of 11.5%, 8.6%, and 3.5%, respectively (Figure 6). This prediction suggests that initiating short‐term regimen too early may not maximally reduce +VL duration.
Additionally, simulations predicted that starting long‐term treatment at day 0 post symptom onset would increase +VL duration in both mild and moderate diseases for about 0.2–2 days, and marginally decrease +VL duration in severe cases for 0.5 days compared to no treatment (Figure 6). For short‐term regimen, initiating at day 0 may even prolong +VL duration for 0.9–3.6 days across all disease severities and different drug effect levels (Figure 6).
Note that these simulation‐based predictions are certainly bounded by model assumptions. The simulation showed here is a possible truth but may not be the only possible truth. Particularly, the predictions for reduction of +VL duration should be taken with caution. These results demonstrated that such models can be used to explore and understand the impact of treatment timing and duration choices, but further model development, including data obtained under antiviral treatments, would be needed to confirm the best model to describe drug effect and viral responses.
DISCUSSIONS AND CONCLUSIONS
An IVDM was developed based on public clinical data from literature to characterize the viral dynamics during SARS‐CoV‐2 infection and link it with COVID‐19 severity. A target‐cell limited model structure was adopted. Similar structural model was used to study other respiratory viral infections, such as IAV 17 , 26 and RSV. 27 To characterize the rapid second phase decay in flu infection, Smith et al. developed a model to incorporate the adaptive immune response for the flu based on data from mice models, and suggested the fast second phase decay is contributed by immune‐mediated viral suppression. 14 Due to limited data in COVID‐19, a simplified time‐dependent immune response was adopted to capture the fast second phase viral decay in this study, in which the generation of adaptive immunity is modeled with a time‐dependent Hill function. Simulations based on the fitted model show that this modeling structure can capture the two‐phase SARS‐CoV‐2 VL decay. Incorporating the adaptive immune response is important not only to correctly characterize viral dynamics, but also to enable improved predictions of treatment outcomes, as the immune response may impact the +VL duration. Two other SARS‐CoV‐2 viral dynamics models also incorporated immune response mechanism. 25 , 28 Goyal et al. implemented a multistage differentiation and maturing mechanism of SARS‐COV‐2‐specific immune effector cells. 25 However, such a complex model would require more multifaceted data, which currently do not exist, to support and inform model parameters. Wang et al. incorporated the mechanism of lymphocytes recruitment to the site of infection to actively kill infected cells. 28 But it may also have difficulty to inform the recruitment rate parameter using only VL data. The other two models do not have immune effects. 24 , 29 Given the importance of immune response, future models should incorporate appropriate immune modules when SARS‐CoV‐2‐specific immune response are better understood, and more data are available to inform more complex models.
A longitudinal VL dataset with 60 nontreated subjects were assembled from published COVID‐19 clinical research papers. 2 , 3 , 4 , 5 , 6 The disease severity in this dataset were derived for each subject from the publications across all three disease severity levels. Because the SARS‐CoV‐2 VL typically serves as a biomarker and end point in COVID‐19 treatment drug development and clinical trials, it is important to understand the connections between SARS‐CoV‐2 viral dynamics and COVID‐19 severity. This dataset augmented with disease severity allow us to develop and justify the IVDM model structure, estimate model parameters with reasonable precision, and build the association between viral dynamics and disease severity for SARS‐CoV‐2 infection. The data show significant correlations between +VL duration and disease severity (Figure 4), such correlations have been consistently shown in other experimental studies. 20 , 21
Covariate analysis of the IVDM identified the disease severity as a significant covariate on infected cell death rate, which is likely controlled by multiple factors including innate immune response, 30 adaptive immune response, and infection‐induced cytotoxicity. Viral infection‐induced programmed cell death has been acknowledged as part of the innate immunity against viral infection. 30 Numerous studies have shown the importance of innate immunity and the coordination between innate and adaptive immunity in relation to COVID‐19 severity. 13 Our IVDM modeling results suggest that slow infected cell death rate, which may be caused by a weak innate immune response against SARS‐CoV‐2, can lead to prolonged +VL duration and further lead to more severe cases of COVID‐19. The model did not identify association of disease severity with other model parameters, such as viral clearance. Infected cell death is a slower process than viral clearance, therefore it dominates the natural viral decay rate as the rate limiting step in this process. More clinical/immunology data would be helpful to further reveal the mechanism of disease severity. Currently there is not a biomarker allowing predicting disease severity a priori, the IVDM model with disease severity covariate can provide a useful tool to simulate treatment outcomes in different severities.
The model estimated on average p = 3840 virions would be produced from each infected cell per day, and infected cell death rate is about per day, which corresponds to a total of about = 3863 virions (burst size) produced during its life span. This is on the same order of magnitude as the estimate based on murine coronavirus. 31 However, direct measurements from SARS‐CoV‐2 are still lacking. In addition, note the estimated value of p is correlated with viral infectivity β. Future data to inform values of both viral production and infectivity parameters are desired.
Viral load profile of a few subjects was not well captured by current model, such as subjects 10004, 10007, and 20009 (Figure 3). Additional mechanisms may be needed to explain the viral persistence observed in subjects 10004 and 10007. Regeneration of target cells may be incorporated to sustain longer term viral infection and replication. Subject 20009 shows an interesting VL profile that reaches the below LOQ level around day 15 and followed by a rebound back to 104 copies/ml level. This post‐suppression breakthrough may be explained by failed immune control or viral infiltration to other organs to flare up additional viral replications. These new mechanisms can be considered and tested in future studies when richer data are available.
To demonstrate the usefulness of the model in informing decisions, different clinical outcomes, including reductions in VL AUC and +VL duration were compared between hypothetical scenarios of long‐term and short‐term treatment in mild, moderate, and severe diseases. Among these scenarios, long‐term treatment would provide the most clinical benefit in terms of reducing both VL AUC and +VL duration (Figure 5, Figure 6). Particularly, long‐term treatment initiated at the earliest time after infection may reduce the VL AUC by greater than >90%, which suggests 90% of the tissue damage may be prevented by initiating treatment early, assuming VL AUC is associated with lung tissue damage. This result suggests that pre‐exposure prophylaxis (PrEP), post‐exposure prophylaxis (PEP), and early initiation of antiviral treatment can be beneficial options to limit the damage caused by SARS‐CoV‐2 infection.
Model simulations generated mixed results for the endpoint of reducing +VL duration. The model predicted that late initiation of treatment would show larger reduction in +VL duration in short‐term treatment, and initiating treatment immediately post symptom onset may prolong the +VL duration rather than reduce it. These counterintuitive results are because the model assumes that the infection will not stop until all the cells are infected, which might not be true, as it is evident that in most mild/moderate cases with no need for hospitalization, the host may spontaneously control the viral infection before all the target cells (lung epithelial cells) are infected and killed. The assumptions need to be revisited and tested when more data are available. It also should be cautious when interpreting +VL duration in clinical setting as large reduction in +VL duration may not directly translate to clinical benefits. These counterintuitive results may also be attributed to lack of other viral suppression mechanisms in the current model, such as immune response to maintain a sustained viral suppression after treatment ended. To compensate the effect of lacking immune suppression, the model used late treatment initiation to suppress late‐phase viral dynamics from post‐treatment rebound. A more mechanistic immune module in future models may help with this issue.
The IVDM can be used as a platform to simulate the treatment effect and explore the optimal treatment option of SARS‐CoV‐2 antivirals. The IVDM can be readily integrated with the population pharmacokinetic (PK) model of COVID‐19 study drugs to explore the potential treatment efficacy and optimize treatment strategy in clinic. The current model explored drug effects acting on reducing viral production rate (p), which may represent mechanism of action (MOA) of antivirals, such as remdesivir. 32 In future studies, it is important to explore the drug effect on other parameters, particularly on viral infectivity β, which represents the MOA of antibody and molnupiravir treatments. The IVDM may serve as a tool to help develop a drug as prophylaxis for COVID‐19. Both VL AUC and +VL duration are likely important factors to consider in design clinical trials. How to optimally achieve both end points can be helped with using modeling and simulations.
In conclusion, we successfully developed the IVDM based on the current knowledge of SARS‐CoV‐2 biological mechanisms and disease progression. A clinical dataset was assembled from literature with longitudinal VL and individual disease severity. The model parameters were estimated using the dataset with reasonable precision, and the model can adequately capture and explain the VL data. Simulations have been performed to explore possible clinical outcomes in response to different treatment options. The IVDM can serve as a platform to aid in drug development for SARS‐CoV‐2 viral infection, for example, it can be used to deconvolve the effect of the baseline VL at the beginning of treatment when modeling the drug effect and can also be used to model the treatment effect reflected in increasing VL clearance slopes.
Meanwhile, we acknowledge that this is still the early stage in understanding the SARS‐CoV‐2 viral infection and dynamics in COVID‐19. Emerging knowledge and data in the coming months/years will allow further model refinement and qualification. Currently available treatment data are not adequate to inform treatment effects on SARS‐CoV‐2 virology. Incorporation of VL time course clinical data from antiviral therapies with demonstrated perturbations in the VL profile will be important to fully inform drug effect elements and underlying viral system parameters in this model.
CONFLICT OF INTEREST
Y.C., W.G., L.C., and J.A.S. are employees of Merck Sharp & Dohme Corp., a subsidiary of Merck & Co., Inc. (Kenilworth, NJ), and may own stock/stock options in the company.
AUTHOR CONTRIBUTIONS
Y.C., W.G., L.C., and J.A.S. wrote the manuscript. Y.C. designed the research. Y.C. performed the research. Y.C., W.G., and J.A.S. analyzed the data. Y.C., W.G., and J.A.S. contributed new reagents/analytical tools.
Supporting information
Supplementary Material
Supplementary Material
ACKNOWLEDGEMENTS
The authors appreciate Drs. Matthew Rizk, Jay Grobler, Kenneth Koeplinger, Randy Miller, and Ruthie Birger for helpful discussions and comments. We also thank Drs. Amy Cheung and Nele Mueller‐Plock, and the Certara team to help digitizing part of the literature data.
Cao Y, Gao W, Caro L, Stone JA. Immune‐viral dynamics modeling for SARS‐CoV‐2 drug development. Clin Transl Sci. 2021;14:2348–2359. 10.1111/cts.13099
Funding information
No funding was received for this work.
REFERENCES
- 1. WHO . WHO Coronavirus (COVID‐19) Dashboard. https://covid19.who.int/. [Google Scholar]
- 2. Huang Y, Chen S, Yang Z, et al. SARS‐CoV‐2 viral load in clinical samples from critically Ill patients. Am J Respir Crit Care Med. 2020;201(11):1435‐1438. [DOI] [PMC free article] [PubMed] [Google Scholar]
- 3. Gautret P, Lagier JC, Parola P, et al. Hydroxychloroquine and azithromycin as a treatment of COVID‐19: results of an open‐label non‐randomized clinical trial. Int J Antimicrob Agents. 2020;56(1):105949. [DOI] [PMC free article] [PubMed] [Google Scholar] [Retracted]
- 4. Wolfel R, Corman VM, Guggemos W, et al. Virological assessment of hospitalized patients with COVID‐2019. Nature. 2020;581(7809):465‐469. [DOI] [PubMed] [Google Scholar]
- 5. Young BE, Ong SWX, Kalimuddin S, et al. Epidemiologic features and clinical course of patients infected with SARS‐CoV‐2 in Singapore. JAMA. 2020;323(15):1488. [DOI] [PMC free article] [PubMed] [Google Scholar]
- 6. Zou L, Ruan F, Huang M, et al. SARS‐CoV‐2 viral load in upper respiratory specimens of infected patients. N Engl J Med. 2020;382(12):1177‐1179. [DOI] [PMC free article] [PubMed] [Google Scholar]
- 7. WHO Working Group on the Clinical Characterisation and Management of COVID‐19 infection . A minimal common outcome measure set for COVID‐19 clinical research. Lancet Infect Dis. 2020;20(8):e192‐e197. [DOI] [PMC free article] [PubMed] [Google Scholar]
- 8. Cao Y, Cartwright EK, Silvestri G, Perelson AS. CD8+ lymphocyte control of SIV infection during antiretroviral therapy. PLoS Pathog. 2018;14(10):e1007350. [DOI] [PMC free article] [PubMed] [Google Scholar]
- 9. Chen J, Wu H, Yu Y, Tang N. Pulmonary alveolar regeneration in adult COVID‐19 patients. Cell Res. 2020;30(8):708‐710. [DOI] [PMC free article] [PubMed] [Google Scholar]
- 10. Valyaeva AA, Zharikova AA, Kasianov AS, Vassetzky YS, Sheval EV. Expression of SARS‐CoV‐2 entry factors in lung epithelial stem cells and its potential implications for COVID‐19. Sci Rep. 2020;10(1):17772. [DOI] [PMC free article] [PubMed] [Google Scholar]
- 11. Hoffmann M, Kleine‐Weber H, Schroeder S, et al. SARS‐CoV‐2 cell entry depends on ACE2 and TMPRSS2 and is blocked by a clinically proven protease inhibitor. Cell. 2020;181(2):271‐280 e8. [DOI] [PMC free article] [PubMed] [Google Scholar]
- 12. Guo L, Ren L, Yang S, et al. Profiling early humoral response to diagnose novel coronavirus disease (COVID‐19). Clin Infect Dis. 2020;71(15):778‐785. [DOI] [PMC free article] [PubMed] [Google Scholar]
- 13. Rydyznski Moderbacher C, Ramirez SI, Dan JM, et al. Antigen‐specific adaptive immunity to SARS‐CoV‐2 in acute COVID‐19 and associations with age and disease severity. Cell. 2020;183(4):996‐1012. [DOI] [PMC free article] [PubMed] [Google Scholar]
- 14. Myers MA, Smith AP, Lane LC, et al. Dynamically linking influenza virus infection with lung injury to predict disease severity. bioRxiv. 10.1101/555276 [DOI] [PMC free article] [PubMed] [Google Scholar]
- 15. SAS, L . Monolix version 2019R1. Antony, France: Lixoft SAS. http://lixoft.com/products/monolix/. [Google Scholar]
- 16. Van Wesenbeeck L, Meeuws H, D’Haese D, et al. Sampling variability between two mid‐turbinate swabs of the same patient has implications for influenza viral load monitoring. Virol J. 2014;11:233. [DOI] [PMC free article] [PubMed] [Google Scholar]
- 17. Hadjichrysanthou C, Cauët E, Lawrence E, Vegvari C, de Wolf F, Anderson RM. Understanding the within‐host dynamics of influenza A virus: from theory to clinical implications. J R Soc Interface. 2016;13(119):20160289. [DOI] [PMC free article] [PubMed] [Google Scholar]
- 18. El Saleeby CM, Bush AJ, Harrison LM, Aitken JA, DeVincenzo JP. Respiratory syncytial virus load, viral dynamics, and disease severity in previously healthy naturally infected children. J Infect Dis. 2011;204(7):996‐1002. [DOI] [PMC free article] [PubMed] [Google Scholar]
- 19. Garcia‐Maurino C, Moore‐Clingenpeel M, Thomas J, et al. Viral load dynamics and clinical disease severity in infants with respiratory syncytial virus infection. J Infect Dis. 2019;219(8):1207‐1215. [DOI] [PMC free article] [PubMed] [Google Scholar]
- 20. Fajnzylber JM, Regan J, Coxen K, et al. SARS‐CoV‐2 viral load is associated with increased disease severity and mortality. Nat Commun. 2020;11(5493):1–9. [DOI] [PMC free article] [PubMed] [Google Scholar]
- 21. Liu Y, Yan L‐M, Wan L, et al. Viral dynamics in mild and severe cases of COVID‐19. Lancet Infect Dis. 2020;20(6):656‐657. [DOI] [PMC free article] [PubMed] [Google Scholar]
- 22. Pujadas E, Chaudhry F, McBride R, et al. SARS‐CoV‐2 viral load predicts COVID‐19 mortality. Lancet Respir Med. 2020;8(9):e70. [DOI] [PMC free article] [PubMed] [Google Scholar]
- 23. Westblade LF, Brar G, Pinheiro LC, et al. SARS‐CoV‐2 viral load predicts mortality in patients with and without cancer who are hospitalized with COVID‐19. Cancer Cell. 2020;38(5):661‐671.e2. [DOI] [PMC free article] [PubMed] [Google Scholar]
- 24. Goncalves A, Bertrand J, Ke R, et al. Timing of antiviral treatment initiation is critical to reduce SARS‐Cov‐2 viral load. CPT Pharmacometrics Syst Pharmacol. 2020;9:509‐514. [DOI] [PMC free article] [PubMed] [Google Scholar]
- 25. Goyal A, Cardozo‐Ojeda EF, Schiffer JT. Potency and timing of antiviral therapy as determinants of duration of SARS CoV‐2 shedding and intensity of inflammatory response. Sci Adv. 2020;6(47):eabc7112. [DOI] [PMC free article] [PubMed] [Google Scholar]
- 26. Smith AM, Ribeiro RM. Modeling the viral dynamics of influenza A virus infection. Crit Rev Immunol. 2010;30(3):291‐298. [DOI] [PubMed] [Google Scholar]
- 27. Wethington D, Harder O, Uppulury K, et al. Mathematical modelling identifies the role of adaptive immunity as a key controller of respiratory syncytial virus in cotton rats. J R Soc Interface. 2019;16(160):20190389. [DOI] [PMC free article] [PubMed] [Google Scholar]
- 28. Wang S, Pan Y, Wang Q, Miao H, Brown AN, Rong L. Modeling the viral dynamics of SARS‐CoV‐2 infection. Math Biosci. 2020;328:108438. [DOI] [PMC free article] [PubMed] [Google Scholar]
- 29. Kim KS, Ejima K, Ito Y, et al. Modelling SARS‐CoV‐2 dynamics: implications for therapy. medRxiv. 10.1101/2020.03.23.20040493. [DOI] [Google Scholar]
- 30. Jorgensen I, Rayamajhi M, Miao EA. Programmed cell death as a defence against infection. Nat Rev Immunol. 2017;17(3):151‐164. [DOI] [PMC free article] [PubMed] [Google Scholar]
- 31. Bar‐On YM, Flamholz A, Phillips R, Milo R. SARS‐CoV‐2 (COVID‐19) by the numbers. Elife. 2020;9:e57309. [DOI] [PMC free article] [PubMed] [Google Scholar]
- 32. Beigel JH, Tomashek KM, Dodd LE, et al. Remdesivir for the treatment of COVID‐19 ‐ final report. N Engl J Med. 2020;383(19):1813‐1826. [DOI] [PMC free article] [PubMed] [Google Scholar]
Associated Data
This section collects any data citations, data availability statements, or supplementary materials included in this article.
Supplementary Materials
Supplementary Material
Supplementary Material