

Abstract
A recent trend in PET instrumentation is the use of silicon photomultipliers (SiPMs) for high-resolution and time-of-flight (TOF) detection. Due to its small size, a PET system can use a large number of SiPMs and hence effective and scalable multiplexing readout methods become important. Unfortunately, multiplexing readout generally degrades the fast timing properties necessary for TOF, especially at high channel reduction. Previously, we developed a stripline (SL) based readout method for PET that uses a time-based multiplexing mechanism. This method maintains fast timing by design and has been successfully used for TOF PET detectors. In this paper, we present a more systematic study in which we examine how two important design parameters of the readout – the number of inputs on an SL (nSL) and the pathlength between adjacent input positions (Δℓ) – affect its detection performance properties for PET. Our result shows that, up to nSL = 32 the readout can achieve accurate pixel discrimination and causes little degradation in the energy resolution. The TOF resolution is compromised mildly and a coincidence resolving time on the order of 300 ps FWHM can be achieved for LYSO- and SiPM-based detectors. We also discuss strategies in using the readout to further reduce the number of electronic channels that a PET system would otherwise need.
Index Terms—: multiplexing readout, stripline, TOF PET
I. Introduction
The majority of PET detectors are based on using inorganic scintillators to convert a gamma-ray photon into many light photons followed by detection of the light, which is still rather weak, by using high-gain photodetectors (PDs). Traditionally, a photomultiplier tube (PMT) has been the PD of choice for PET because it provides the needed high gain (~106) and fast response characteristics suitable for time-of-fight (TOF) detection. Recently, PMTs are being replaced by silicon photomultipliers (SiPMs) [1]. SiPMs have a PMT-like gain, supports TOF, and are insensitive to magnetic fields [2], [3], [4], [5]. Physically, as solid-state devices they are compact and sturdy. These favorable properties have been exploited for developing high-resolution detectors [6], [7], [8], [9], TOF detectors [10], [11], [12], [13], depth-of-interaction (DOI) detectors [14], [15], [16], [17], miniature add-ons [18], [19], [20], endoscopic and endorectal systems [21], [22], and hybrid PET and MRI systems [23], [24], [25], [26], [27], [28], [29].
Due to its compactness, a PET system can use thousands of SiPMs. Hence, it is crucial to have an effective and scalable multiplexing method in which multiple SiPMs are read by using fewer electronic channels. A popular choice is the traditional resistive network, but for better timing characteristics capacitive and hybrid networks have been proposed (see [30], [31], [32], [33], [34], [35], [36] and references therein). Other methods include variations on a row-and-column readout [37], [38], [36], signal driven multiplexing [36], propagation delay based techniques [38], [39], [40], and the use of encoding signals [41], [42].
Generally, channel reduction is achieved at the expense of detection performance, particularly the timing performance due to increased capacitance, dark counts and noise [34]. One may address this issue by using, for example, operational amplifiers to electronically isolate the SiPMs. This approach however scales poorly as the detector’s complexity, power consumption and heat production all increase. Recently, a scalable solution that passes multiplexed SiPM outputs to a passive analog high-pass filter followed by pre-amplification has been successfully demonstrated [35], [42], [41], [43].
We have reported an alternative scalable and TOF-capable multiplexing readout that was based on the use of striplines (SLs)[40]. We prototyped SiPM-based TOF PET detectors using this readout, with an SL receiving up to 16 SiPMs [44]. We also employed the SL-based detectors to successfully develop a small detector ring that could be placed inside a 9.4 T MRI scanner or a 25 mT electron paramagnetic resonance (EPR) imager for preclinical hybrid PET/MRI or PET/EPR imaging [45], [28]. So far, the SL has been designed empirically. The purpose of this work is to perform a more systematic study into how the SL’s design parameters affect its performance properties so that we can extend the readout to develop larger TOF PET systems.
It is noted that, the readout challenge also can be addressed by the development of position-sensitive monolithic SiPMs [46], [47], [48], [49], [50]. The remainder of this paper is organized as follows. In Sec. II, we describe the SL test boards and the experimental setup, then analyze the measurement data. In Sec. III, we present the evaluation results including pixel discrimination, energy resolution (ER) and coincidence resolving time (CRT). Conclusions and discussion are given in Sec. IV.
II. Materials and Methods
A. SL Readout: Principle and Parameters
An SL, also called a micro-strip transmission line, receives signals at several input positions along its length and measurements are taken at its two ends. A signal appearing at time t0 at an input position produces at that location two identical replicas that travel in opposite directions to reach the two ends of the SL at time t1 and t2. As in TOF detection, the differential arrival time δt = t1 − t2 encodes the input position. On the other hand, the mean arrival time equals t0 within a constant. Below, the standard deviations of δt and are denoted as σ(δt) and respectively.
In this work, the input positions are regularly spaced. For two adjacent positions, the SL pathlength between them, denoted by Δℓ, gives rise to a difference of Δδt = 2Δℓ/v between their δt values, where v is the speed of propagation of the pulse on the SL. The positioning task is to use δt to identify from which of the input positions a signal pulse has originated. The accuracy of this task depends on Δδt/σ(δt) and the TOF resolution on .
We define the electronics multiplexing ratio as the number of electronic inputs divided by the number of electronic outputs. As an SL has two electronic outputs, , where nSL is the number of SiPMs on an SL. Generally, as nSL and increase, signals can be slowed down and noise can be added, leading to degraded timing accuracy. This applies to both σ(δt) and , and therefore both the positioning accuracy and TOF resolution can be worsened. One may increase Δℓ, and hence Δδt, to improve the positioning accuracy. In practice, Δℓ is limited by the available space on the printed circuit board (PCB). In addition, increasing Δℓ increases the inductance and capacitance [51], [52], which can also eventually deteriorate the positioning accuracy and TOF resolution.
The accuracy in timing is also affected by the quality of the PCB used to implement the readout, the circuit for feeding signals to the SL, the characteristics of the input signals, and the timing resolution of the data acquisition (DAQ) electronics. The latter two are not design parameters of the SL readout. In this work, the input signals are derived from SiPMs coupled to LYSO crystals; an off-the-shelf DRS4 evaluation board manufactured by PSI, Switzerland (https://www.psi.ch/en/drs/evaluation-board) is used to provide good electronic timing resolution. The PCB and feeding circuit are design parameters but they are fixed in this work. The PCB has 6 layers and uses two PCB materials, ROGERS and FR4. The ROGERS 4000 series is used for the SL layer. It has a dialectic permittivity of about 3.5 and a substrate height of 3.6 mils (0.09 mm). The height of the SL copper tracer is 1.65 mil (0.05 mm); the width is about 6 mils (0.15 mm), slightly adjusted at the factory to yield a 50 Ω characteristic impedance. The Δδt/Δℓ value of the resulting SLs is measured to be about 133 ps/cm, yielding v ≈ 1.5 × 10⁸ m/s.
B. Detectors and Stripline Test Boards
Two stripline boards (SLB) were built for reading four units of Hamamatsu S13361-3050NE-04, each of which contained 4×4 SiPMs (3.2 mm pitch, 3×3 mm2 detection active area, 50×50 μm2 microcells) and was coupled to a matching 4×4 array of lutetium yttrium oxyorthosilicate (LYSO) crystals. The crystals, each 3×3×10 mm3 in size, were optically isolated from one another by using enhanced specular reflector (ESR) films. Therefore, the array detector contained a total of 16×4 individually coupled LYSO/SiPM pixels. All SiPMs were biased at 56 V.
Fig. 1(a) shows a photo of the two SLBs and Fig. 1(b) illustrates the layouts of their SLs and how the detector pixels are connected to the SLs. The SL-16 board has four SLs. They all receive 16 inputs derived from one row of the 16×4 array detector but provide different Δℓ values, including 12.5 mm, 18.7 mm, 25.0 mm, and 37.5 mm. The SL-32 board has two SLs, each of which receives the outputs of one row of the array detector and then loops back to receive the outputs of another row, yielding 32 inputs total. The Δℓ values provided are 25.0 mm and 37.5 mm. Between adjacent detector pixels the SL takes a smooth zigzag path so that Δℓ can be much larger than the pitch of the detector pixels.
Fig. 1.
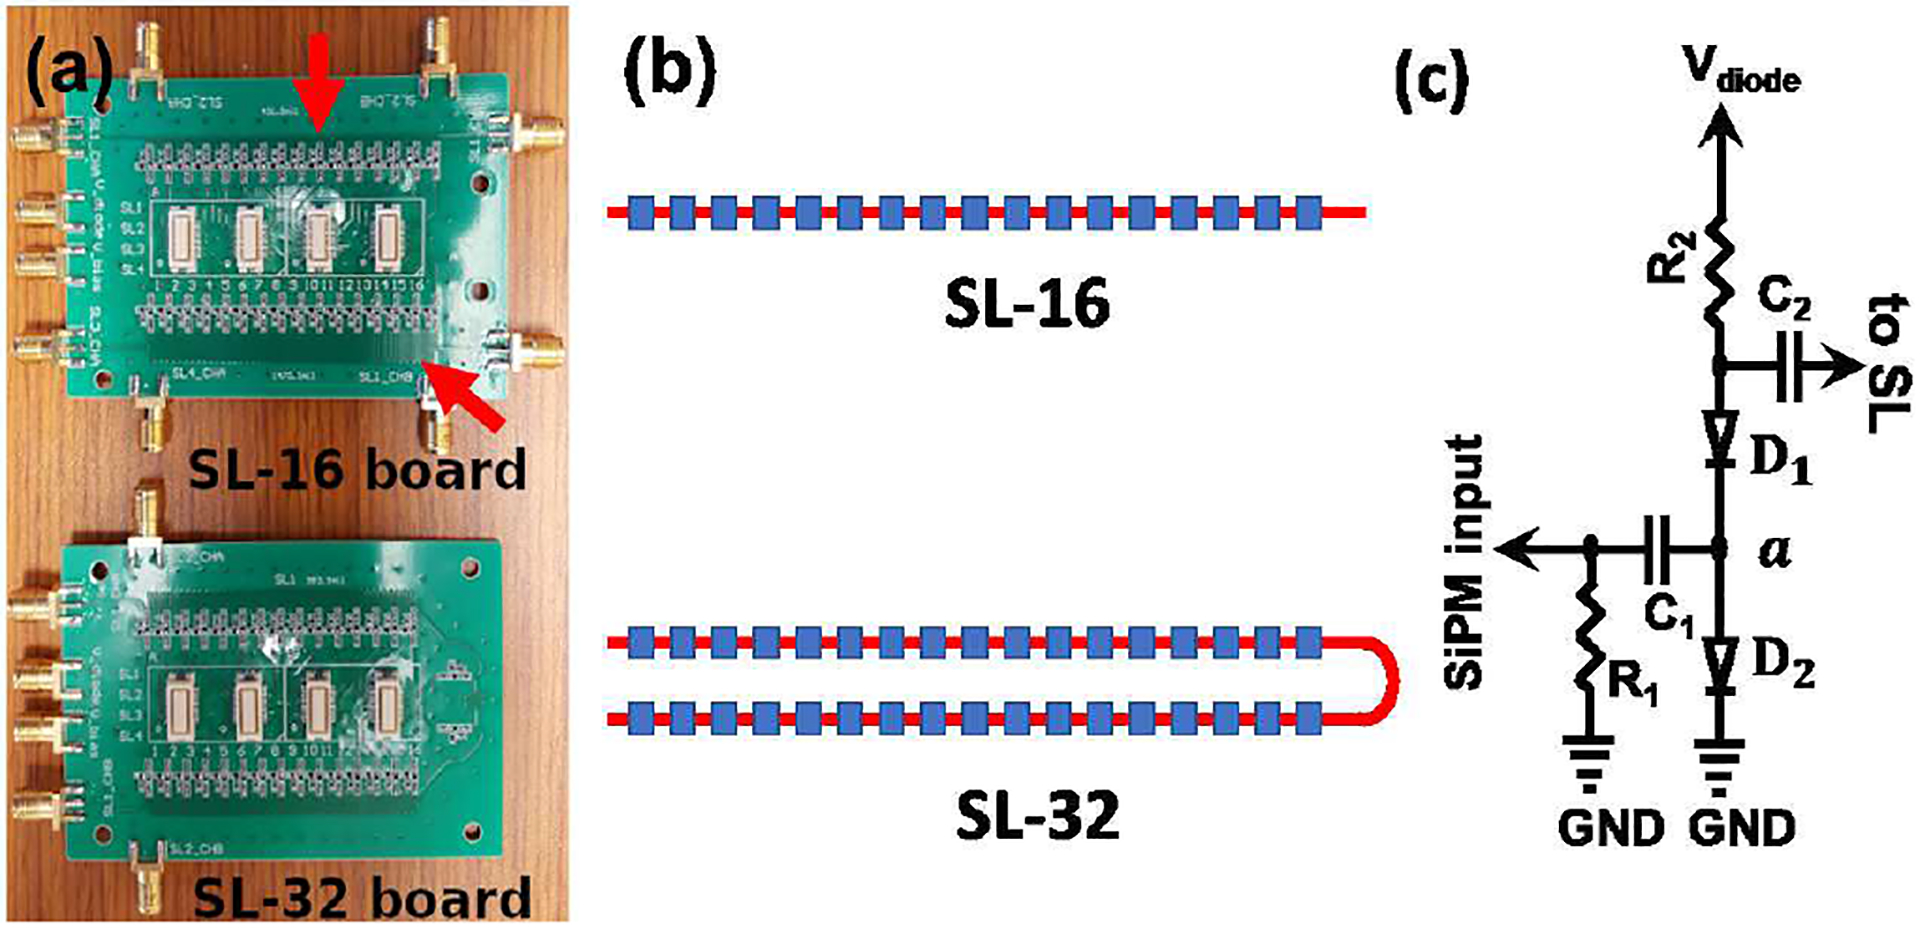
Two SLBs providing nSL = 16 and 32 and various Δℓ values for reading a 16×4 array detector. In (a), each socket receives one 4×4 SiPM unit; the arrow at the top points to the passive circuit shown in (c) that feeds an SiPM output to the SL; the arrow at bottom points to a smooth zigzag pattern taken by the SL to yield different Δℓ values. See text for detail.
Fig. 1(c) shows the passive circuit for feeding the SiPM output to the SL at each input position. The circuit, adapted from SensL’s signal driven multiplexing method [36], serves to isolate SiPMs sharing an SL as briefly described below. The capacitor C2 is used to provide AC coupling between the SiPM circuitry and SL. The resistor R2 is chosen to bias the two diodes D1 and D2 such that normally they are almost OFF. When the SiPM produces a signal (negative polarity), it pulls down the voltage at a and turns D1 ON and D2 OFF, thereby transferring the signal to the SL. For other inactive SiPMs on the SL, this signal serves to push their D1 diodes further into the OFF state, thereby isolating them from the SL even more. Schottky diodes are used to ensure fast switching between the ON and OFF states. At present, the resistance, capacitance, bias voltage and diode model are empirically chosen by inspecting the output pulse. The circuit does not implement high-pass filtering as recommended in [35], [43].
We also used a previously developed SLB (SL-8 board, not shown) for reading an 8×4 array detector in which an SL received 8 outputs from one row of the detector with Δℓ = 25.0 mm [53]. Two of the 4×4 LYSO and SiPM units described above were used to populate this 8×4 array detector and the same SiPM bias voltage was used.
These boards have no active electronics and their outputs are directly connected to the DRS4 evaluation board without explicit pre-amplification. Thus, the SL readout is electronically simple and highly scalable. Below, we will identify a specific SL on these SLBs by SL-nSL(Δℓ). When there is no ambiguity in identifying the value of Δℓ, or there is no need to identify, we will also simply use SL-nSL.
C. Experimental Measurement
Measurements for assessing the positioning accuracy and ER were made by placing a Ge-68 rod source (about 100 μCi) approximately 7 cm in front of the array detector. The signals appearing at the ends of the SLs were sampled and stored for off-line processing. The DRS4 sampling rate was set to 2.5 GS/s. With a 1024 buffer depth, this gave a 400 ns acquisition time, which was sufficient for the scintillation pulses produced. By using short pulses, we previously showed that this sampling rate could yield 3 ps RMS electronic timing resolution [54].
Coincidence measurement was performed between the 16×4 or 8×4 array detector and a reference detector that consisted of a Hamamatsu 10931–050P (3×3 mm2 detection active area, 50×50 μm2 microcells) and a 3×3×10 mm3 LYSO. The array detector and the single-pixel reference detector were positioned to face each other and the Ge-68 rod source was placed between them so that the back-to-back annihilation photons entered the LYSO crystals along the 10 mm axis. Again, signal waveforms were acquired by using the DRS4 evaluation board at 2.5 GS/s and stored for off-line processing. The reference detector used a direct readout and could be considered to be representing the case nSL = 1.
D. Data Analysis
Fig. 2 is an example showing two pulse waveforms acquired from SL-16(37.5 mm), displayed in the full 400 ns acquisition window and a smaller 50 ns window to zoom in the early parts of the waveforms. Every gamma-ray hit produced such a pair of waveforms, which were analyzed off-line as follows. We found that the two waveforms were highly correlated in shape but could have slightly different amplitudes (see also Fig. 9). Therefore, it could be beneficial to use constant fraction discrimination (CFD) for measuring δt, especially with SL-32s for which the attenuation effect would be more evident. On the other hand, following Xu et al [6] and Derenzo et al [55], leading-edge discrimination (LED) with a low threshold was used to measure . Both CFD and LED were implemented digitally and the continuous waveform between two waveform samples was estimated by linear interpolation. δt and were then calculated from the two pulse-time values obtained by using CFD and LED, respectively. The amplitude of a pulse (pulse height) was estimated by using the peak amplitude of its waveform samples.
Fig. 2.
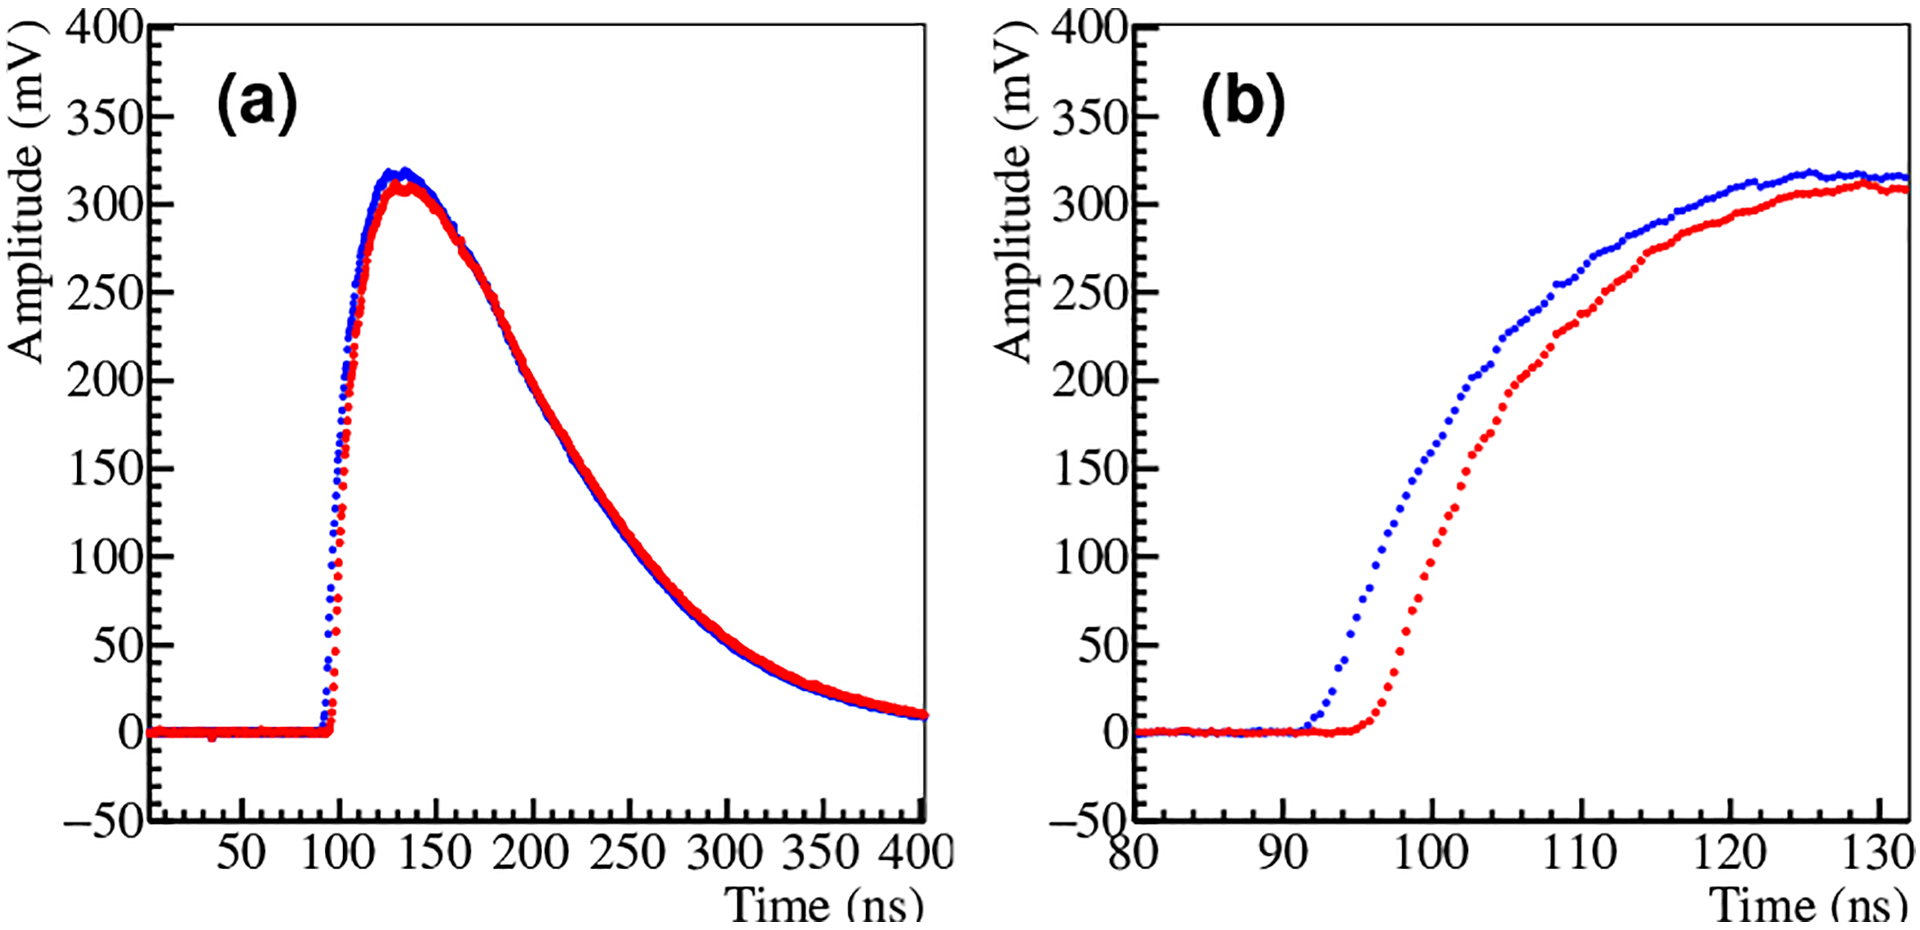
(a) An example of two pulse waveforms seen at the ends of an SL in response to a gamma-ray hit. (b) Zoom-in of the waveforms in a 50 ns window. The two waveforms are highly correlated in shape because they are replicas of the input signal. The amplitudes are slightly different because they travel different SL pathlengths and experience different amounts of attenuation.
Fig. 9.
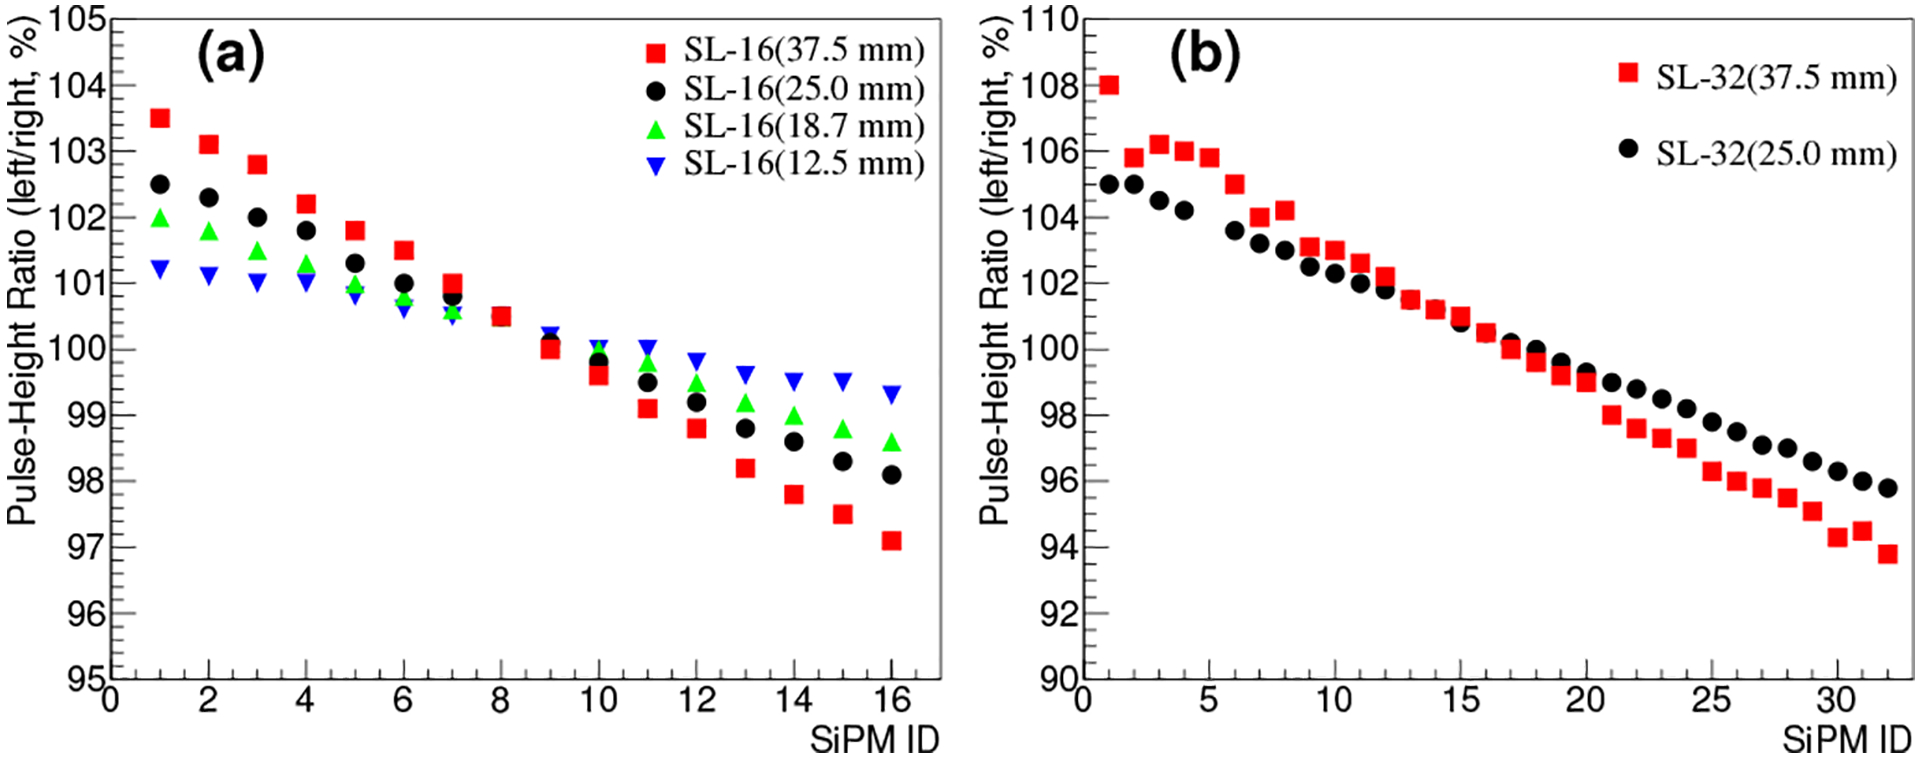
Pulse-height ratio of the SL-16s (a) and SL-32s (b). See text for detail.
The reference detector produced only one waveform for each gamma-ray hit. The event time tr and pulse height were similarly obtained as above by applying LED to and using the peak amplitude of the sampled waveform. Coincidence detection was made by using and tr.
III. Results
A. Pixel Discrimination
Fig. 3 shows a δt histogram obtained for SL-8(25.0 mm), showing 8 distinct peaks. From the histogram, the boundaries , i = 0, ⋯, nSL, for pixel discrimination are derived as follows. Let , i = 1, ⋯, nSL, be the identified locations of the peaks. We define , , and for i = 1, ⋯, nSL − 1. Subsequently, an event with δt is assigned to pixel i if .
Fig. 3.
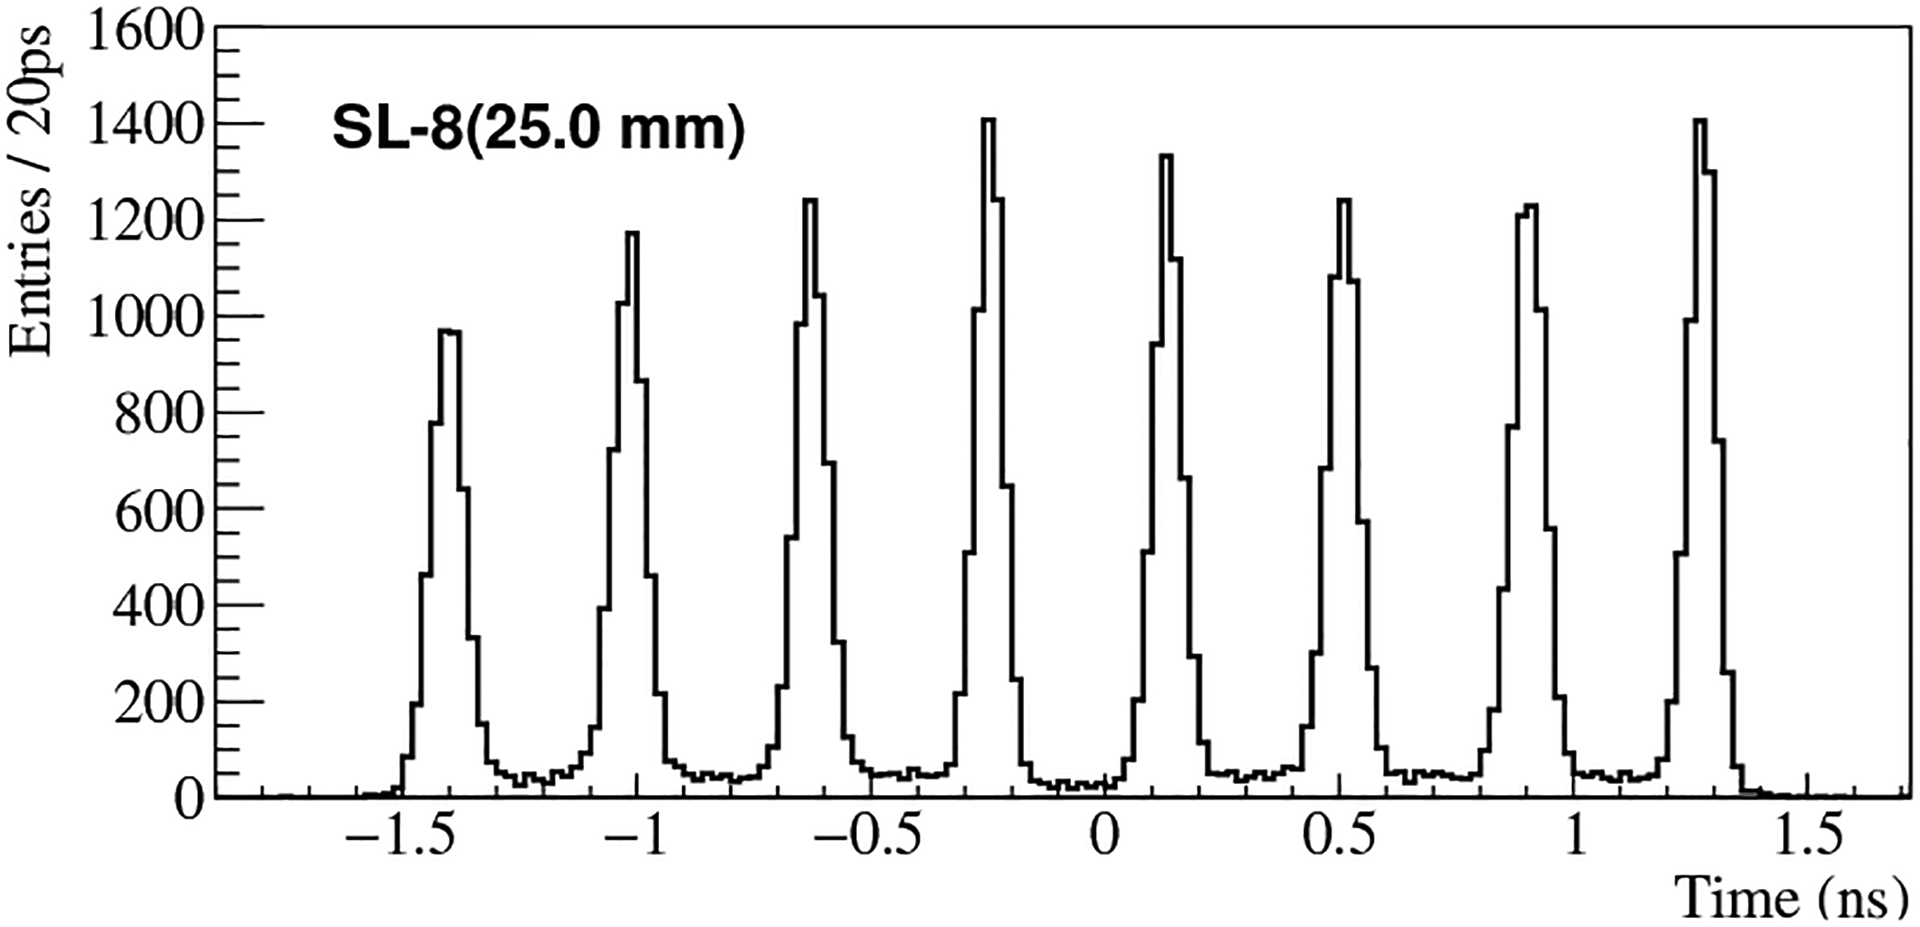
δt-histogram of SL-8(25.0 mm).
With little overlaps, the peaks shown in Fig. 3 evidently can lead to precise pixel discrimination. To assess the degree of separation of the peaks, and hence the accuracy of pixel discrimination, a popular metric used by researchers is the average of the peak-to-valley ratios, denoted by <P/V>. Generally, a larger <P/V> value means that the peaks are better separated with respect to their widths. The resolution in δt is measured by using the average width (in FWHM) of the peaks. For the histogram in Fig. 3, it has a <P/V> value of 39.5, a δt resolution of 80 ps, and a rather uniform peak-to-peak separation. The latter suggests a constant propagation speed of the pulse on the SL.
The δt histograms obtained for the SL-16s are shown in Fig. 4; they all have 16 readily identifiable peaks. The peak-to-peak separation increases with Δℓ and Fig. 5 shows that the change is linear, as expected. On the other hand, the δt resolution ranges from 84 ps to 89 ps and shows little dependence on Δℓ. Therefore, for a given nSL, SLs with larger Δℓ have better peaks separation and more accurate pixel discrimination. The <P/V> values are 9.3, 20.8, 31.8 and 59.9 for Δℓ = 12.5 mm, 18.7 mm, 25.0 mm and 37.5 mm, respectively.
Fig. 4.
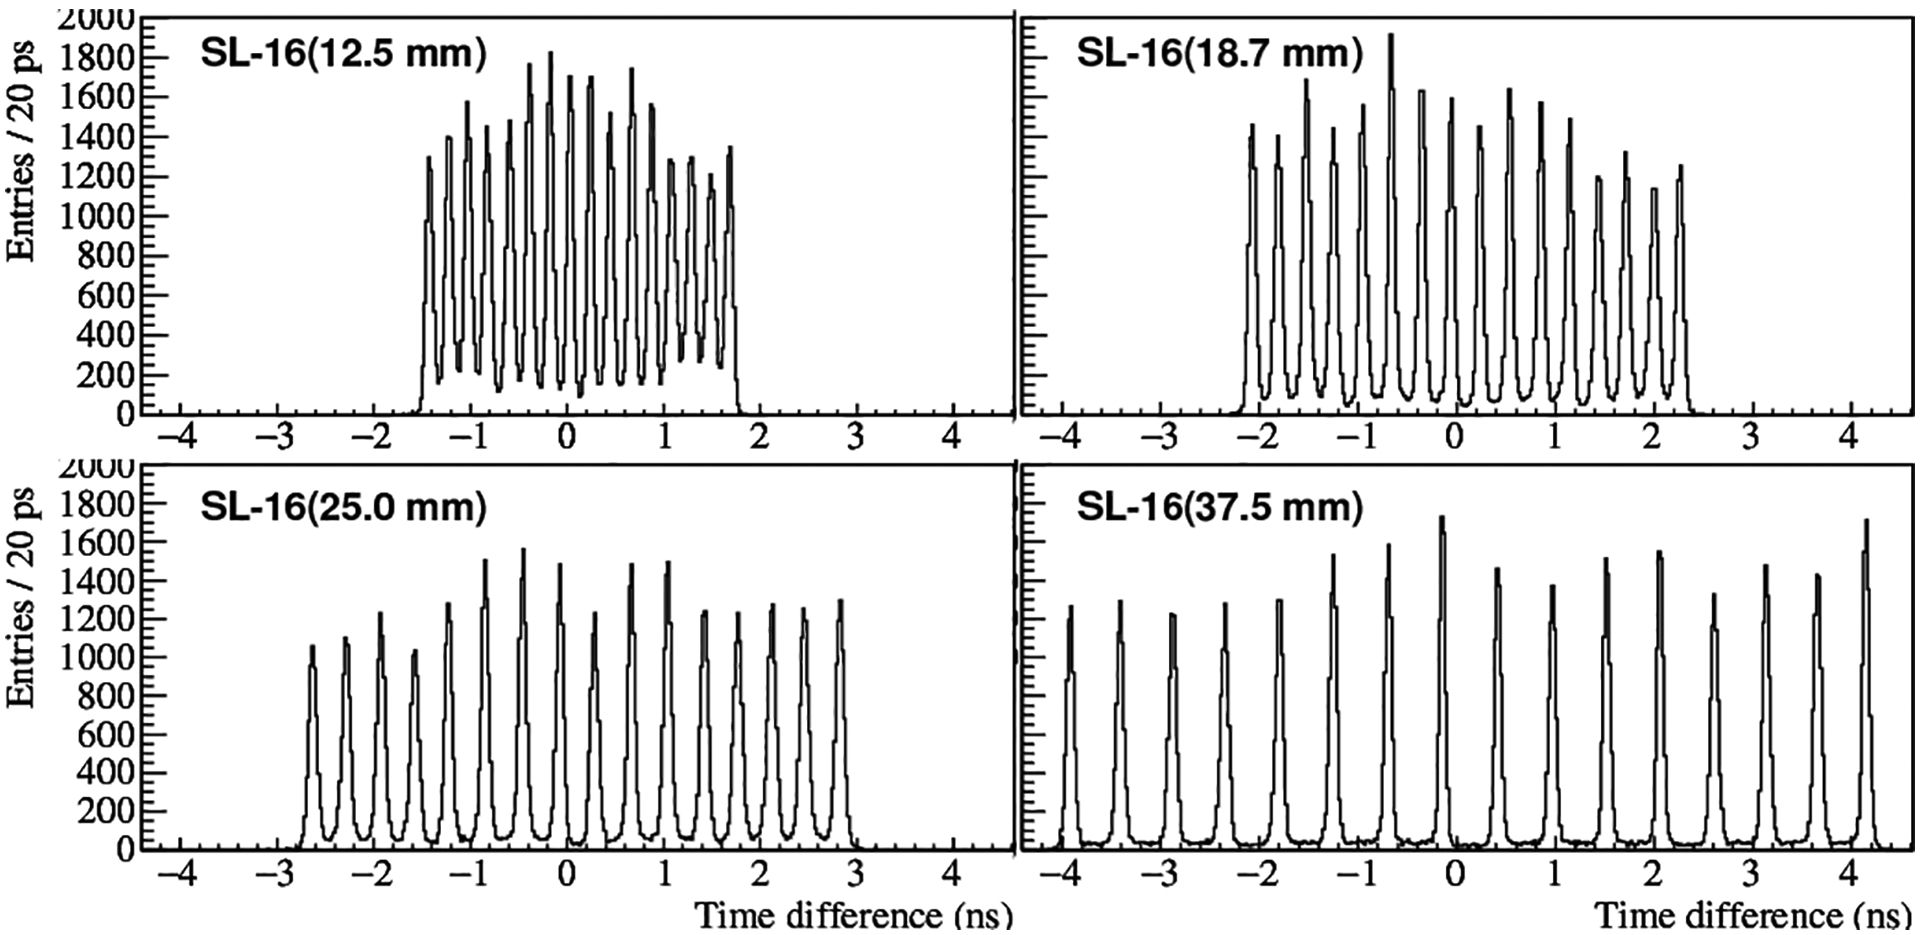
δt-histograms of the four SL-16s.
Fig. 5.
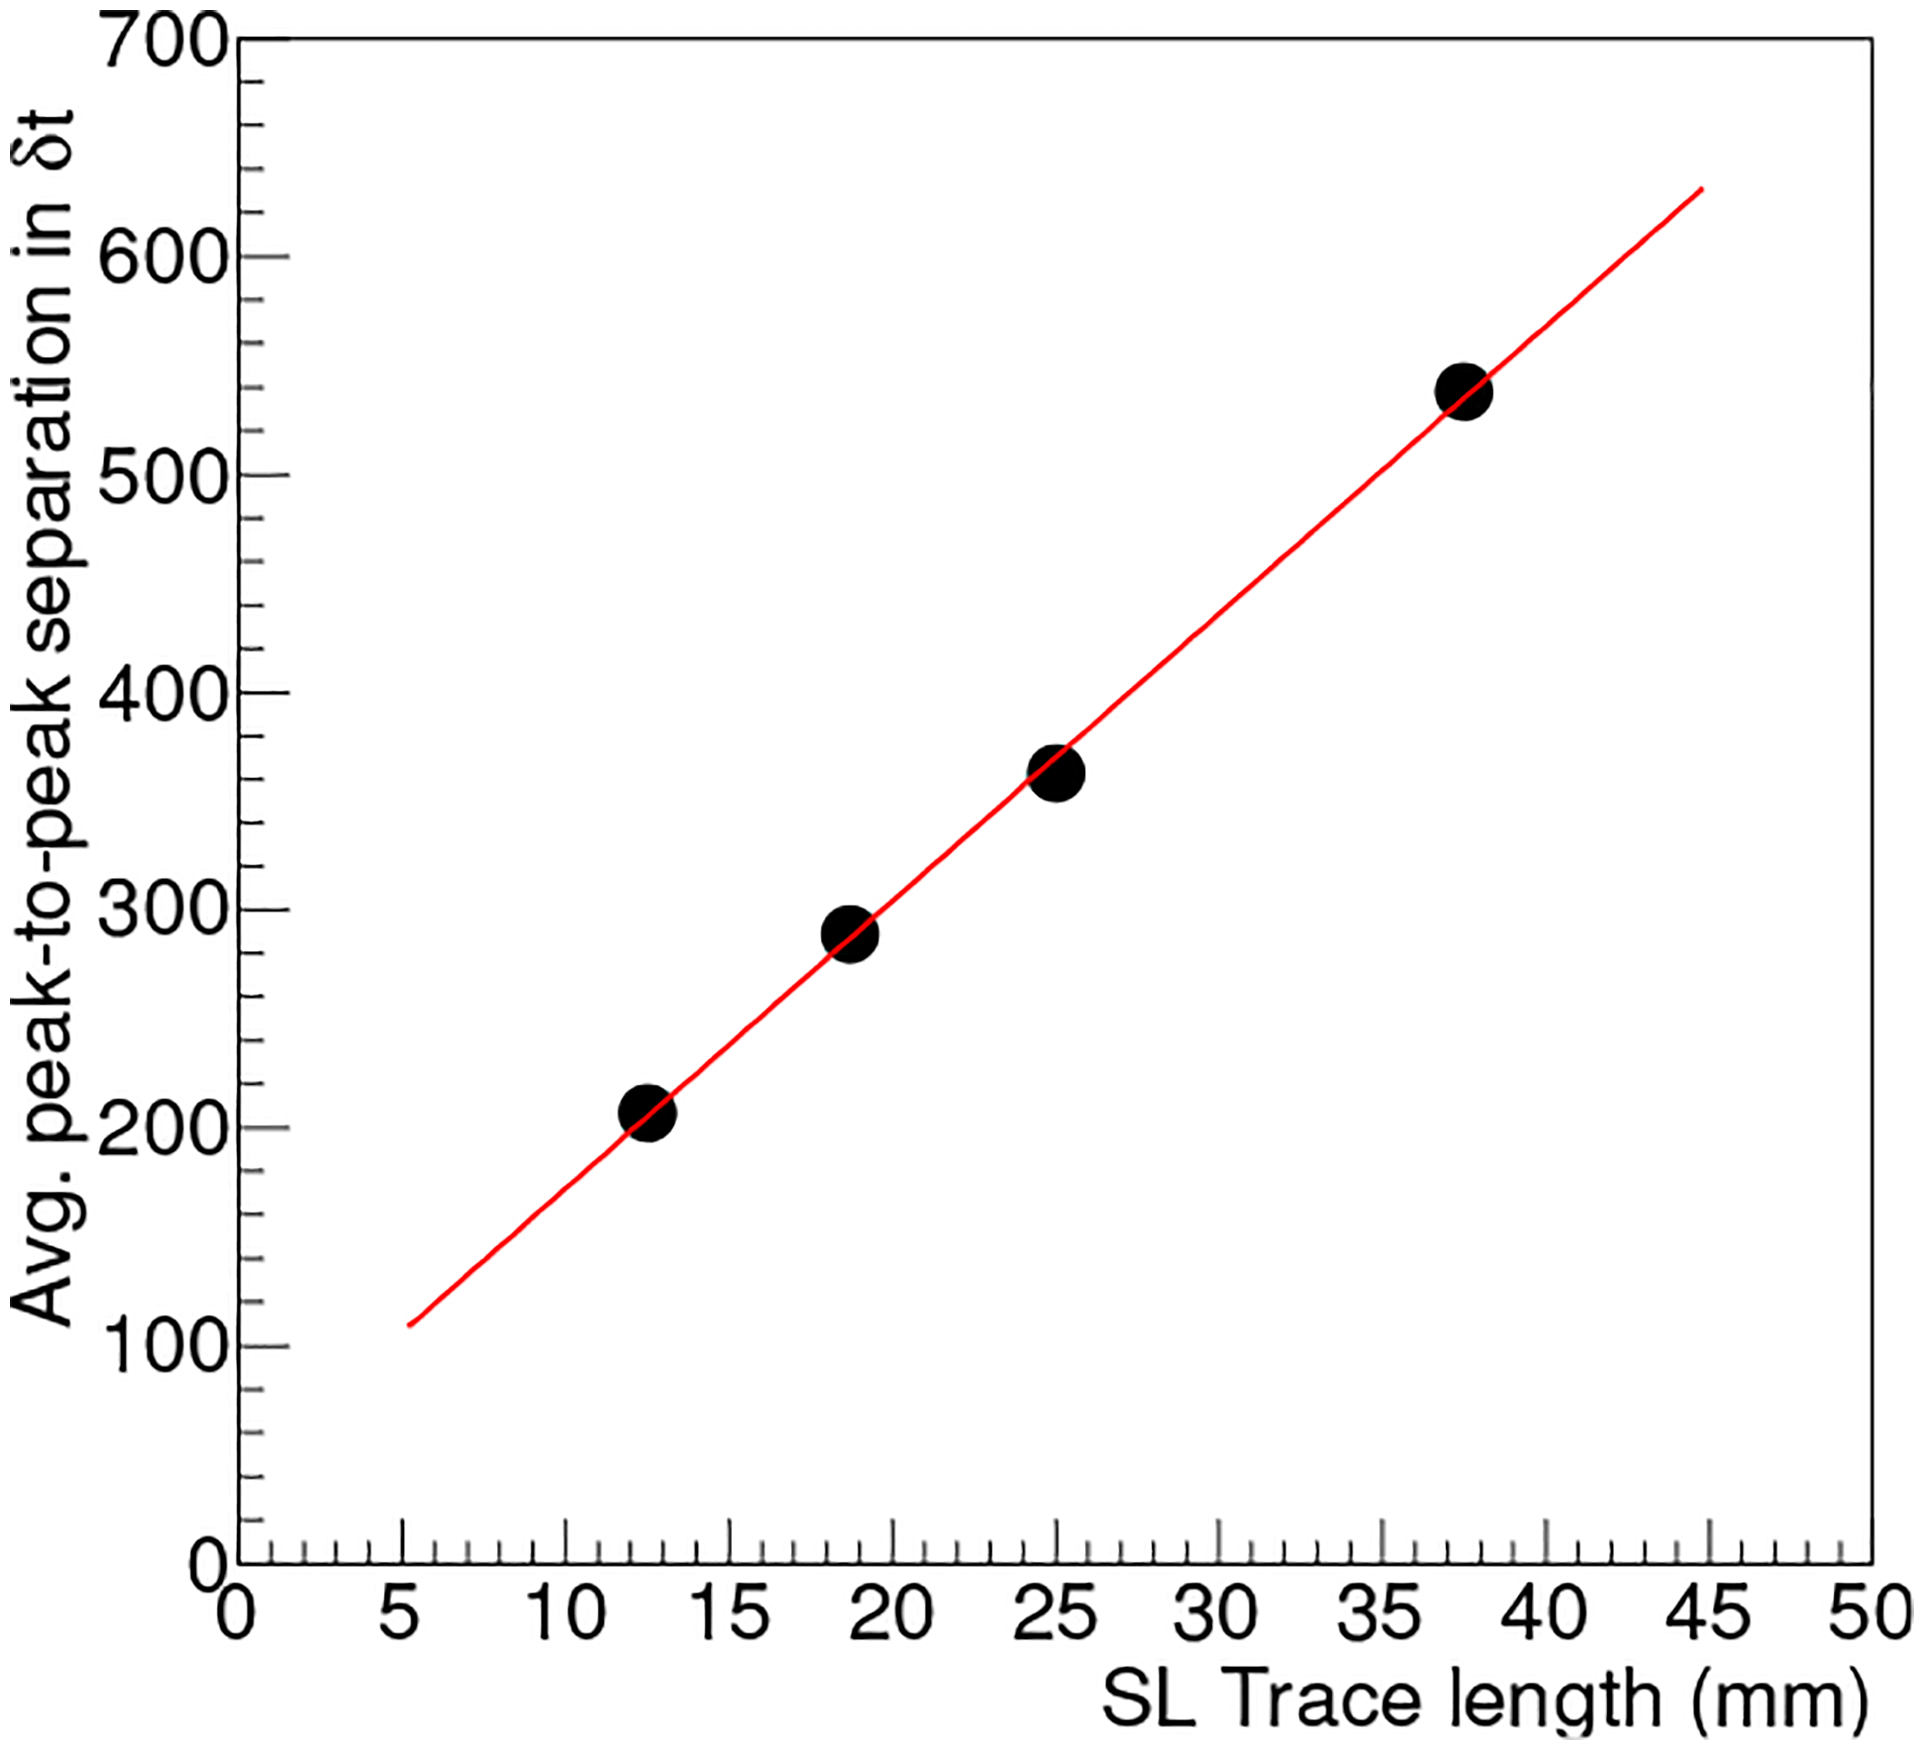
Average peak-to-peak separation versus Δℓ of the SL-16s.
Fig. 6 shows the δt histograms for the SL-32s. We again can observe 32 clear peaks except that SL-32(25.0 mm) apparently has a defective pixel (5th from the left, possibly due to electrical contact). For SL-32(25.0 mm), the <P/V> value and δt resolution are 27.5 and 101 ps, respectively. For SL-32(37.5 mm), they are 12.3 and 146 ps. Compared to SL-8 and the SL-16s, there is noticeable degradation in these metrics, especially in the case of SL-32(37.5 mm). Numerically, the degradation is due to progressive widening and reduction in the amplitude of the peaks as they move toward the ends of the SL. This trend is easy to see in SL-32(37.5 mm), less evident in SL-32(25.0 mm), and hard to detect in SL-8 and the SL-16s. In addition, in the case of the SL32s the valleys are observed to increase. We have yet to identify the causes for these behaviors.
Fig. 6.
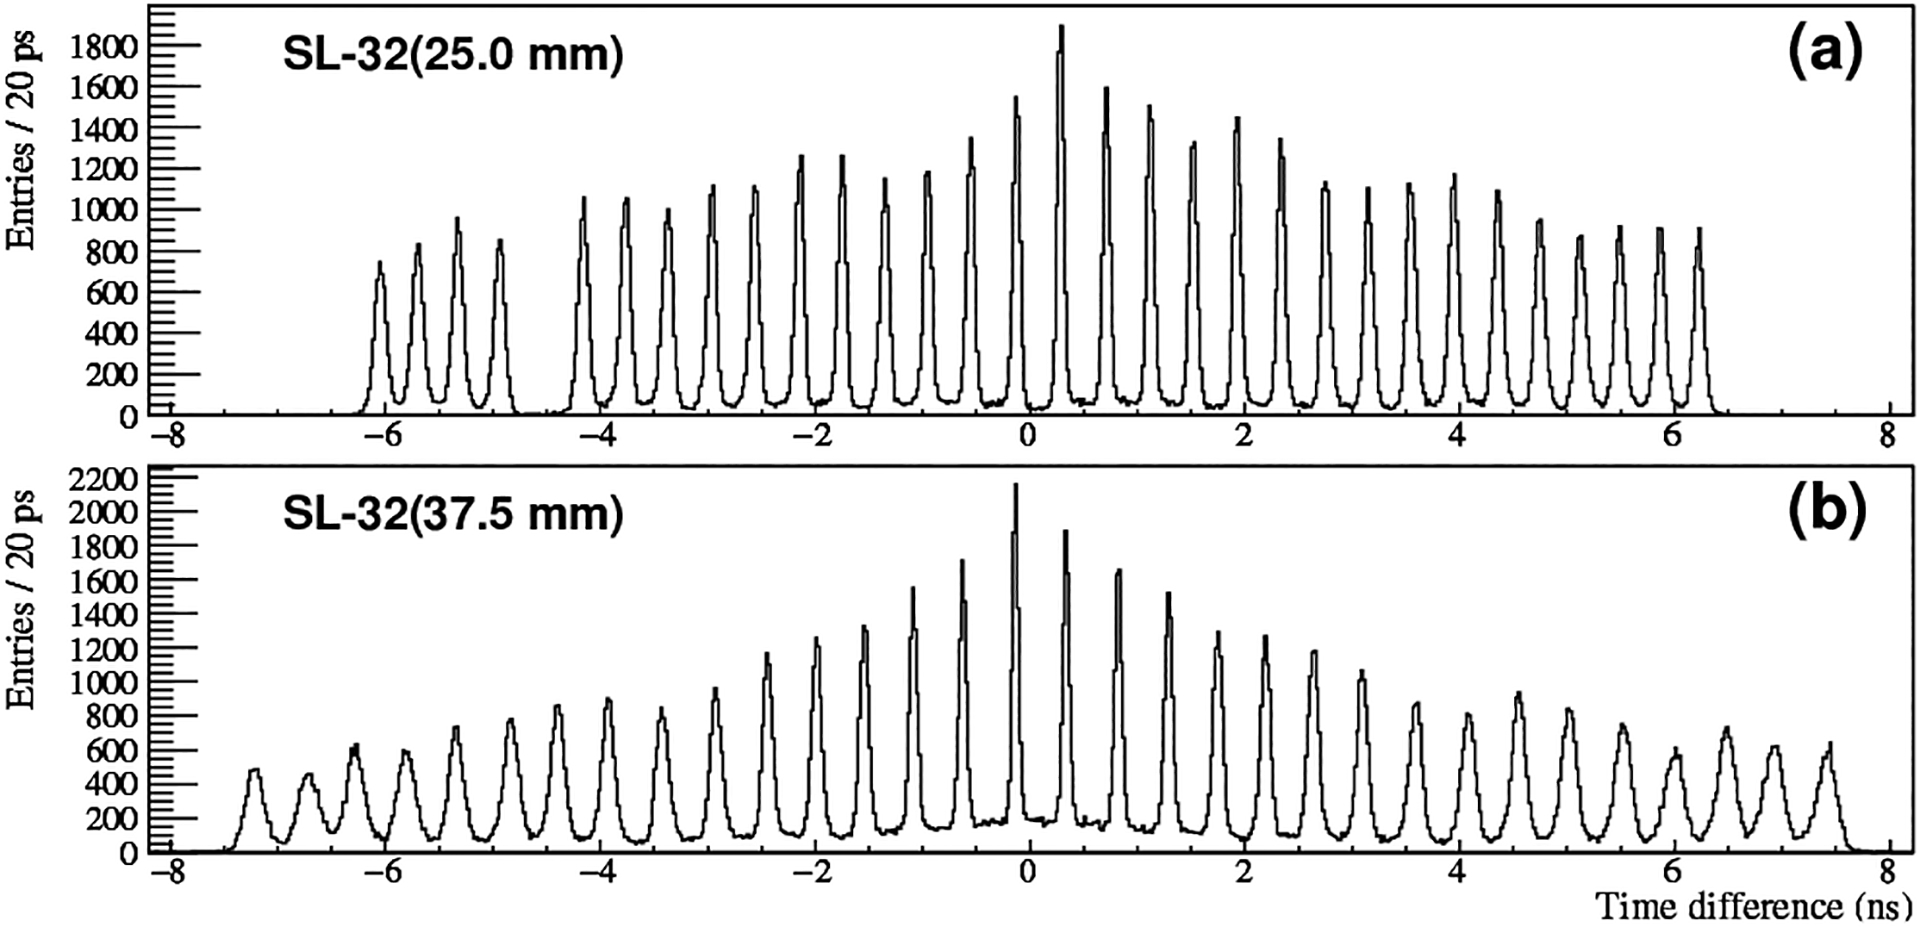
δt-histograms of the two SL-32s.
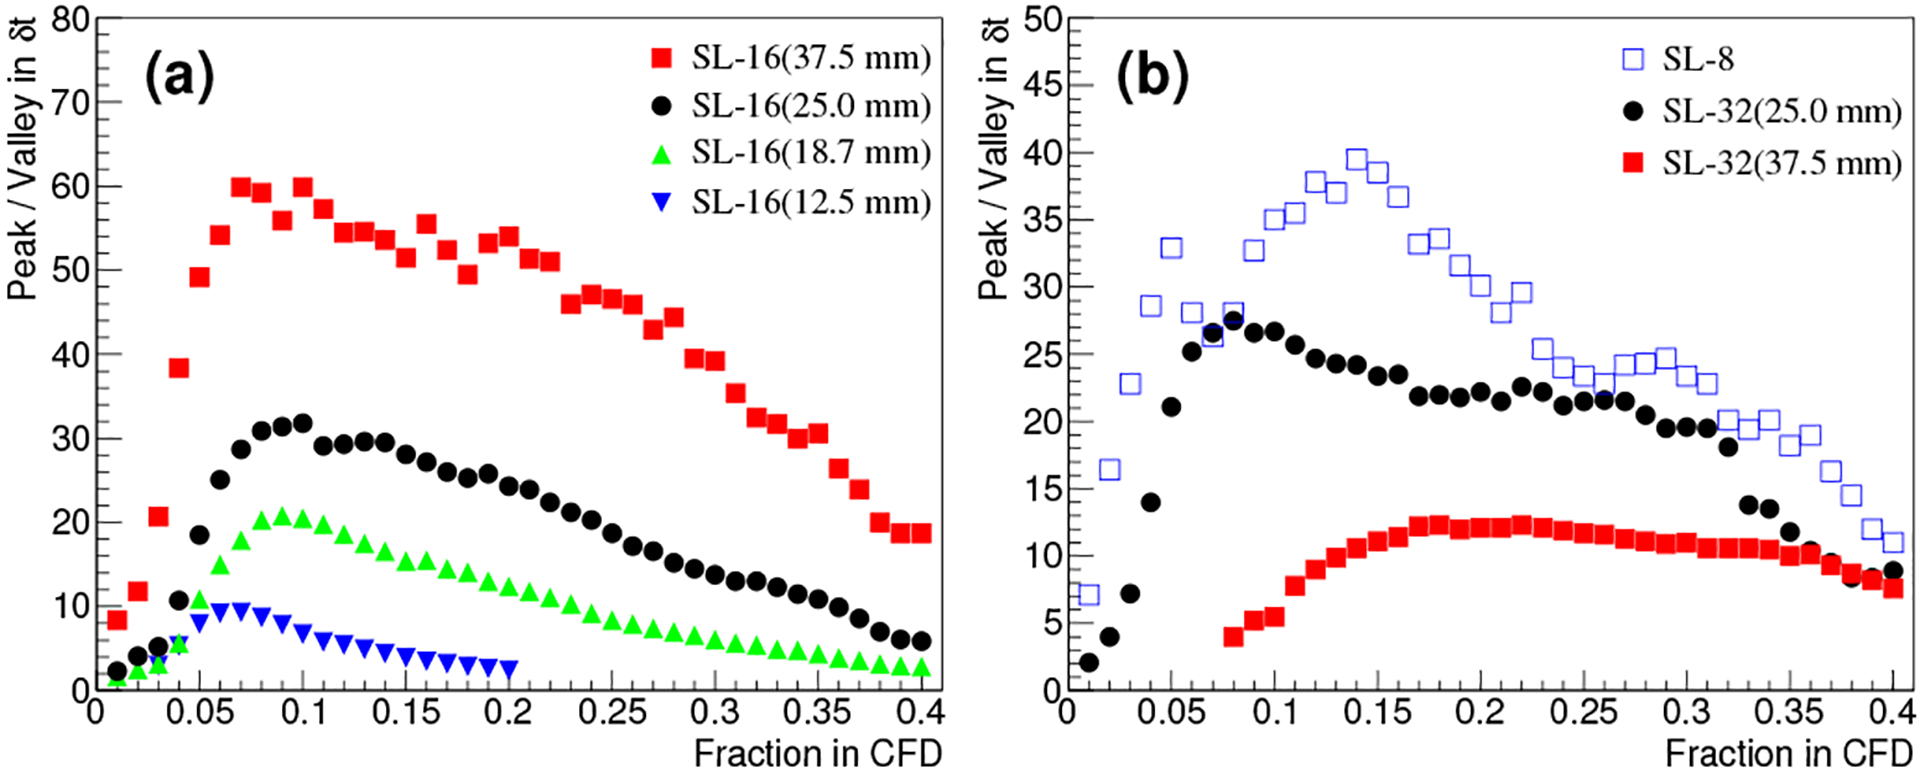
Fig. 7 summarizes the <P/V> value and δt resolution for each SL studied, along with their standard deviations as indicated by the error bars. For <P/V>, we observe an almost linear increase with Δℓ for the SL-16s. The standard deviation also increases with Δℓ. The <P/V> value for the SLs with Δℓ = 25.0 mm is about 30: as nSL increases, the value decreases somewhat, reflecting an increase in σ(δt) as expected. For δt resolution, we obtain a rather constant value for the SL-16s and a comparable value for the SLs with Δℓ = 25.0 mm. It is interesting that, contrary to the situation with <P/V>, the standard deviation now decreases with Δℓ for the SL-16s. For all SLs except SL-32(37.5 mm), the δt resolution is better than ~100 ps. The SL-32(37.5 mm) case shows considerably worse <P/V> and δt resolution with respect to SL-16(37.5 mm) and SL-32(25.0 mm).
Fig. 7.
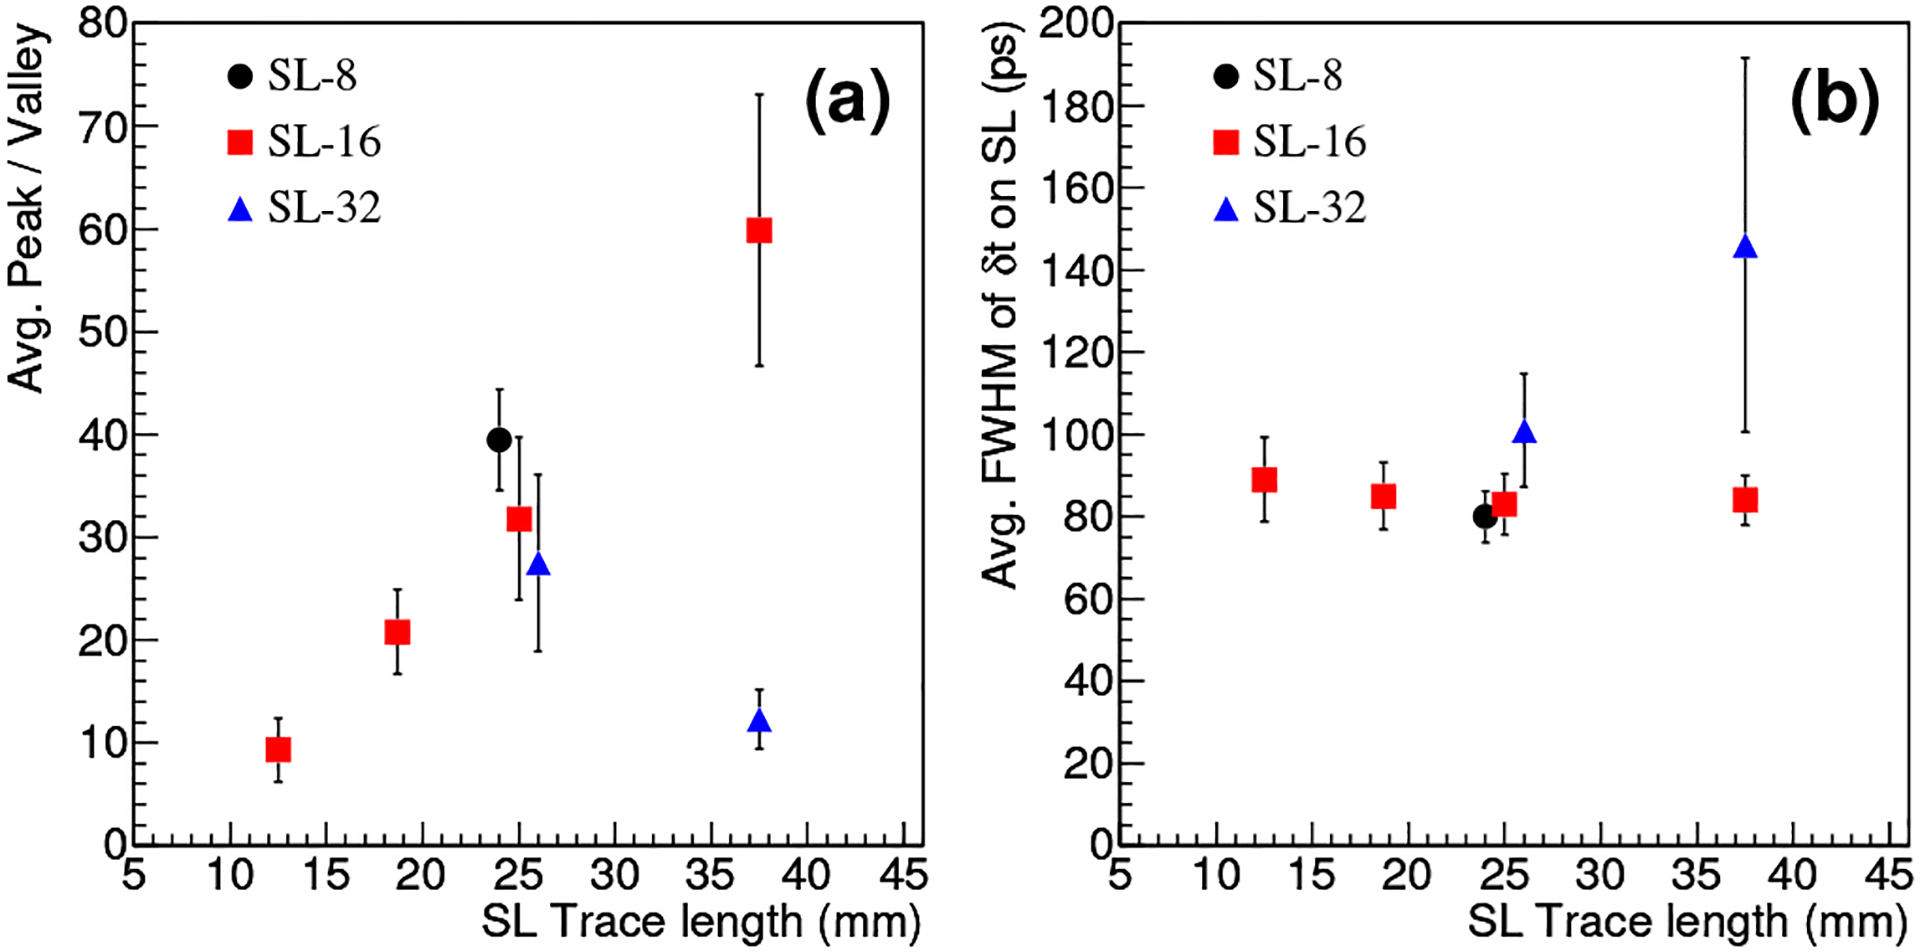
<P/V> (a) and δt resolution (b) versus Δℓ.
The results reported above were obtained by using the optimal CFD thresholds individually determined for the SLs by using Fig. 8 that shows the <P/V> value as the CFD threshold varies. The optimal threshold is the one that maximizes <P/V>.
Fig. 8.
<P/V> as a function of CFD threshold.
We also repeated the measurements by applying LED, employing the optimal thresholds that were identified by a plot similar to Fig. 8. The resulting δt histograms are similar to those reported above. Quantitatively, LED and CFD yield similar <P/V> and δt resolution for SL-8 and the SL-16s. With LED, the <P/V> value and δt resolution are, respectively, 25.9 and 105 ps for SL-32(25.0 mm), and 10.4 and 143 ps for SL-32(37.5 mm); these <P/V> values are noticeably inferior to their counterparts obtained with CFD.
B. Pulse Height and Energy Resolution (ER)
As observed in Fig. 2, due to signal attenuation the two pulses obtained from an SL in response to a gamma-ray hit can have different pulse heights. Fig. 9(a) plots the ratio of the pulse heights for individual detector pixels on the SL-16s. They all show a consistent decrease as the pixel moves from one end of the SL to another. The decrease is at an almost constant rate that is greater for larger Δℓ, consistent with the expectation that a longer SL pathlength causes a larger attenuation. The drop however is not substantial: only about 6% between pixel 1 and pixel 16 in the worse case. Fig. 9(b) similarly shows the ratio obtained for the SL-32s. For SL-32(37.5 mm), some fluctuations near the ends are observed. This and the degradation observed above in its <P/V> and δt resolution suggest that this SL may have some implementation defects.
To minimize the above attenuation effect, the average of the two pulse heights obtained for each gamma-ray hit was used to estimate the event pulse height. Fig. 10(a) shows an event pulse-height spectrum (PHS) obtained for a detector pixel on SL-16(25.0 mm). We computed the ER as the ratio of the width of the photopeak in FWHM to the center of the photopeak. We obtained an ER of 8.3% for the PHS shown in Fig. 10(a). Figs. 11(a) and 11(b) show the ERs thus obtained for individual pixels when using the SL-16s and SL-32s, respectively. A rather uniform ER in the range of 7% to 10% was obtained. Fig. 11(c) compares the average ER obtained for individual SL, showing a consistent value of about 8.4%. There is no noticeable degradation in the case of SL-32(37.5 mm).
Fig. 10.
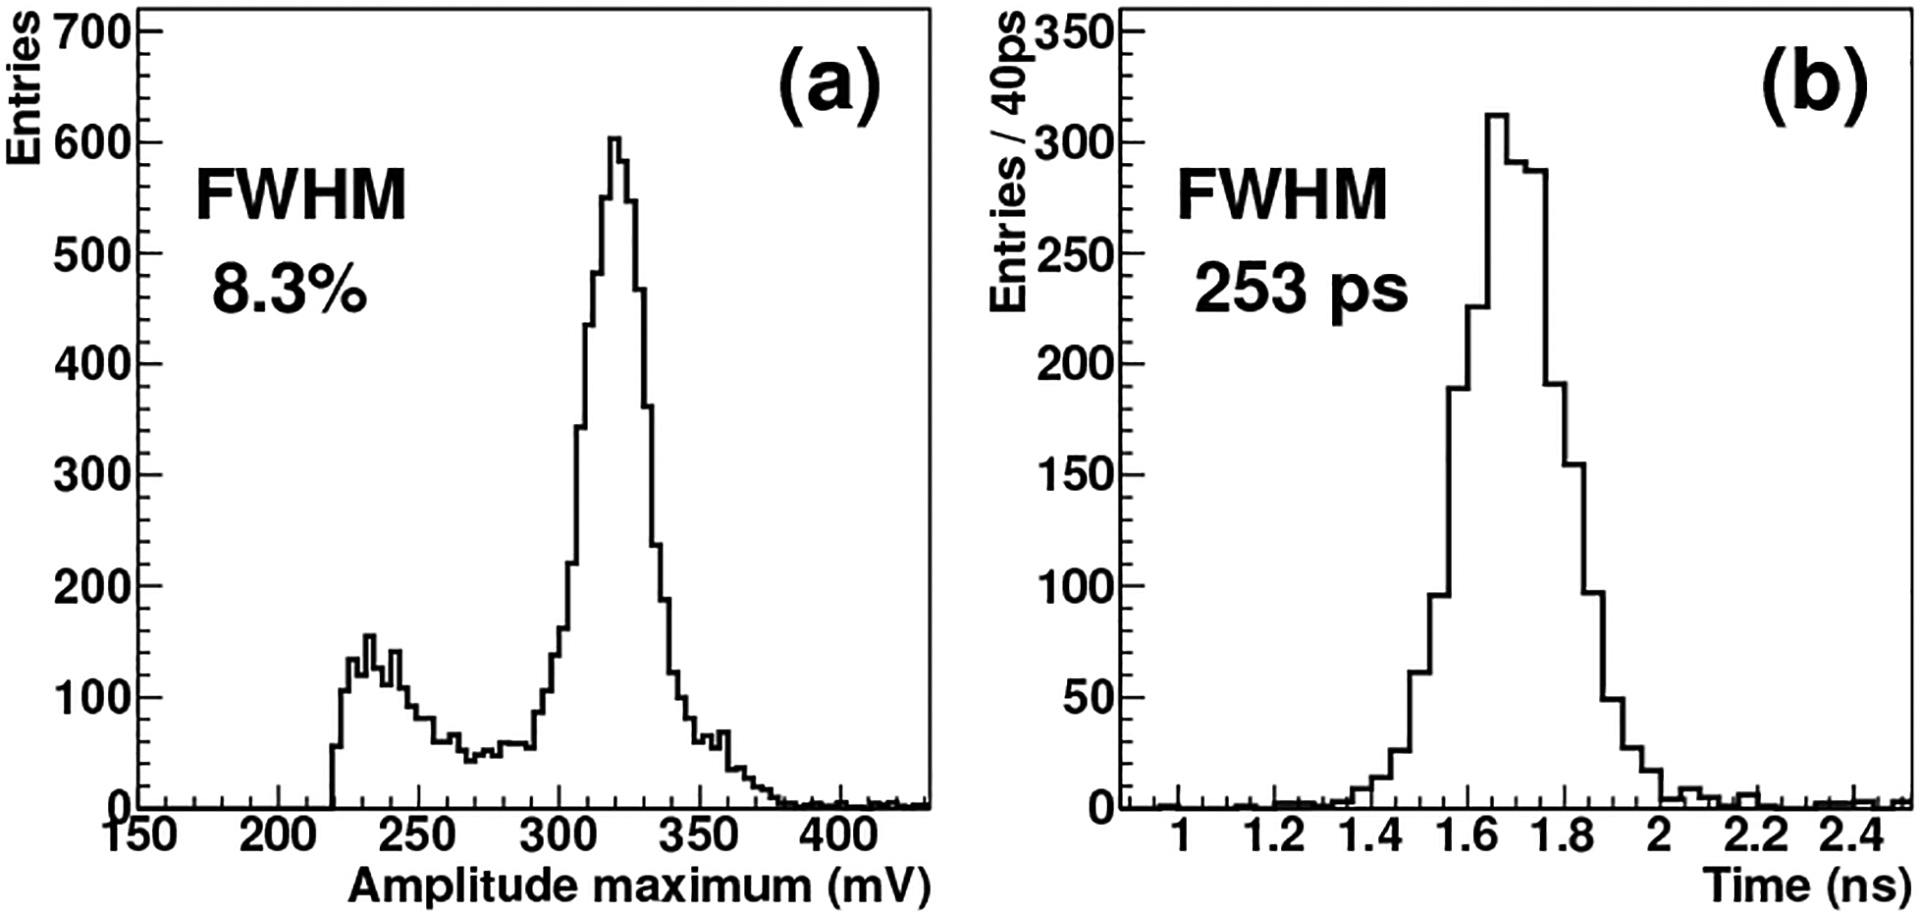
Pulse-height spectrum (a) and coincidence time histogram (b) of a detector pixel on SL-16(25.0 mm).
Fig. 11.
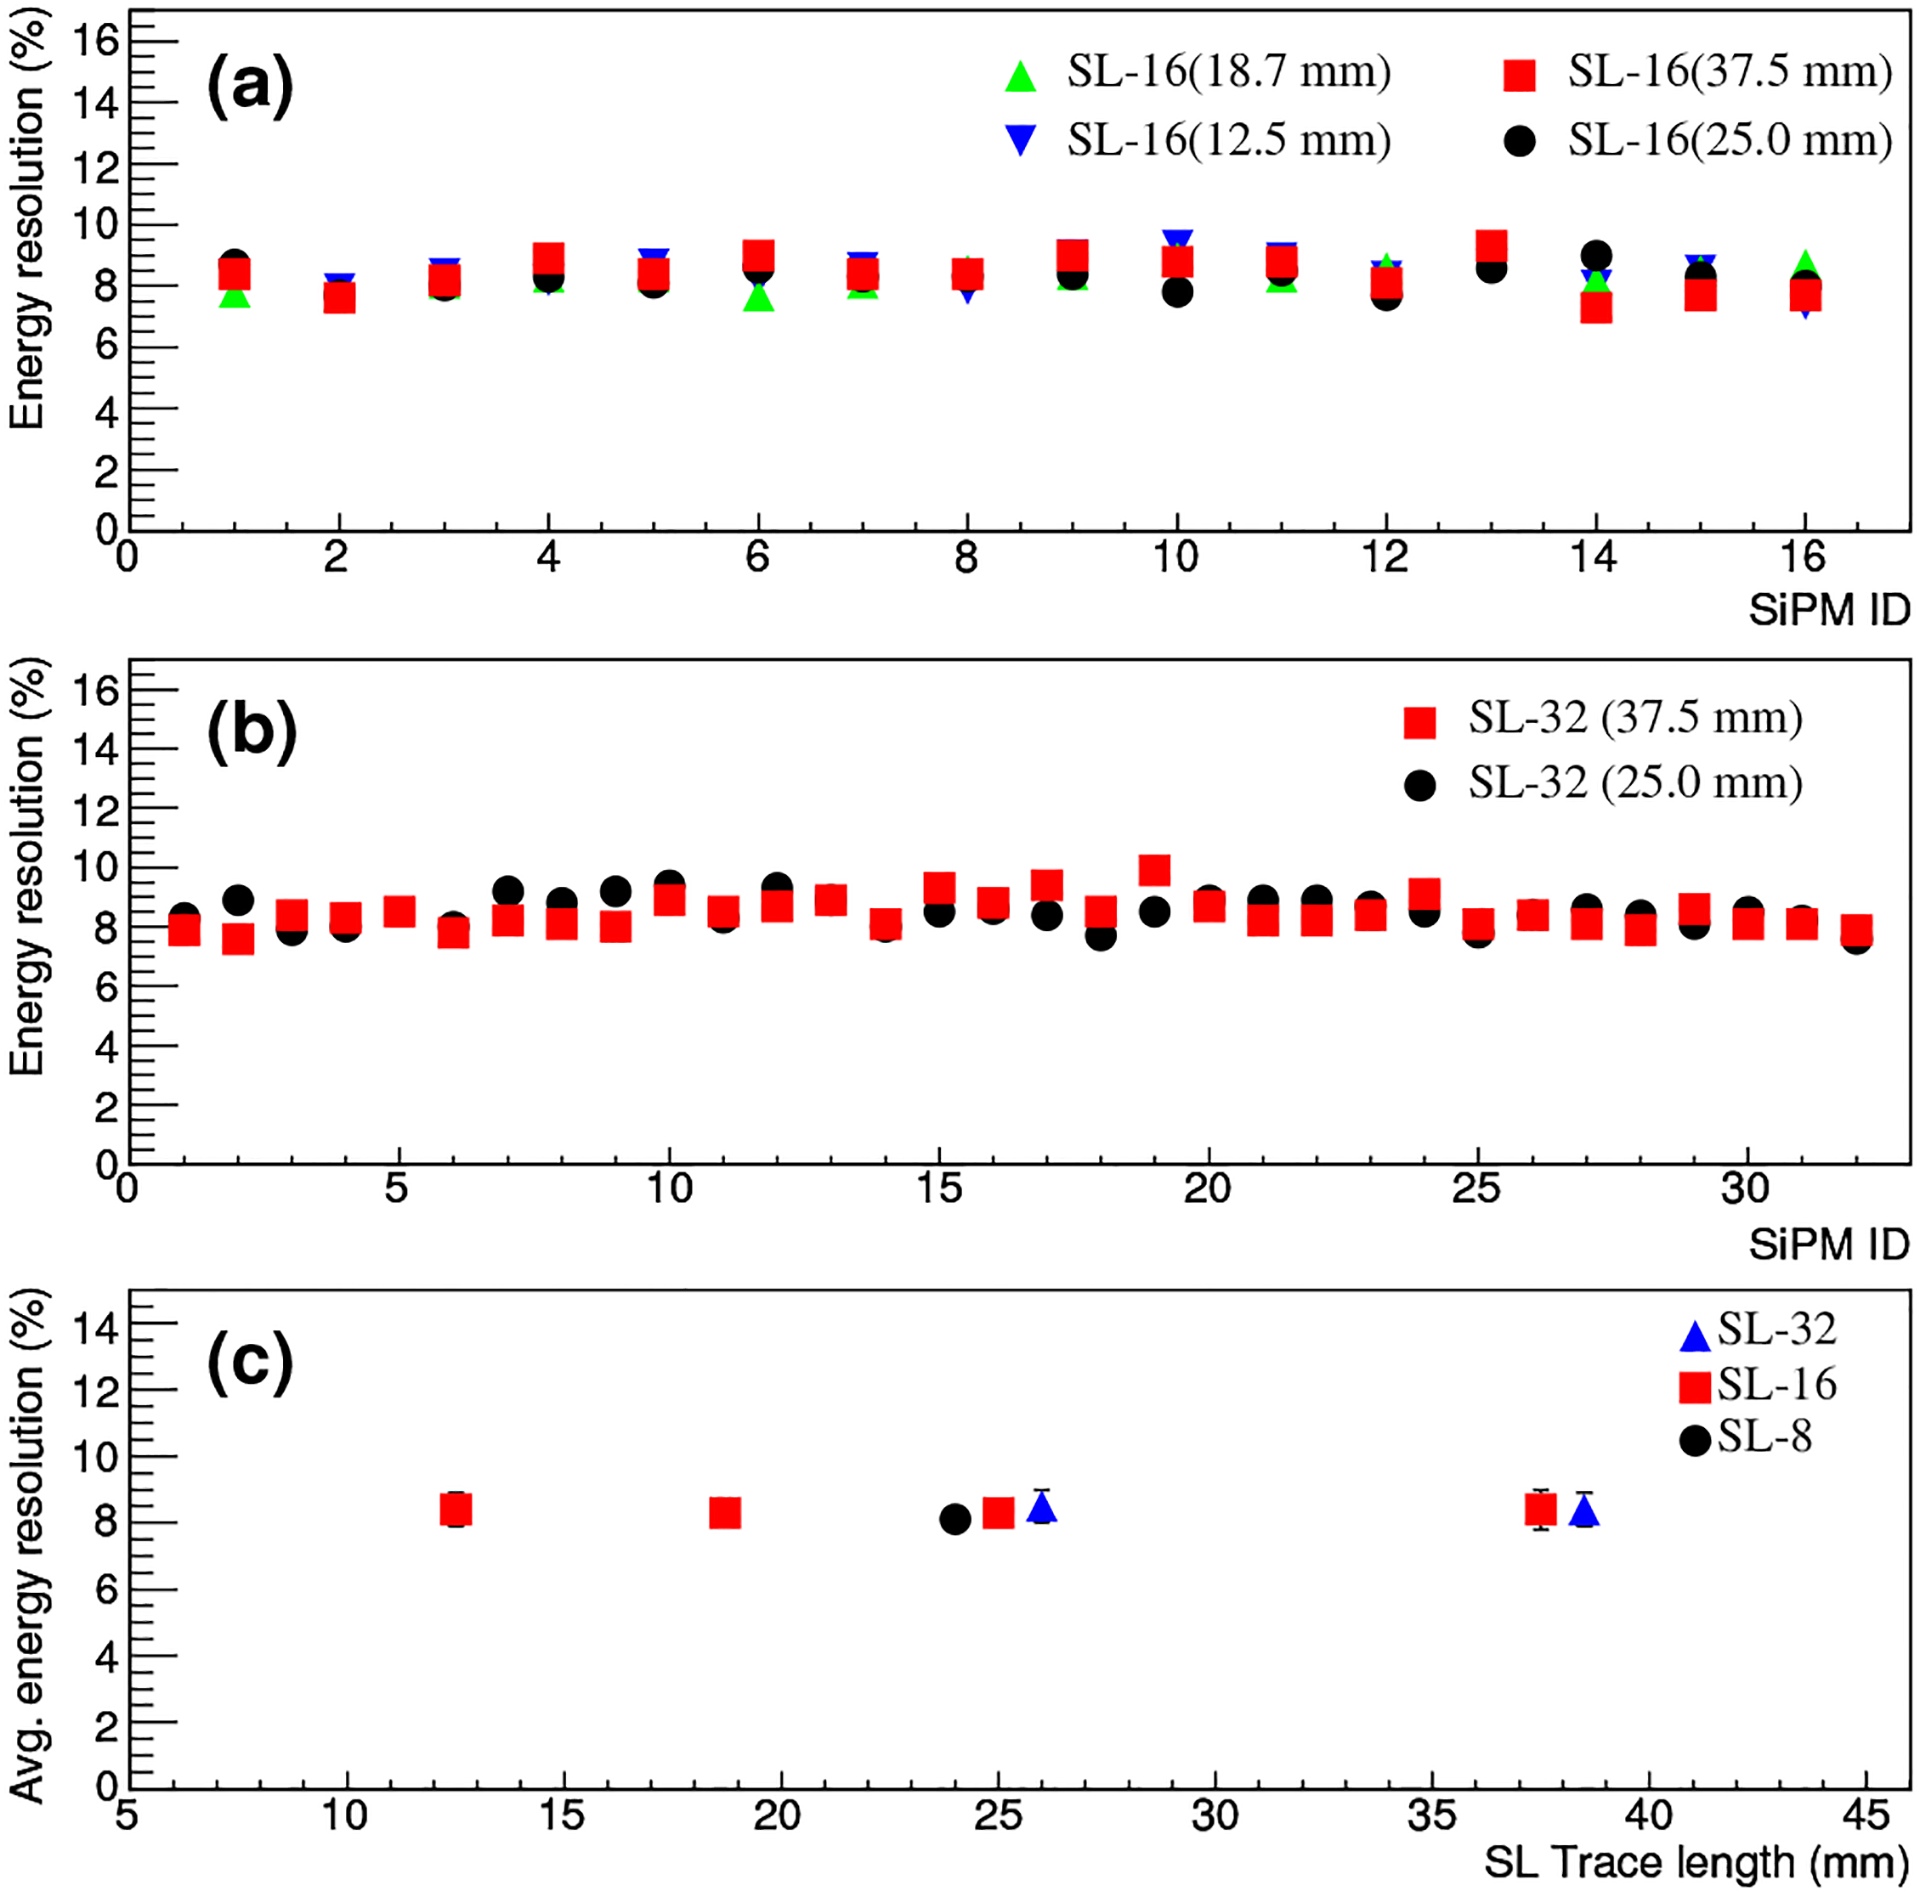
(a&b) ERs of individual pixels when using the SL-16s and SL-32s. (c) Average ERs versus Δℓ of the SLs.
For the reference detector, we measured an ER of about 8.1%. Therefore, the multiplexing SL readout does not noticeably affect the ER for nSL up to 32.
C. Coincidence Resolving Time (CRT)
For an SL, we obtained a coincidence time histogram between every pixels of an array detector and the reference detector, selecting only the photopeak events within [420 keV, 600 keV]. The CRT was then given by the FWHM of the histogram. Fig. 10(b) shows an example of the histogram and the CRT derived. Figs. 12(a) and 12(b) show the resulting CRTs for individual pixels read by the SL16s and SL32s when using a threshold of ~3 mV for LED. This threshold was used because by using a plot similar to Fig. 8 it was determined to yield the best CRT for most SLs. For the SL-16s, we observe a rather uniform CRT in the range of 230–300 ps. The CRT obtained for SL-32(25.0 mm) is only slightly worse. But there is noticeable degradation in the case of SL-32(37.5 mm), showing CRT in the range of 300–500 ps.
Fig. 12.
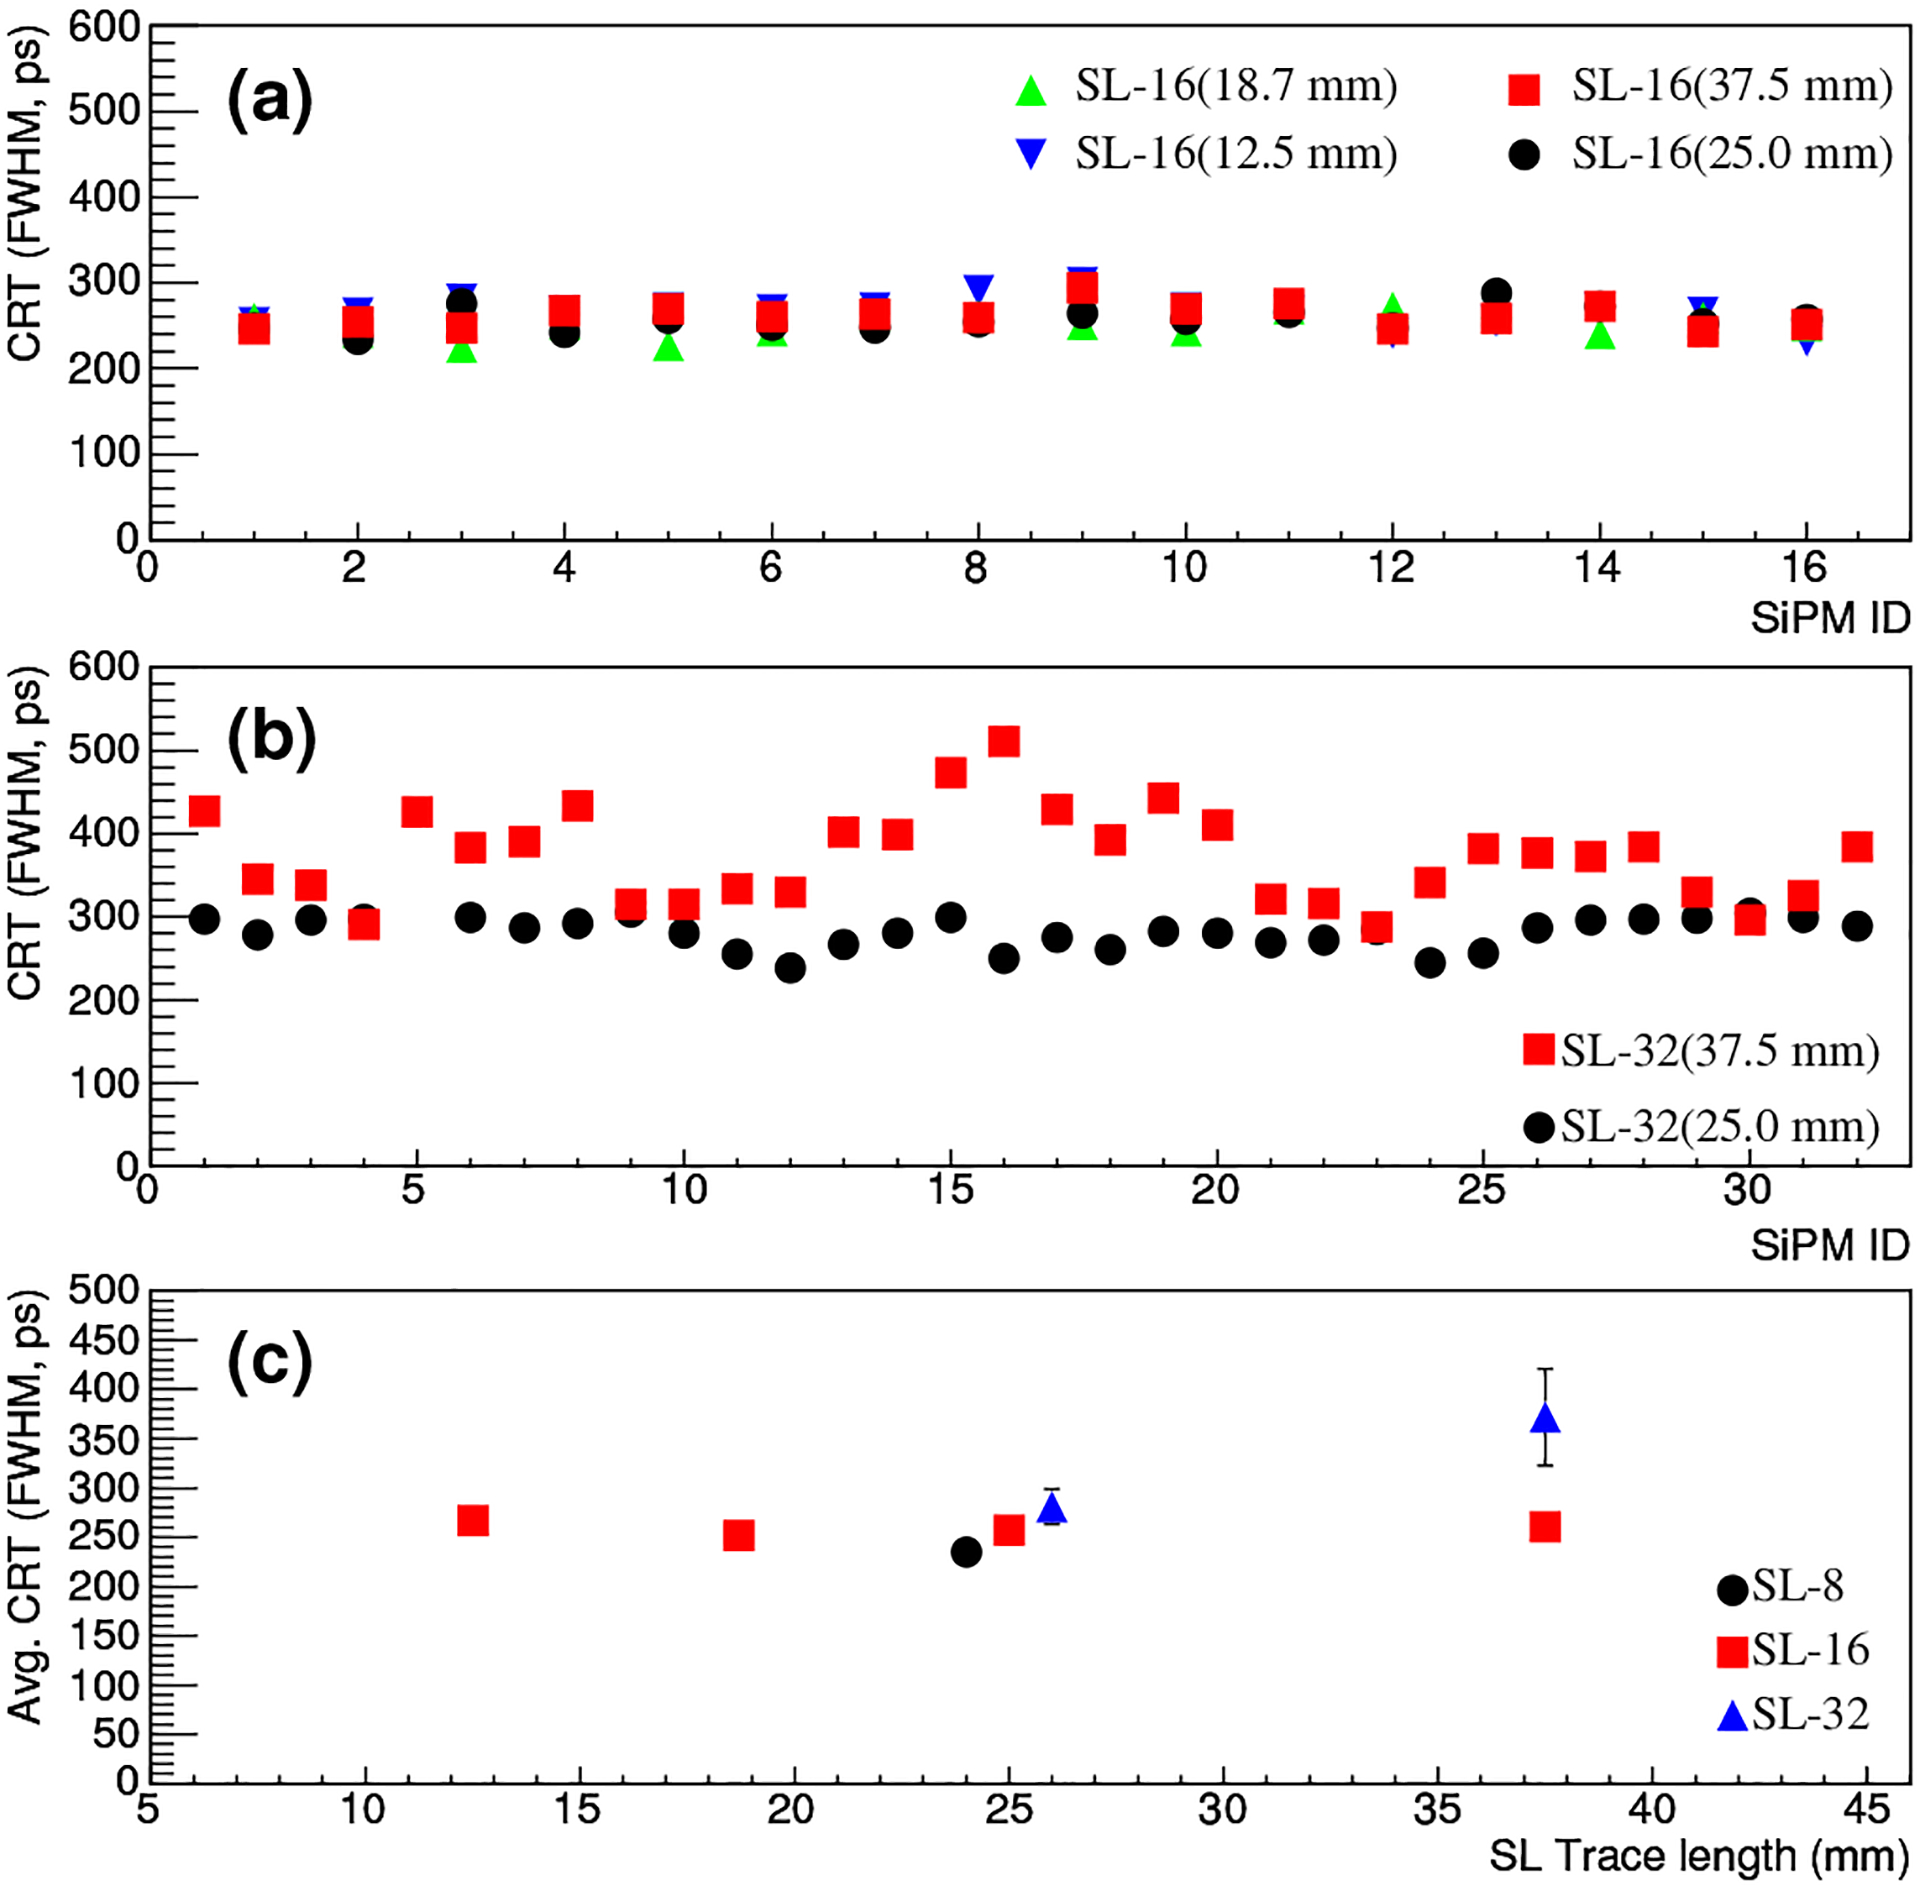
(a&b) CRTs of individual pixels when the array detector is in coincidence with the reference detector, using the SL-16s and SL-32s for readout. (c) Average CRTs versus Δℓ of the SLs.
For each SL, Fig. 12(c) shows the average of the CRTs of individual pixels. Excluding the SL-32(37.5 mm) case, the average CRT is 235 ps for SL-8(25.0 mm), 252–267 ps for the SL-16s, and 281 ps for SL-32(25.0 mm). The values for the SL-16s do not strongly depend on Δℓ. The three cases with Δℓ = 25.0 mm show some degradation as nSL increases. Previously, we measured a CRT of 243 ps for two reference detectors in coincidence [56]. This suggests that the reference detector contributes 172 ps to the above CRT values. If the contributions add in quadrature, the average CRTs in the case of two identical array detectors are estimated to be 227 ps for SL-8(25.0 mm), 260–290 ps for the SL-16s, and 314 ps for SL-32(25.0 mm). Fig. 13 summarizes the estimated average CRT for two array detectors in coincidence, compared to the measured CRT for two reference detectors in coincidence. The degradation in CRT from nSL = 1 (the reference detector case) to nSL = 32 is mild.
Fig. 13.
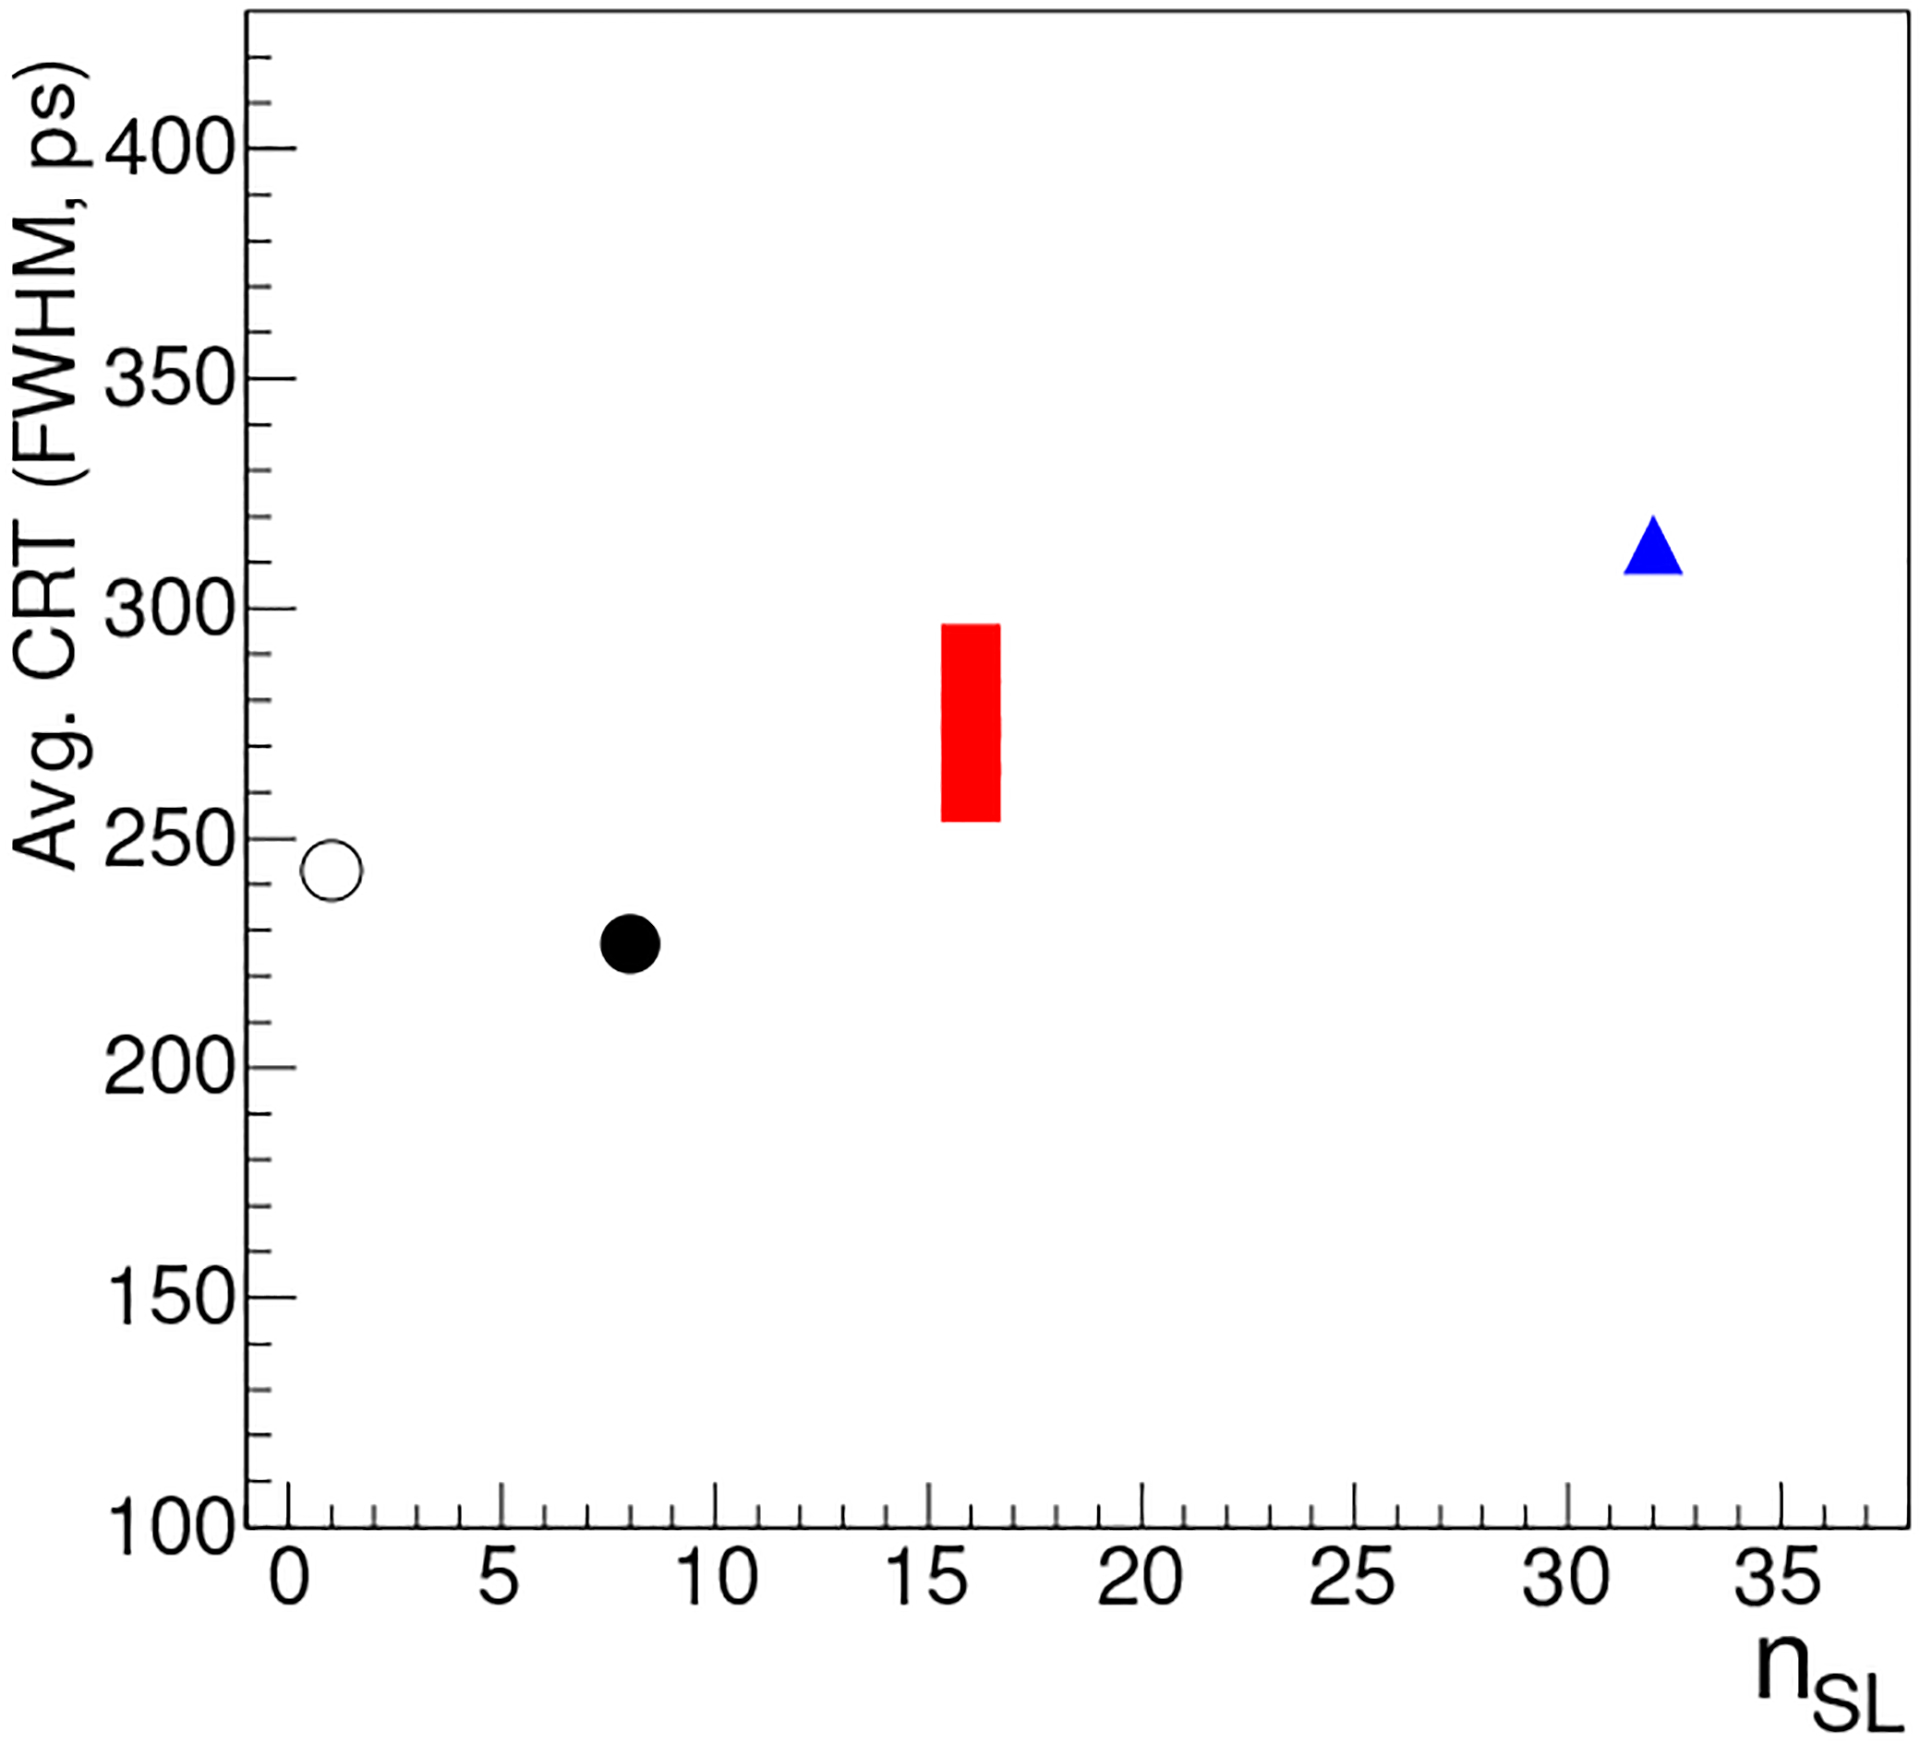
Average CRTs for two identical detectors in coincidence. empty black circle: reference detector and direct readout; black circle: 8×4 array detector and SL-8(25.0 mm); red squares: 16×4 array detector and SL-16s (seen as a bar because the 4 squares overlap); blue triangle: 16×4 array detector and SL-32(25.0 mm).
For purpose of reference, in the literature researchers have reported CRT in the range of 69–350 ps for single-pixel detectors based on lutetium scintillators and SiPMs [5], [57], [34], [58], [59], [60], [61], [43], [62]. Different electronics and crystal sizes (cross section ranging from 2×2 mm2 to 4.2×4.2 mm2 and length from 3 mm to 20 mm) were used in these works, and generally shorter crystals yielded better CRT. Specifically, Gundacker et al reported 69 ps CRT for 2×2×3 mm3 crystals (no Ca co-doping) [43] and 113 ps for 2×2×10 mm3 crystals [62]. Bieniosek et al reported ~175 ps CRT for 3×3×20 mm3 LFS coupled to 3×3 mm2 SiPMs; it became ~250 ps when 16 SiPMs were multiplexed [34].
IV. Conclusions and Discussion
We study the use of SLs for multiplexing readout of SiPM-based TOF PET detectors. We consider two design parameters, including the number of inputs on an SL (nSL) and the SL pathlength between adjacent input positions (Δℓ). For channel reduction, using a larger nSL is desirable but generally it can also degrade the timing properties of the readout and diminishes the positioning accuracy and CRT. Using a larger Δℓ can stretch out more the detector spacing in the measurement space and thereby improve the positioning accuracy. But, increasing Δℓ increases the inductance and capacitance, as well as the attenuation of the SL; eventually, it can unacceptably degrade the timing properties. in practice, an SL readout is a copper trace on an adequate PCB with passive circuits for receiving SiPM outputs. Subject to the available space on PCB, Δℓ can be varied easily by routing the copper trace in a smooth zigzag pattern.
We employ several SL test boards to measure how these parameters affect PET-relevant detection performance. The outputs of these boards are sampled by using a DRS4 evaluation board, without explicitly employing any pre-amplifier. Excluding the SL-32(37.5 mm) case, which may have implementation defects, our result indicates that accurate pixel discrimination can be achieved for nSL up to 32, especially if Al is increased to accommodate the increase in σ(δt) when increasing nSL. Compared to the reference detector that uses a direct readout, there is little degradation in the ER for all values of nSL and Δℓ considered. The CRT does not show obvious dependence on Δℓ for the values examined but it continually degrades as nSL increases. The degradation is not strong: the CRT still supports TOF at nSL = 32, corresponding to . It is remarkable that with this multiplexing readout the pixels exhibit rather uniform ER and CRT.
LED and CFD are two popular time pick-up methods for PET. While the LED method suffers from time walk, it has been recently reported that, when applied to photopeak events, CRT obtained by LED with a low threshold can be as good as or even better than that by CFD [55], [6]. In agreement with these previous works, we find that it is better to use LED with a low threshold for measuring , which is used for coincidence detection. On the other hand, CFD is found to be slightly better for measuring δt, which is used for positioning. As shown in Figs. 2 and 9, the two waveforms seen at the ends of the SL are highly correlated in shape but may differ in amplitude. In this case, CFD is preferable for it is designed to produce amplitude-independent time for pulses of the same shape. It is worth noting that the result also suggests that the SLB introduces little electronic noise to break the correlation between the waveforms. Applying time-walk correction may improve the precision of δt and , further; it is not considered in this work.
We have proposed to apply the SL readout to an array detector that employs a dual-end light readout for DOI measurement [63]. In this case, we apply an SL to read the SiPM array on one side of the detector in a row and another SL to read the array on the other side in a column. If successful, an array detector that contains N × N pixels (and 2N2 SiPMs) uses only 2 SLs to produce only 4 outputs. In this case, we have . The result of this work leads us to stipulate that N = 32 may be possible, achieving . However, more studies are needed to experimentally validate this promising readout, especially in its ability to maintain TOF resolution.
Light sharing is also a common multiplexing strategy in PET for reading many pixellated scintillators by using fewer PDs. Defining the light-sharing multiplexing rati as Nxtal/Npd, where Nxtal and Npd are the numbers of crystals and PDs respectively, the total multiplexing ratio is then given by . Generally, as increases, fewer light photons are collected and dispersion in the photon path increases, leading to degraded positioning accuracy, ER, and CRT [64]. As with most electronics multiplexing methods, at a moderate TOF capability can be lost.
So far, the proposed SL readout assumes that there is one signal appearing at one of its inputs. Therefore, in this and previous studies we applied the readout to detectors with . This condition however may be relaxed. For example, consider the situation shown in Fig. 14. If lights generated in c2 are equally distributed to d1 and d2, the signals first arriving at A and B will be from d1 and d2, respectively. Therefore, we obtain δt(c2) = tA − tB = (l1 − l3)/v, where tA and tB are the arrival time at A and B. Lights in c1 reach only d1 however; hence, δt(c1) = (l1 − l3 − l2)/v = δt(c2) − l2/v. Similarly, we get δt(c3) = δt(c2) + l2/v. Thus, c2 is identified correctly as between c1 and c3. We have early confirmation data for this observation which also shows no noticeable degradation in the CRT. Hence, we are encouraged to believe that the readout is applicable to array detectors with a small to further increase the total multiplexing ratio.
Fig. 14.
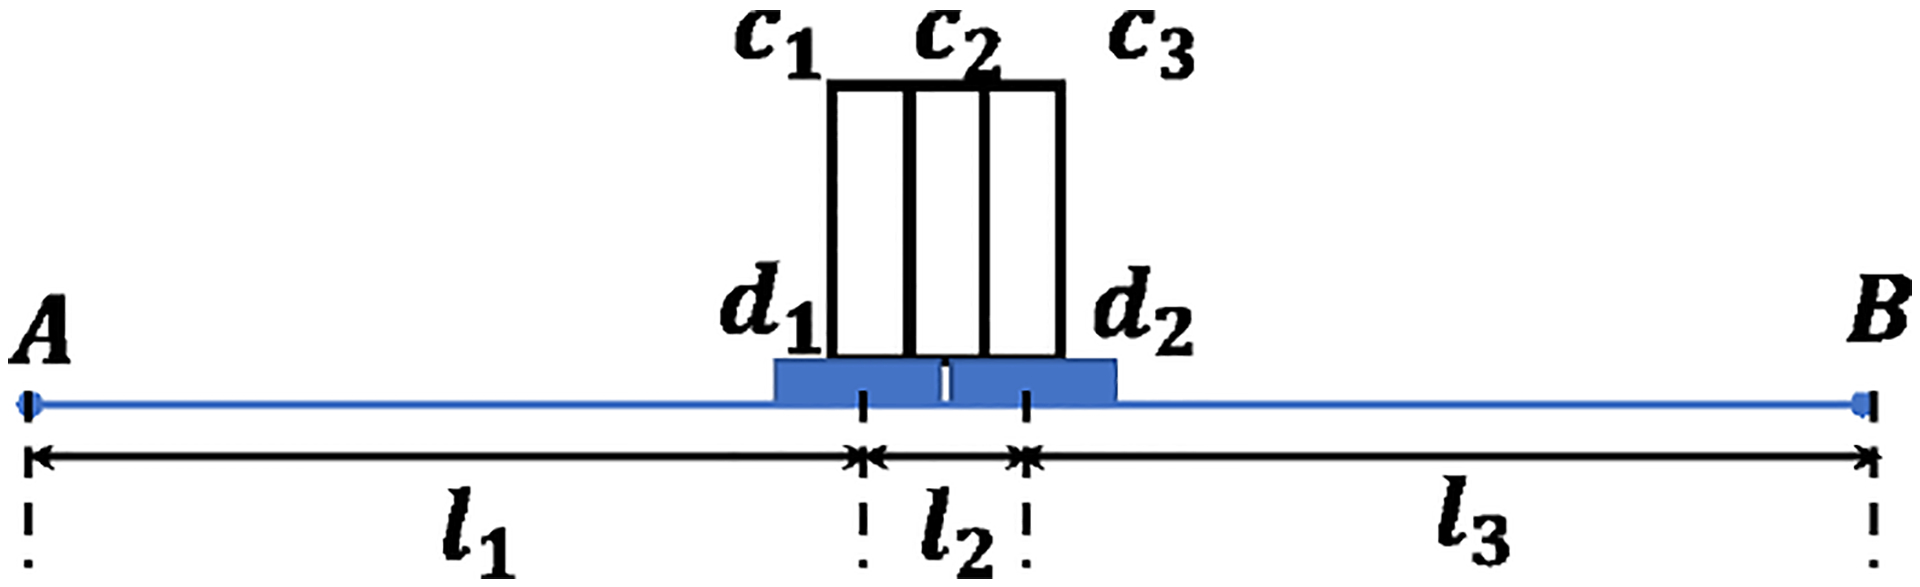
An illustration of applying the SL readout for . The width of the crystals (c1, c2, c3) is half that of the SiPMs (d1, d2), and c2 sits across the two SiPMs. Signals are detected at A and B. l1 (l3) is the SL pathlength from d1 to A (from d2 to B). l2 is the pathlength between d1 and d2.
Multiplexing readout achieves channel reduction at the expense of count rate. We have not discussed or examined this issue because count-rate capability also strongly depends on the DAQ electronics and the DRS4 evaluation board used in this work is unlikely to be used in practice.
We have reported above that, as it travels on an SL the amplitude of a signal is slightly but progressively attenuated. A similar situation can be observed for the rise time. Fig. 15 shows the difference in the rise time of the two waveforms seen at the two ends of SL-8(25 mm) with respect to the crystal ID. This difference is observed to decrease as the crystal ID increases. This behavior is consistent with the interpretation that as a signal pulse travels a longer SL pathlength and passes more SiPMs its rise time increases. We stipulate that the observed deterioration in the CRT as nSL increases is due to this increase in the rise time. It is interesting that Fig. 15 has an almost constant slope.
Fig. 15.
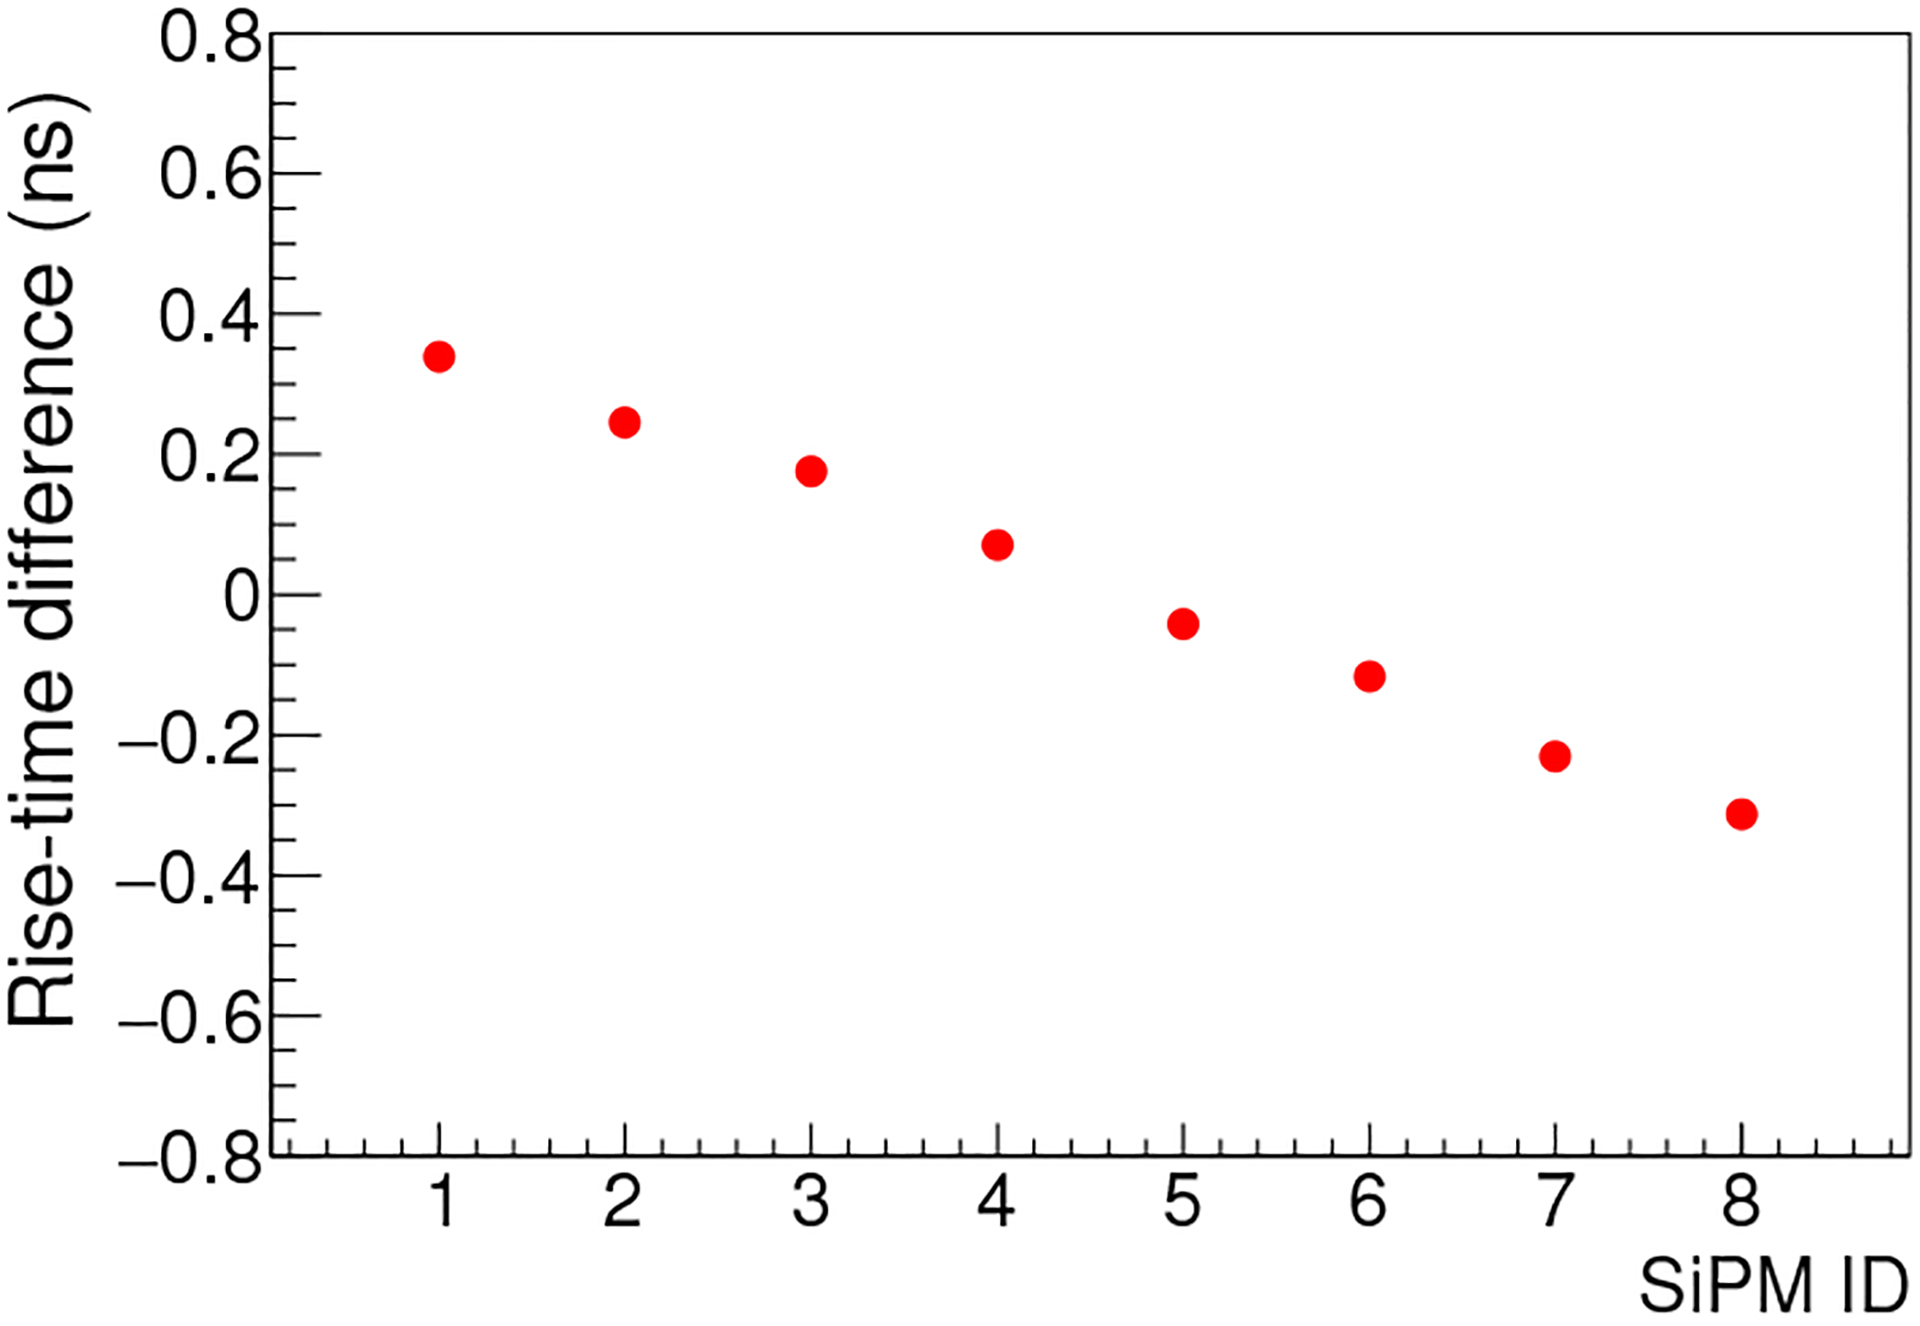
Difference in the rise time of the pulse waveforms seen at the two ends of an SL-8(25 mm). With respect to the plot, the difference is obtained by subtracting the rise time seen at the right end by that at the left end. The rise time of a waveform is the duration from 10% to 90% of the pulse height.
Acknowledgment
The authors wish to thank Mr. Nathanial Holderman for his editorial assistance. This work was supported in part by the University of Chicago Department of Radiology Seed Grant, the University of Chicago Comprehensive Cancer Center Program Pilot Grant and Team Award, NIH R03 EB027343, and NIH R01 CA236385. It was also supported in part by the National Natural Science Foundation of China under Grant 61927801 and the National Key R&D Program of China under Grants 2019YFC0118900 and 2016YFF0101500. The authors also thank the anonymous reviewers for their many insightful comments.
Contributor Information
Heejong Kim, Department of Radiology, University of Chicago, Chicago, IL 60637 USA.
Chien-Min Kao, Department of Radiology, University of Chicago, Chicago, IL 60637 USA.
Yuexuan Hua, Raycan Technology Co., Ltd., Suzhou, Jiangsu 215163, China.
Qingguo Xie, Biomedical Engineering Department, Huazhong University of Science and Technology, Wuhan, Hubei, China.
Chin-Tu Chen, Department of Radiology, University of Chicago, Chicago, IL 60637 USA.
References
- [1].Roncali E and Cherry SR, “Application of silicon photomultipliers to positron emission tomography,” Ann Biomed Eng, vol. 39, no. 4, pp. 1358–1377, 2011. [DOI] [PMC free article] [PubMed] [Google Scholar]
- [2].Otte N, Dolgoshein B, Hose J, Klemin S, Lorenz E, Mirzoyan R, Popova E, and Teshima M, “The SiPM – a new photon detector for PET,” Nuclear Physics B - Proceedings Supplements, vol. 150, pp. 417–420, 2006. [Google Scholar]
- [3].Risigo F, Bulgheroni A, Caccia M, Cappellini C, Chmill V, Fedyushkina N, Golubev A, Jastrzab M, Kantsyrev A, Markov N, Martemianov A, Pychlau C, and Wurfel J, “SiPM technology applied to radiation sensor development,” Nucl Instrum Meth A, vol. 607, pp. 75–77, 2009. [Google Scholar]
- [4].Buzhan P, Dolgoshein B, Filatov L, Ilyin A, Kantzerov V, Kaplin V, Karakash A, Kayumov F, Klemin S, Popova E, and Smirnov S, “Silicon photomultiplier and its possible applications,” Nucl Instrum Meth A, vol. 504, no. 1, pp. 48–52, 2003. [Google Scholar]
- [5].Goertzen AL and Van Elburg D, “Performance characterization of MPPC modules for TOF-PET applications,” IEEE Trans Radiat Plasma Med Sci, vol. 3, no. 4, pp. 475–482, 2019. [Google Scholar]
- [6].Xu T, Wen J, Wang Q, Wei Q, Ma T, Liu Y, and Tai Y-C, “A novel sub-millimeter resolution PET detector with TOF capability,” in 2013 NSS/MIC, 2013, pp. 1–5. [Google Scholar]
- [7].Wang Y, Zhang Z, Li D, Wang B, Shuai L, Feng B, Chai P, Liu S, Tang H, Li T, Liao Y, Huang X, Chen Y, Liu Y, Zhang Y, and Wei L, “Design and performance evaluation of a compact, large-area PET detector module based on silicon photomultipliers,” Nucl Instrum Meth A, vol. 670, pp. 49–54, 2012. [Google Scholar]
- [8].Sajedi S, Zeraatkar N, Taheri M, Kaviani S, Khanmohammadi H, Sarkar S, Sabet H, and Ay MR, “Generic high resolution PET detector block using 12×12 SiPM array,” Biomed Phys Eng Express, vol. 4, no. 3, p. 035014, 2018. [Google Scholar]
- [9].D’Ascenzo N, Antonecchia E, Gao M, Zhang X, Baumgartner G, Brensing A, Li Z, Liu Q, Rose G, Shi X, Zhang B, Kao C-M, Ni J, and Xie Q, “Evaluation of a digital brain positron emission tomography scanner based on the plug&imaging sensor technology,” IEEE Trans Radiat Plasma Med Sci, vol. 4, no. 3, pp. 327–334, 2020. [Google Scholar]
- [10].Vandendriessche D, Uribe J, Bertin H, and De Geeter F, “Performance characteristics of silicon photomultiplier based 15-cm AFOV TOF PET/CT,” EJNMMI Physics, vol. 6, no. 1, p. 8, 2019. [DOI] [PMC free article] [PubMed] [Google Scholar]
- [11].Conti M and Bendriem B, “The new opportunities for high time resolution clinical TOF PET,” Clin Transl Imaging, vol. 7, no. 2, pp. 139–147, 2019. [Google Scholar]
- [12].Zhang J, Maniawski P, and Knopp MV, “Performance evaluation of the next generation solid-state digital photon counting PET/CT system,” EJNMMI Research, vol. 8, no. 1, p. 97, 2018. [DOI] [PMC free article] [PubMed] [Google Scholar]
- [13].Venialgo E, Lusardi N, Garzetti F, Geraci A, Brunner SE, Schaart DR, and Charbon E, “Toward a full-flexible and fast-prototyping TOF-PET block detector based on TDC-on-FPGA,” IEEE Trans Radiat Plasma Med Sci, vol. 3, no. 5, pp. 538–548, 2019. [Google Scholar]
- [14].Nishikido F, Inadama N, Yoshida E, Murayama H, and Yamaya T, “Four-layer DOI PET detectors using a multi-pixel photon counter array and the light sharing method,” Nucl Instrum Meth A, vol. 729, pp. 755–761, 2013. [Google Scholar]
- [15].Levin CS, “Promising new photon detection concepts for high-resolution clinical and preclinical PET,” J Nucl Med, vol. 53, no. 2, pp. 167–170, 2012. [DOI] [PMC free article] [PubMed] [Google Scholar]
- [16].Kang HG, Takyu S, Fumihiko N, and Yamaya T, “A staggered three-layer DOI PET detector with a 1 mm crystal pitch for a high resolution small animal PET imaging,” J Nucl Med, vol. 60, pp. 529–529, 2019.30936254 [Google Scholar]
- [17].Mohammadi I, Castro IFC, Correia PMM, Silva ALM, and Veloso JFCA, “Minimization of parallax error in positron emission tomography using depth of interaction capable detectors: methods and apparatus,” Biomed Phys Eng Express, vol. 5, no. 6, p. 062001, 2019. [Google Scholar]
- [18].Gonzalez AJ, Berr SS, Canizares G, Gonzalez-Montoro A, Orero A, Correcher C, Rezaei A, Nuyts J, Sanchez F, Majewski S, and Benlloch JM, “Feasibility study of a small animal PET insert based on a single LYSO monolithic tube,” Front Med, vol. 5, 2018. [DOI] [PMC free article] [PubMed] [Google Scholar]
- [19].Nishikido F, Fujiwara M, Tashima H, Akram M, Suga M, Obata T, and Yamaya T, “Development of a full-ring “add-on PET” prototype: A head coil with DOI-PET detectors for integrated PET/MRI,” Nucl Instrum Meth A, vol. 863, pp. 55–61, 2017. [Google Scholar]
- [20].Jiang J, Li K, Wang Q, Puterbaugh K, Young JW, Siegel SB, O’Sullivan JA, and Tai Y-C, “A second-generation virtual-pinhole PET device for enhancing contrast recovery and improving lesion detectability of a whole-body PET/CT scanner,” Med Phys, vol. 46, no. 9, pp. 4165–4176, 2019. [DOI] [PMC free article] [PubMed] [Google Scholar]
- [21].Zvolsky M and the EndoTOFPET-US Collaboration, “EndoTOFPET-US – a miniaturised calorimeter for endoscopic time-of-flight positron emission tomography,” J Phys: Conf Ser, vol. 587, p. 012068, 2015. [Google Scholar]
- [22].Garibaldi F, Capuani S, Colilli S, Cosentino L, Cusanno F, Leo RD, Finocchiaro P, Foresta M, Giove F, Giuliani F, Gricia M, Loddo F, Lucentini M, Maraviglia B, Meddi F, Monno E, Musico P, Pappalardo A, Perrino R, Ranieri A, Rivetti A, Santavenere F, and Tamma C, “TOPEM: A PET-TOF endorectal probe, compatible with MRI for diagnosis and follow up of prostate cancer,” Nucl Instrum Meth A, vol. 702, pp. 13–15, 2013. [Google Scholar]
- [23].Vandenberghe S and Marsden PK, “PET-MRI: a review of challenges and solutions in the development of integrated multimodality imaging,” Phys Med Biol, vol. 60, no. 4, pp. R115–R154, 2015. [DOI] [PubMed] [Google Scholar]
- [24].Weissler B, Gebhardt P, Lerche CW, Wehner J, Solf T, Goldschmidt B, Mackewn JE, Marsden PK, Kiessling F, Perkuhn M, Heberling D, and Schulz V, “MR compatibility aspects of a silicon photomultiplier-based PET/RF insert with integrated digitisation,” Phys Med Biol, vol. 59, no. 17, pp. 5119–5139, 2014. [DOI] [PubMed] [Google Scholar]
- [25].Schug D, Lerche C, Weissler B, Gebhardt P, Goldschmidt B, Wehner J, Dueppenbecker PM, Salomon A, Hallen P, Kiessling F, and Schulz V, “Initial PET performance evaluation of a preclinical insert for PET/MRI with digital SiPM technology,” Phys Med Biol, vol. 61, no. 7, pp. 2851–2878, 2016. [DOI] [PMC free article] [PubMed] [Google Scholar]
- [26].Gonzalez AJ, Gonzalez-Montoro A, Vidal LF, Barbera J, Aussenhofer S, Hernandez L, Moliner L, Sanchez F, Correcher C, Pincay EJ, Cañizares G, Lamprou E, Sanchez S, Catret JV, Jiménez-Serrano S, Cabello J, Schwaiger M, Iborra A, Merlin T, Visvikis D, and Benlloch JM, “Initial results of the MINDView PET insert inside the 3T mMR,” IEEE Trans Radiat Plasma Med Sci, vol. 3, no. 3, pp. 343–351, 2019. [Google Scholar]
- [27].Omidvari N, Topping G, Cabello J, Paul S, Schwaiger M, and Ziegler SI, “MR-compatibility assessment of MADPET4: a study of interferences between an SiPM-based PET insert and a 7 T MRI system,” Phys Med Biol, vol. 63, no. 9, p. 095002, 2018. [DOI] [PubMed] [Google Scholar]
- [28].Kim H, Hua Y, Chen H-T, Tsai H-M, Chen C-T, Karczmar G, Fan X, Xi D, Xie Q, Chou C-Y, and Kao C-M, “Design, evaluation and initial imaging results of a PET insert based on strip-line readout for simultaneous PET/MRI,” Nucl Instrum Meth A, vol. 959, p. 163575, 2020. [DOI] [PMC free article] [PubMed] [Google Scholar]
- [29].Belcari N, Bisogni MG, Camarlinghi N, Carra P, Cerello P, Morrocchi M, Patera A, Sportelli G, and Del Guerra A, “Design and detector performance of the PET component of the TRIMAGE PET/MR/EEG scanner,” IEEE Trans Radiat Plasma Med Sci, vol. 3, no. 3, pp. 292–301, 2019. [Google Scholar]
- [30].Downie E, Yang X, and Peng H, “Investigation of analog charge multiplexing schemes for SiPM based PET block detectors,” Phys Med Biol, vol. 58, pp. 3943–3964, 2013. [DOI] [PubMed] [Google Scholar]
- [31].Goertzen AL, Zhang X, McClarty MM, Berg EJ, Liu C-Y, Retiere F, Ryner L, Sossi V, Stortz G, and Thompson CJ, “Design and performance of a resistor multiplexing readout circuit for a SiPM detector,” IEEE Trans Nucl Sci, vol. 60, pp. 1541–1549, 2013. [Google Scholar]
- [32].Park H, Ko GB, and Lee JS, “Hybrid charge division multiplexing method for silicon photomultiplier based PET detectors,” Phys Med Biol, vol. 62, pp. 4390–4405, 2017. [DOI] [PubMed] [Google Scholar]
- [33].Park H and Lee JS, “Highly multiplexed SiPM signal readout for brain-dedicated TOF-DOI PET detectors,” Phys Medica, vol. 68, pp. 117–123, 2019. [DOI] [PubMed] [Google Scholar]
- [34].Bieniosek MF, Cates JW, and Levin CS, “Achieving fast timing performance with multiplexed SiPMs,” Phys Med Biol, vol. 61, no. 7, pp. 2879–2892, 2016. [DOI] [PubMed] [Google Scholar]
- [35].Bieniosek MF, Cates JW, Grant AM, and Levin CS, “Analog filtering methods improve leading edge timing performance of multiplexed SiPMs,” Phys Med Biol, vol. 61, no. 16, pp. N427–N440, 2016. [DOI] [PMC free article] [PubMed] [Google Scholar]
- [36].SensL, “Readout methods for arrays of SiPM: Application note,” http://sensl.com/downloads/ds/TN-Readout_Methods_for_Arrays_of_SiPM.pdf.
- [37].Kwon SI and Lee JS, “Signal encoding method for a time-of-flight PET detector using a silicon photomultiplier array,” Nucl Instrum Meth Phys Res A, vol. 761, pp. 39–45, 2014. [Google Scholar]
- [38].Xi D, Liu X, Zeng C, Liu W, Li Y, Hua Y, Mei X, Kim H, Xiao P, Kao C-M, and Xie Q, “Modularized compact positron emission tomogrpahy detector for rapid system development,” J Med Imag, vol. 4, p. 011006, 2017. [DOI] [PMC free article] [PubMed] [Google Scholar]
- [39].Won JY, Ko GB, and Lee JS, “Delay grid multiplexing: simple time-based multiplexing and readout method for silicon photomultipliers,” Phys Med Biol, vol. 61, pp. 7113–7135, 2016. [DOI] [PubMed] [Google Scholar]
- [40].Kim H, Frisch H, Chen C-T, Genat JF, Tang F, Moses WW, Choong WS, and Kao CM, “A design of a PET detector using micro-channel plate photomultipliers with transmission-line readout,” Nucl Instrum Meth A, vol. 622, no. 3, pp. 628–636, 2010. [DOI] [PMC free article] [PubMed] [Google Scholar]
- [41].Ko GB and Lee JS, “Single transmission-line readout method for silicon photomultiplier based time-of-flight and depth-of-interaction PET,” Phys Med Biol, vol. 62, no. 6, pp. 2194–2207, 2017. [DOI] [PubMed] [Google Scholar]
- [42].Cates JW, Bieniosek MF, and Levin CS, “Highly multiplexed signal readout for a time-of-flight positron emission tomography detector based on silicon photomultipliers,” J Med Imaging, vol. 4, no. 1, p. 011012, 2017. [DOI] [PMC free article] [PubMed] [Google Scholar]
- [43].Gundacker S, Turtos RM, Kratochwil N, Pots RH, Paganoni M, Lecoq P, and Auffray E, “Experimental time resolution limitos of modern SiPMs and TOF-PET detectors exploring different scintillators and cherenkov emission,” Phys Med Biol, vol. 65, p. 025001, 2020. [DOI] [PubMed] [Google Scholar]
- [44].Kim H, Chen C-T, Eclov N, Ronzhin A, Murat P, Ramberg E, Los S, Wyrwicz AM, Li L, and Kao CM, “A feasibility study of a PET/MRI insert detector using strip-line and waveform sampling data acquisition,” Nucl Instrum Meth A, vol. 784, pp. 557–564, 2015. [DOI] [PMC free article] [PubMed] [Google Scholar]
- [45].Kim H, Epel B, Sundramoorthy S, Tsai H-M, Barth E, Halpern H, Chen C-T, and Kao C-M, “Development of a PET/EPRI simultaneous imaging system for assessing tumor hypoxia,” J Nucl Med, vol. 60, pp. 526–526, 2019. [Google Scholar]
- [46].Li C, Wang S, Huo L, Wang Y, Liang K, Yang R, and Han D, “Positon sensitive silicon photomultipler with intrinsic continuous cap resistive layer,” IEEE Trans Electron Devices, vol. 61, pp. 3229–3232, 2014. [Google Scholar]
- [47].Schmall JP, Du J, Judenhofer MS, Dokhale P, Christian J, McClish M, Shah KS, and Cherry SR, “A study of position-sensitive solid-state photomultiplier signal properties,” IEEE Trans Nucl Sci, vol. 61, pp. 1074–1083, 2014. [DOI] [PMC free article] [PubMed] [Google Scholar]
- [48].Ferri A, Acerbi F, Gola A, Paternoster G, Piemonte C, and Zorzi N, “Characterization of linearly graded position-sensitive silicon photomultipliers,” IEEE Trans Nucl Sci, vol. 62, pp. 688–693, 2015. [DOI] [PMC free article] [PubMed] [Google Scholar]
- [49].Li B, Wang S, Li C, Zhao T, Miao Q, Wang R, Jia J, Liang K, Yang R, and Han D, “Time-resolving characteristics of pixel- and charge-division-type position sensitive SiPMs with epitaxial quenching resistors,” IEEE Trans Electron Devices, vol. 64, pp. 2239–2243, 2017. [Google Scholar]
- [50].Du J, Bai X, Gola A, Acerbi F, Ferri A, Piemonte C, Yang Y, and Cherry SR, “Performance of a high-resolution depth-encoding pet detector module using linearly-graded SiPM arrays,” Phys Med Biol, vol. 63, p. 035035, 2018. [DOI] [PMC free article] [PubMed] [Google Scholar]
- [51].Gupta KC, Garg R, Bahl I, and Bhartia P, Microstrip lines and slotlines, 2nd ed.Norwood, MA: Artech House, 1996. [Google Scholar]
- [52].Kaupp HR, “Characteristics of microstrip transmission lines,” IEEE Transctions on Electronic Computers, vol. 2, pp. 185–193, 1967. [Google Scholar]
- [53].Kim H, Hua Y, Xi D, Xie Q, Eclov N, Chen H-T, Chen C-T, Chou C-Y, and Kao C-M, “A prototype MR insert PET detector with strip-line readout,” in 2017 NSS/MIC, 2017, pp. 1–2. [Google Scholar]
- [54].Kim H, Chen C-T, Eclov N, Ronzhin A, Murat P, Ramberg E, Los S, Moses W, Choong WS, and Kao C-M, “A new time calibration method for switched-capacitor-array-based waveform samplers,” Nucl Instrum Meth A, vol. 767, pp. 67–74, 2014. [DOI] [PMC free article] [PubMed] [Google Scholar]
- [55].Derenzo SE, Choong W-S, and Moses WW, “Monte carlo calculations of PET coincidence timing: single and double-ended readout,” Phys Med Biol, vol. 60, no. 18, pp. 7309–7338, 2015. [DOI] [PMC free article] [PubMed] [Google Scholar]
- [56].Kim H, Choong W-S, Eclov N, Abu-Nimeh F, Chen C-T, and Kao C-M, “A performance comparison of LFS and LYSO scintillators for TOF PET,” in 2015 NSS/MIC, 2015, pp. 1–2. [Google Scholar]
- [57].Powolny F, Auffray E, Brunner SE, Garutti E, Goettlich M, Hillemanns H, Jarron P, Lecoq P, Meyer T, Schultz-Coulon HC, Shen W, and Williams MCS, “Time-based readout of a silicon photomultiplier (SiPM) for time of flight positron emission tomography (TOF-PET),” IEEE Trans Nucl Sci, vol. 58, pp. 597–604, 2011. [Google Scholar]
- [58].Grant AM and Levin CS, “A new dual threshold time-over-threshold circuit for fast timing in PET,” Phys Med Biol, vol. 59, pp. 3421–3430, 2014. [DOI] [PubMed] [Google Scholar]
- [59].Gundacker S, Auffray E, Jarron P, Meyer T, and Lecoq P, “On the comparison of analog and digital SiPM readout in terms of expected timing performance,” Nucl Instrum Meth A, vol. 787, pp. 6–11, 2015. [Google Scholar]
- [60].Yeom JY, Vinke R, and Levin CS, “Optimizing timing performance of silicon photomultiplier-based scintillation detectors,” Phys Med Biol, vol. 58, pp. 1207–1220, 2013. [DOI] [PMC free article] [PubMed] [Google Scholar]
- [61].Auffray E, Frisch B, Geraci F, Ghezzi A, Gundacker S, Hillemanns H, Jarron P, Meyer T, Paganoni M, Pauwels K, Pizzichemi M, and Lecoq P, “A comprehensive & systematic study of coincidence time resolution and light yield using scintillators of different size, wrapping and doping,” in 2011 NSS/MIC, 2011, pp. N4–6. [Google Scholar]
- [62].Gundacker S, Acerbi F, Auffray E, Ferri A, Gola A, Nemallapudi MV, Paternoster G, Piemonte C, and Lecoq P, “State of the art timing in TOF-PET detectors with LuAG, GAGG and L(Y)SO scintillators of various sizes coupled to FBK-SiPMs,” J Instrumentation, vol. 11, p. P08008, 2016. [Google Scholar]
- [63].Lyu X, Tian C, Kao C-M, Xu F, Lyu J, Hua Y, Wang Y, Kim H, and Xie Q, “TOF and DOI capable SiPM-PET detector using striplines that provide row and column based measurements,” in 2017 NSS/MIC, 2017, pp. 1–3. [Google Scholar]
- [64].Moses W and Ullisch M, “Factors influencing timing resolution in a commercial LSO PET camera,” IEEE Trans Nucl Sci, vol. 53, no. 1, pp. 78–85, 2006. [Google Scholar]