Abstract
The Gut Cell Atlas (GCA), an initiative funded by the Helmsley Charitable Trust, seeks to create a reference platform to understand the human gut, with a specific focus on Crohn’s disease. Although a primary focus of the GCA is on focusing on single-cell profiling, we seek to provide a framework to integrate other analyses on multi-modality data such as electronic health record data, radiological images, and histology tissues/images. Herein, we use the research electronic data capture (REDCap) system as the central tool for a secure web application that supports protected health information (PHI) restricted access. Our innovations focus on addressing the challenges with tracking all specimens and biopsies, validating manual data entry at scale, and sharing organizational data across the group. We present a scalable, cross-platform barcode printing/record system that integrates with REDCap. The central informatics infrastructure to support our design is a tuple table to track longitudinal data entry and sample tracking. The current data collection (by December 2020) is illustrated with types and formats of the data that the system collects. We estimate that one terabyte is needed for data storage per patient study. Our proposed data sharing informatics system addresses the challenges with integrating physical sample tracking, large files, and manual data entry with REDCap.
1. INTRODUCTION
The Gut Cell Atlas (GCA), an initiative funded by The Leona M. and Harry B. Helmsley Charitable Trust, seeks to create a reference platform to understand the human gut focused on comparing Crohn’s disease patients to healthy controls (https://www.gutcellatlas.helmsleytrust.org/). Crohn’s disease (CD) is one of the two main forms of inflammatory bowel disease (IBD), which are characterized by chronic, relapsing and remitting bowel inflammation [1]. The prevalence of IBD is increasing with an estimated 3.1 million Americans affected [2]. Although the GCA is primarily focused on single-cell profiling, we seek to provide a framework to integrate other analyses on multi-modality data such as clinical metadata, radiologic imaging data, and histologic tissue assessment. As illustrated in Figure 1, there are 4 different categories of data being collected on approximately 140 patients: (1) protected health information (PHI): demographics, past medical history, social history, medications; (2) physical sample collection at the time of endoscopy: stool, serum, whole blood for DNA, fresh biopsies, fixed biopsies, and frozen biopsies from both the terminal ileum (TI) and ascending colon (AC); (3) imaging: abdominal/pelvis magnetic resonance imaging (MRI), computed tomography (CT), hematoxylin and eosin (H&E) staining, and multiplex immunofluorescence (MxIF)/RNA fluorescence in situ hybridization (RNA-FISH) protocols; and (4) data processing and analysis: CT/MRI, histology, single cell RNA-sequencing (scRNA-seq) [3–5], DNA, and clinical metadata. For each patient, our goal is to collect at least 3 sets of biopsies (fresh/fixed/frozen biopsies) from both the TI and AC for a total of 6 sets of biopsies, where each set is 2 biopsies combined for a total of 12 biopsies. In some CD patients, we may be able to obtain paired (inflamed and uninflamed) samples from the TI and/or AC for up to 12 sets of biopsies. Some data analyses are not listed that are in the planning phase, such as analysis of stool, serum, MxIF/RNA-Fish, and further cross-link multi-modality studies.
Figure 1.
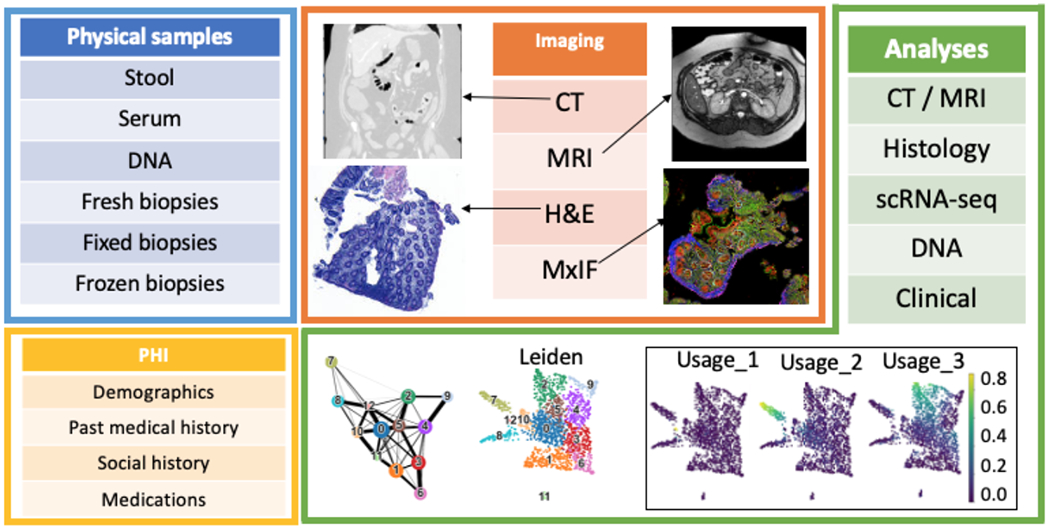
A summary of data collection per patient. There are 4 categories of data collection: (1) physical sample, (2) PHI, (3) imaging, and (4) analysis results. Four sample images of CT/MRI/H&E/MxIF are shown. Part of the clustering and dimension reduction UMAP embedding results are shown for scRNA-seq analysis.
The research electronic data capture (REDCap) system is a central tool for a secure web application that supports PHI restricted access[6]. Thus, REDCap is an ideal tool to store the PHI information for the GCA. We also use REDCap to digitally capture the related information about the physical samples: i.e., to document a specimen’s storage location; record what physical samples are collected from a specific patient; and track if a sample has been processed. Furthermore, digital identification at the time of specimen retrieval with barcodes or radio frequency identification tags is popular to decrease manual identification errors [7–9]. Hence, the first two challenging questions we focused on were: 1) how to track the storage and processing status of each sample with REDCap using digital identification? and 2) how to detect any data entry inconsistency in a large-scale study like the GCA? As a complete data collection workflow framework, the third challenge to cope with is: how to store and share the raw collected data (i.e., imaging) and data analysis results within our group as well as with the other Helmsley Charitable Trust GCA groups?
To resolve these challenges, we present a scalable, cross-platform barcode printing/record system that integrates with REDCap. The central informatics infrastructure to support our design is a tuple table to track longitudinal data entry and sample tracking.
2. METHODS
In this section, we mainly introduce the GCA data collection informatics system’s design criteria for the GCA. Figure-2 illustrates the data collection workflow. We provide a barcode printer app, a user-friendly data entry app, and utilize the Center for Computational Imaging at Vanderbilt University Institute of Imaging Science XNAT system (VUIIS CCI XNAT) [6] with REDCap to store large files. Finally, we provide a secure online dashboard to present user statistics and necessary data entry consistency checks.
Figure 2.
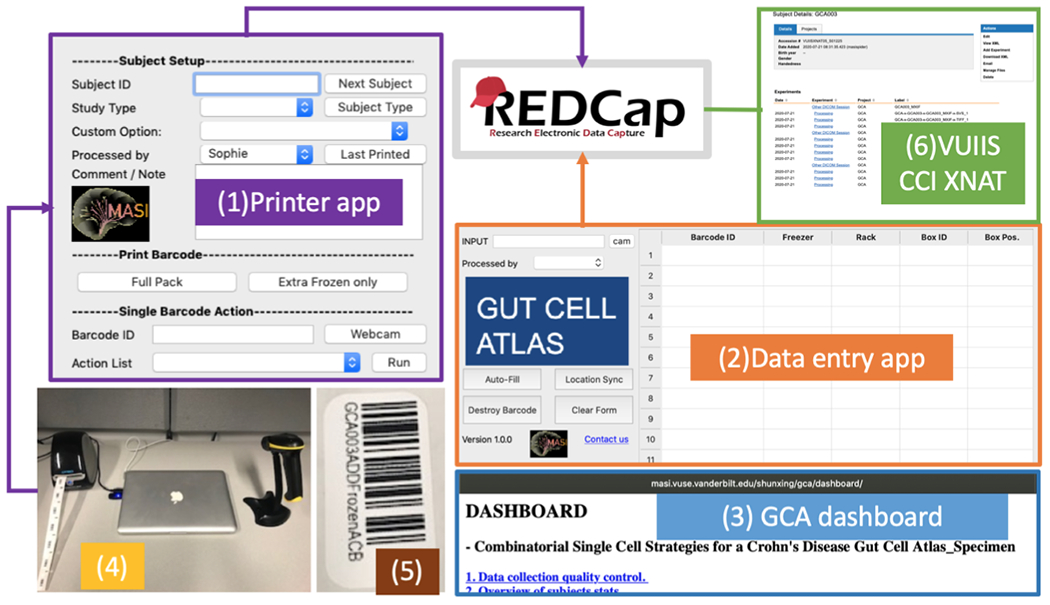
The data entry workflow of the GCA data collection. (1) According to patient types (i.e., healthy control vs Crohn’s disease), the printer app generates the barcodes). The barcodes are recorded to REDCap after printing. The barcode is human-readable, and scanner scannable for any further sample operations (i.e., distribute to other labs, store to a rack & box position, destroy a barcode). (2) The Location/Data entry app is a user-friendly software to help users enter data into REDCap to reduce manual input errors. (3) The GCA online dashboard is designed to show sample stats that users may care about, and it also allows for quality control and identification of potential inconsistencies with data entry in REDCap. (4) All apps are installed on a laptop workstation. The workstation connects to a barcode label printer and wireless barcode scanner. (5) A sample barcode for a frozen specimen. (6) The VUIIS CCI is a system based on XNAT that is used to store any large data in the GCA project.
2.1. Design criteria 1: Digitize the physical sample identification with human-readable sample recognition.
Digitization identification has the potential to ease human read and manual data entry errors. We present a Python (Python 3.x) based barcode printing app. To print the barcodes, users need to specify subject ID, patient types, and customized print setting. The printer app can also re-print any single specific barcode ID. The printer app then inputs the barcode IDs to REDCap when the barcodes are printed. The printed barcodes are affixed to the relevant tube for future processing/storage. The barcode has two parts: human-readable ID and scanner scannable barcode. The human-readable ID B1 (Figure-2(5)) consists of four elements: B1={x1, x2, x3, x4}, where x1 is a constant string ‘GCA’, x2 is a three-digit number that represents patient ID, x3 is the category of a sample, x4 is a pre-defined ID in each sample category. The sample categories are: DNA, SR (for serum), ST (for stool), Fresh, Fixed, Frozen (for biopsies) ADDFrozen (for extra frozen biopsies when the fresh specimen is not available). Within each sample category, we can then subcategorize to include for example: for SR and ST, an aliquot number; for each biopsy, is it from the TI or AC, inflamed or not inflamed (e.g., in Figure-2(5) – patient number 003, addition frozen biopsy from the AC, not inflamed). For the machine-readable barcode ID B2, we cannot use 2D barcode formats [10](i.e., PDF417, Datamatrix code, QR code, etc.) to convert the B1 to B2 directly due to the printing quality of the label printer we selected (DYMO LabelWriter 450) and size of the smallest sample tube (1.5ml cryovials) used in the study. Thus, we implemented a simplified B2 that only represents pure digit numbers in EAN8 format [10]: B2 = {y1, y2, y3, y4}, where y1 is a one-digit number to represent the type of the patient, y2 is the three-digit number that represents patient ID as x2 does, y3 is a two-digit number from a static dictionary of (sampleCategory_ID, y3), y4 is the customized checksum numbers.
Both the printer app (Figure-2(1)) and the data entry app (Figure-2(2)) have a webcam feature, which transforms B2 to B1, so the EAN8 format barcode B2 is not shown in both apps explicitly. Similarly, if users use a scanner to scan the barcode B2 in both apps, they will automatically translate B2 into B1.
2.2. Design criteria 2: Tracking specimen status in longitudinal manner.
At the time of barcode printing, users cannot always foresee a patient’s sample collection status: i.e., some patients will not be able to provide enough blood for both DNA and serum sample collection; the endoscopist will not be able to access the TI at the time of colonoscopy in some patients; or recent stool sample collection is temporarily unavailable due to the COVID-19 pandemic. The REDCap arm is a construct that allows the data entry events group into a sequence. The Arm 1 and Arm 2 in Figure 3 are a static form design, which means the patient’s data entry is fixed. When giving a barcode, it is hard to track when the sample is printed, scanned, stored, distributed or destroyed in the static form, especially as sometimes we may scan a sample multiple times, distribute a sample from one lab to another, or move a sample from one location to another. Tracking such various events in REDCap is difficult because it is not a fixed longitudinal sample action. To deal with this unpredictability, we created a tuple table design on a separate arm in the REDCap, as shown in the Arm 3 of Figure 3. Some critical components of the tuple table are explained in Table 1.
Figure 3.
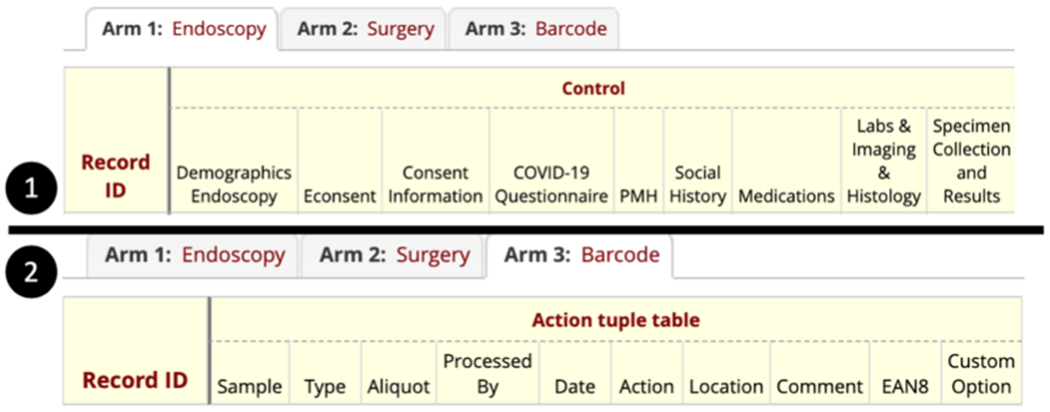
‘Arm 1’ and ‘Arm 2’ consist of four types of patient data collection with a fixed design. (1) Only one patient category’s REDCap is shown; each record collects one patient’s data. (2) The tuple table is in the separate REDCap Arm 3, which contains ten elements. Each record represents one barcode event.
Table 1.
Key components of the proposed tuple table elements.
| Tuple element (selected) | Description |
|---|---|
| Sample | The human readable barcode ID B1 |
| Type | Patient study type |
| Action | Barcode actions: Print / Re-print / Store / Destroy / Distribute or mail specimen to other lab |
| Location | Sample locations on rack->box->position in box |
| EAN8 | The machine readable barcode ID B2 |
The tuple table’s primary goal is to enable the data collection query without any fixed longitudinal time steps. The data entry app is also a Python application that is implemented to ease human data entry efforts. We provide a user-friendly interface to bulk input sample locations easily, choose which samples are distributed or processed, and destroy sample barcodes that are no longer used. All of the above operations are recorded in the patient records (Arm 1 or Arm 2 of Figure 3) and the tuple table. The data in REDCap can be exported into JSON format.
As a result, we can use a data analysis tool to query the tuple table to get some interesting results that users may care about. First, we can filter out all operations on a specified physical sample using the barcode IDs. Second, once adding more filters, we have the potential to know the sample collection status of a patient, i.e., which samples are collected, the current storage location of the sample is stored. Third, we can summarize cross patient-based statistics, i.e., get sample collection statistics of a specified sample type, or get sample collection statistics of a specified patient study category. The above functionalities are implemented in the GCA data portal dashboard (Figure-2(3)). The dashboard is a secure online web page built on an Apache HTTP server. The back end of the web page runs pandas Python library [11] scripts to analyze the to convert REDCap JSON data output.
2.3. Design criteria 3: Detect data entry inconsistency.
REDCap is a real-time, online collaboration tool; any edits that might violate the data consistency should be resolved. For instance, users may directly type a sample’s storage location in the REDCap form without using the data entry app, which means the ‘store’ action is not recorded as an event in the tuple table, and we would fail to track the specimen storage information using the tuple table. Another scenario is that users could mis-operate or duplicate operate a barcode (store a specimen that has already been marked as destroyed; destroy a barcode multiple times). To deal with the above use cases, for the data entry app, we added a background consistency check for each edit in the app when we do location synchronization (upload entries to REDCap). For the online dashboard, we provide a REDCap form consistency check that provides a ‘reminder’ that guides users to check the potential inconsistency leaks rather than automatically fixing the inconsistent entries.
2.4. Design criteria 4: how to store and share the raw collected data (i.e., imaging) and data analysis results within the groups?
With the physical sample collection of the patient, we also collect other modalities of the data. Figure 4 illustrates the data collection REDCap design except for physical sample and PHI. Some data analysis tags are currently ‘Unknown’ because they are in the planning phase. The uploading size limit is 50 megabytes per file in REDCap. Data like radiology images, histology, MxIF/RNA-FISH images, and scRNA-seq analysis usually exceed REDCap’s file uploading threshold. Hence, we integrated VUIIS CCI XNAT to REDCap to store the large files (Figure 2(6)). The XNAT aims to store MRI, CT, positron emission tomography (PET) scans, microscopy images, etc. It can also store any of other data formats as a processing resource without a hard limit for file uploading, which is suitable to store large files in the GCA project. Each file in XNAT has a unique identifier, which is stored in REDCap for reference and download.
Figure 4.

The REDCap form design for data analysis collection on each of different categories of the data.
3. VALIDATION AND RESULTS
We currently have collected 63 endoscopy patients (43 CD patients and 20 healthy control patients) and 2 CD surgery patients by December 2020. The validation focuses on design criteria 2-4. They are the basis of the implementation of the digital barcode identification, which helps prove the effectiveness of design criteria 1.
3.1. Validation 1: Tracking specimen status in longitudinal manner.
Figure 5 shows how the proposed online, secure text-based dashboard helps track physical samples via digital barcode in different statistical summaries. The dashboard is capable of illustrating: if specific specimens are collected (Figure 5(1)); the different types of specimens collection status for a specific patient (Figure 5(2)); statistics on serum/stool/DNA specimens based on each category or each patient (Figure 5(3)); statistics on biopsy specimens based on each category or location (Figure 5(4)); sample freezer location information on a specific rack, box, and position in the box ((Figure 5(6)). We have not mailed or shipped samples yet, so the demonstration of Figure 5(5) is blank.
Figure 5.
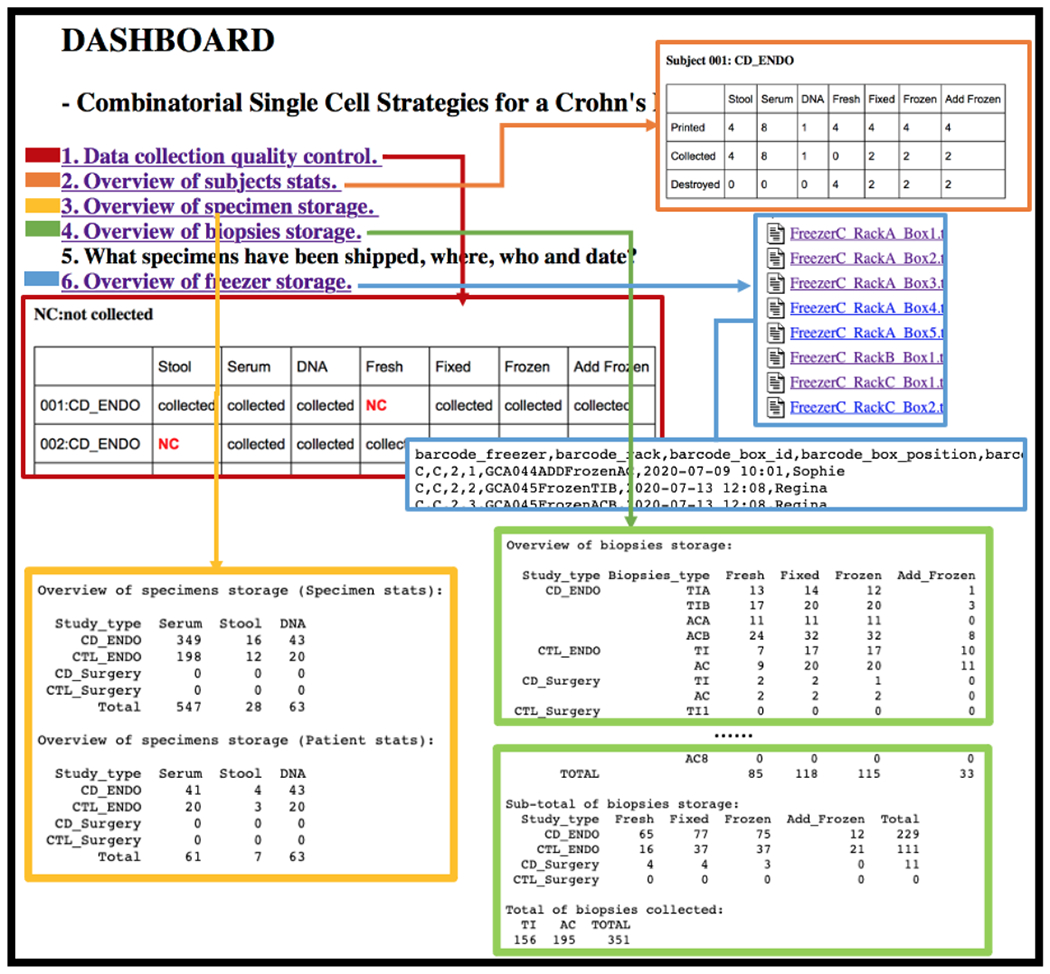
The online, secure text-based dashboard helps users maintain quality control and track the physical sample collection. Some examples of descriptive statistics are presented.
3.2. Validation 2: Detect data entry inconsistency.
The data entry inconsistency might occur when users use the data entry app or manually edit in the REDCap form. The testing sample GCA034FixedTIA is a destroyed barcode (which means the biopsies are not collected), and sample GCA034FrozenTIB is already stored in a box. We verified that when users try to mis-operate or duplicate operating on both testing samples, the app data mines the tuple table and pops up the warning messages (Figure 6(1)). Meanwhile, the dashboard online consistency check feature displays any suspicious manual edits and guides users to double-check the REDCap form (Figure 6(2)). The dashboard provides a tracking history for each specimen.
Figure-6.
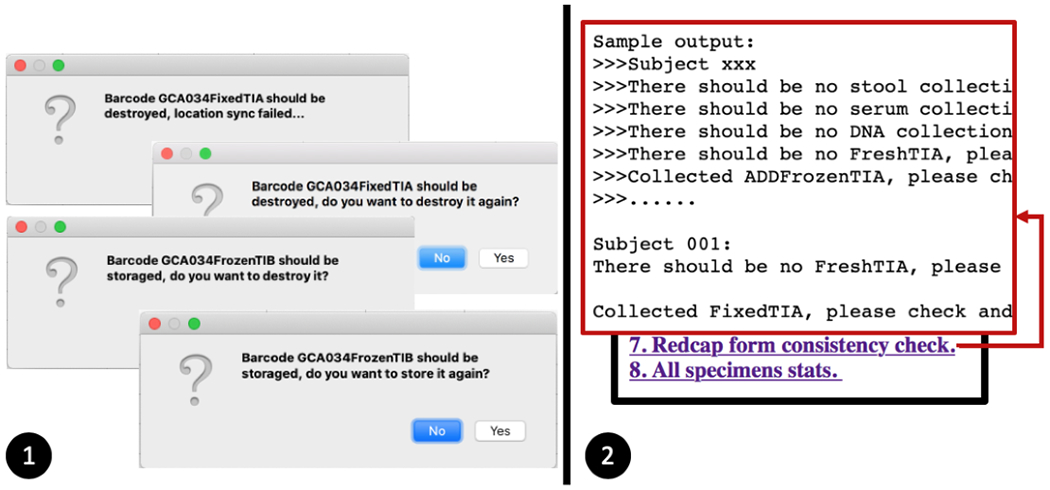
Two validation results on how to utilize tuple table to detect data entry inconsistency. (1) The data entry app’s warning messages when users try to mis-operate or duplicate operate a barcode. (2) The dashboard provides consistency check to point out the potential data entry irregularity.
3.3. Validation 3: Multi-modality data storage in the GCA data collection informatics system.
We present a summary of the types of data, the data formats, and the estimated data storage size per data category in Table 2. We ignore the data related to the text data entry in the REDCap form as ‘N/A.’ Thus, we estimate we need approximately a total of one terabyte data storage size per patient in the study.
Table 2.
Data analysis summary that the proposed GCA informatics system collects.
| Category | Description | Data format | Total Estimated Storage(GB) |
|---|---|---|---|
| PHI | With restrict access, save in Redcap | N/A | N/A |
| Clinical | Save in Redcap | N/A | N/A |
| MRI/CT analysis | 3 CT scans or 15 MRI scans | .nii.gz | 0.5 |
| Body part regression | .nii.gz | 0.5 | |
| Histology analysis | Whole slide scan | .scn, .tif | 9 |
| Histology research report, save in redcap | .csv | ≈ 0 | |
| Histology clinical report, save in redcap | ≈ 0 | ||
| Multiplex IF/RNA-FISH analysis | Multiplex IF scanning setup metadata, save in Redcap | N/A | N/A |
| Multiplex imaging files | .scn, .tif | 300 | |
| scRNA-seq multi-level analysis | Sequencing metadata, save in Redcap | N/A | N/A |
| Sequencing raw data, 6 samples with 12 fastq files | .fastq.gz | 300 | |
| DropEst pipeline | .bam, .rds.txt, .csv | 200 | |
| Cell type annotation | .csv | ≈ 0 | |
| DropKick pipeline | .h5ad | 0.02 | |
| Downstream analysis | .h5ad | 0.02 | |
| DNA | DNA VANTAGE report, save in redcap | .csv | ≈ 0 |
4. CONCLUSION AND DISCUSSION
In this work, we present an informatics data collection system for the GCA project. We provide a customized specimen digitization identification mapping scheme and deal with the challenges of tracking all specimen types, validating manual input mistakes on a large scale, and sharing organizational data across the group. We look forward to completing the ~140 endoscopy patient data collection duties and further cross-linking data analysis from cellular, histological, and anatomical to clinical data. Many human cell studies involve multi-modality data (electronic health record data, histology tissues and radiology images), such as the Human Cell Atlas[12], the Human Tumor atlas network [13] and the human protein atlas [14], rather than only focusing on single cell analysis. Our informatics system provides a promising and scalable and affordable data collection solution.
5. ACKOWLEDGEMENTS
This research was supported by The Leona M. and Harry B. Helmsley Charitable Trust grant G-1903-03793, and NSF CAREER 1452485. This study was supported in part using the resources of the Advanced Computing Center for Research and Education (ACCRE) at Vanderbilt University, Nashville, TN. This project was supported in part by the National Center for Research Resources, Grant UL1 RR024975-01, and is now at the National Center for Advancing Translational Sciences, Grant 2 UL1 TR000445-06, the National Institute of Diabetes and Digestive and Kidney Diseases, grant R01DK103831, the Department of Veterans Affairs I01BX004366, and I01CX002171. We would like to acknowledge the VUMC Digestive Disease Research Center supported by NIH grant P30DK058404. The de-identified imaging dataset(s) used for the analysis described were obtained from ImageVU, a research resource supported by the VICTR CTSA award (ULTR000445 from NCATS/NIH), Vanderbilt University Medical Center institutional funding and Patient-Centered Outcomes Research Institute (PCORI; contract CDRN-1306-04869).
REFERENCES
- [1].Baumgart DC, and Sandborn WJ, “Crohn’s disease,” The Lancet, 380(9853), 1590–1605 (2012). [DOI] [PubMed] [Google Scholar]
- [2].Dahlhamer JM, Zammitti EP, Ward BW et al. , “Prevalence of inflammatory bowel disease among adults aged≥ 18 years—United States, 2015,” Morbidity and mortality weekly report, 65(42), 1166–1169 (2016). [DOI] [PubMed] [Google Scholar]
- [3].Kotliar D, Veres A, Nagy MA et al. , “Identifying gene expression programs of cell-type identity and cellular activity with single-cell RNA-Seq,” Elife, 8, e43803 (2019). [DOI] [PMC free article] [PubMed] [Google Scholar]
- [4].Klein AM, Mazutis L, Akartuna I et al. , “Droplet barcoding for single-cell transcriptomics applied to embryonic stem cells,” Cell, 161(5), 1187–1201 (2015). [DOI] [PMC free article] [PubMed] [Google Scholar]
- [5].Wolf FA, Angerer P, and Theis FJ, “SCANPY: large-scale single-cell gene expression data analysis,” Genome biology, 19(1), 15 (2018). [DOI] [PMC free article] [PubMed] [Google Scholar]
- [6].Harris PA, Taylor R, Thielke R et al. , “Research electronic data capture (REDCap)—a metadata-driven methodology and workflow process for providing translational research informatics support,” Journal of biomedical informatics, 42(2), 377–381 (2009). [DOI] [PMC free article] [PubMed] [Google Scholar]
- [7].Griffin J, and Treanor D, “Digital pathology in clinical use: where are we now and what is holding us back?,” Histopathology, 70(1), 134–145 (2017). [DOI] [PubMed] [Google Scholar]
- [8].Yao W, Chu C-H, and Li Z, “The adoption and implementation of RFID technologies in healthcare: a literature review,” Journal of medical systems, 36(6), 3507–3525 (2012). [DOI] [PubMed] [Google Scholar]
- [9].Hartman DJ, Pantanowitz L, McHugh J et al. , “Enterprise implementation of digital pathology: feasibility, challenges, and opportunities,” Journal of digital imaging, 30(5), 555–560 (2017). [DOI] [PMC free article] [PubMed] [Google Scholar]
- [10].Yeh Y-L, You J-C, and Jong G-J, “The 2D bar-code technology applications in medical information management.” 3, 484–487. [Google Scholar]
- [11].McKinney W, “Data structures for statistical computing in python.” 445, 51–56. [Google Scholar]
- [12].Regev A, Teichmann SA, Lander ES et al. , “Science forum: the human cell atlas,” Elife, 6, e27041 (2017). [DOI] [PMC free article] [PubMed] [Google Scholar]
- [13].Rozenblatt-Rosen O, Regev A, Oberdoerffer P et al. , “The Human Tumor Atlas Network: charting tumor transitions across space and time at single-cell resolution,” Cell, 181(2), 236–249 (2020). [DOI] [PMC free article] [PubMed] [Google Scholar]
- [14].Thul PJ, and Lindskog C, “The human protein atlas: A spatial map of the human proteome,” Protein Science, 27(1), 233–244 (2018). [DOI] [PMC free article] [PubMed] [Google Scholar]


