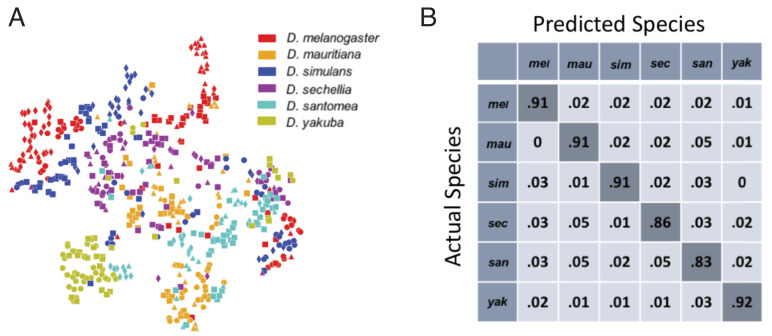
Figure 2. Classification of fly species based on behavioral repertoires.
(A) A t-SNE embedding of the behavioral repertoires shows that behavioral repertoires contain some species-specific information. Each dot represents one individual fly, with different colors representing different species and different symbols with the same color representing different strains within the same species. The distance matrix (561 by 561) used to create the embedding is the Jensen-Shannon divergence between the behavioral densities of individual flies. (B) Confusion matrix for the logistic regression with each row normalized. All the values are averaged from 100 different trials. The standard error is less than 0.01 for the diagonal elements and less than 0.005 for each of the off-diagonal elements.

