. 2021 Sep 2;10:e61806. doi: 10.7554/eLife.61806

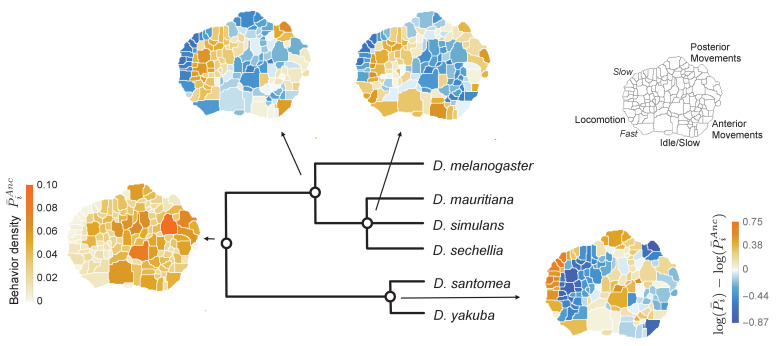
Figure 3. Reconstructed behavioral repertoires using the GLMM.

Inferred probabilities of the behavioral traits for the ancestral states are plotted at the denoted locations along the phylogeny. Except for the common ancestor, ancestral states are plotted with respect to the closest ancestor. For each behavioral trait, i, in the intermediate ancestors, we show: log(P¯i)-log(P¯iAnc), where P¯i and P¯iAnc correspond to the inferred mean behavioral trait for the given ancestor and its closest ancestor, respectively. Coarse grained behaviors corresponding to different types of movements are shown on the top right corner.

Figure 3.

Figure 3—figure supplement 1. Gelman Rubin diagnostic for model parameters inferred using MCMC.

Figure 3—figure supplement 1.

(A) Potential Scale Reduction Factor (PSRF, see Materials and methods) for the 134 ancestral behaviors inferred in the GLMM. 20 MCMC chains with different initial conditions were used. (B) PSRF for the phylogenetic covariance matrix elements corresponding to the 10% most common behaviors performed by the measured flies. (C) PSRF for the individual covariance matrix elements corresponding to the 10% most common behaviors performed by the measured flies. The PSRF values for all of these inferred parameters indicate that the MCMC chains have converged.
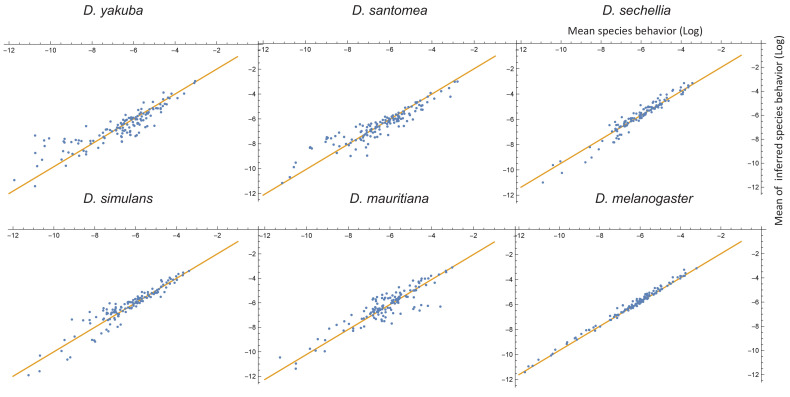
Figure 3—figure supplement 2. Comparison between measured and inferred behaviors (on a log scale) for each of the extant species.

Figure 3—figure supplement 2.

Here, each measured behavioral mean plotted against the mean obtained from the components of the MCMC samples corresponding to that particular species and behavioral mode (i.e., the inferred behavioral repertories from the GLMM). The biggest differences occur mostly in the low probability behaviors, which we expect to be more sensitive to sampling errors.
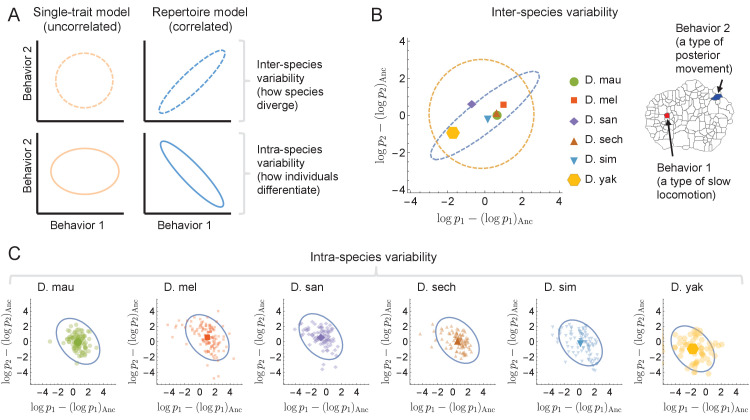
Figure 3—figure supplement 3. Comparison of the independent focused trait approach vs the repertoire approach for a pair of behaviors.

Figure 3—figure supplement 3.

(A) Schematic of the different predictions that each model provides for the probability contour lines for a pair of behaviors – uncorrelated single-trait model in orange vs. correlated full-repertoire approach in blue. By definition, the single-trait model cannot predict behavioral covariance either inter- or intra-species. (B) Behavioral traits averaged within-species (colored dots) for two specific behaviors show a positive correlation, which is explained by the full-repertoire model (in blue). Ellipses are centered at the coordinates representing the behavioral traits of the inferred ancestral state, with semi-major and semi-minor axes corresponding to the eigenvectors and values of the phylogenetic covariance matrix, restricted to the behaviors shown on the left. For comparison, the contour line inferred using the single-trait model is shown in orange (level curves at two standard deviations from the mean). (C) Behavioral traits for all individuals within a species show a negative correlation, for this particular pair of behaviors, in contrast to the positive correlation observed in the species means and predicted by the full model. Blue ellipses correspond to the contour probability levels coming from the individual covariance matrix of the full-repertoire model. Note that the predictions from the single-trait model must necessarily be uncorrelated.