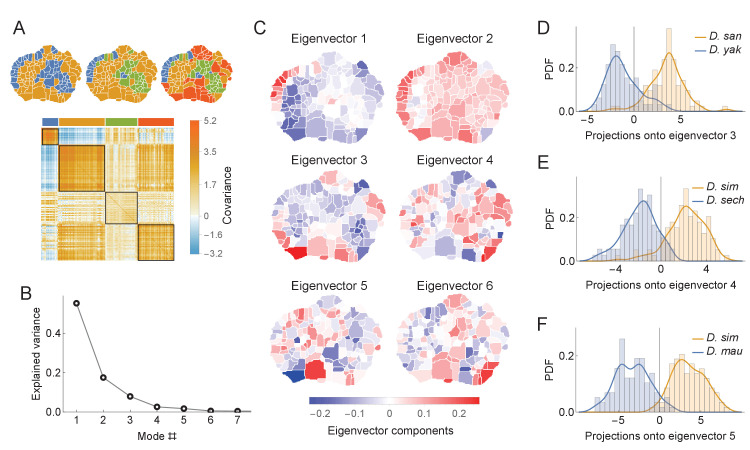
Figure 6. Phylogenetic variability and behavioral meta-traits.
(A) (top) Clustering the phylogenetic covariance matrix (using the same information-based clustering method from Figure 4), we observe that the clusters are no longer spatially contiguous. (bottom) The phylogenetic covariance matrix reordered according to four clusters (colors corresponding to the four-cluster map above). (B) Fraction of variance explained by the largest eigenvalues of the phylogenetic covariance matrix. (C) The eigenvectors corresponding to the largest six eigenvalues. (D) Distributions of the projections of individual density vectors from D. santomea and D. yakuba onto eigenvector 3. (E) Same as in D but using projections of individuals from D. sechellia and D. simulans onto eigenvector 4. (F) Same as in D but using projections of individuals from D. simulans and D. mauritiana onto eigenvector 5.

