

Abstract
The Serbian government has taken several measures to prevent the spread of COVID-19. These measures may have led to a disruption of daily life and affected food-related behaviors. This paper investigates the state of food waste management in Serbia and COVID-19’s direct effect on consumer awareness, food consumption, and food waste behaviors. The study is based on an online survey using a structured questionnaire administered in Serbian from May 13 until June 13, 2020, through the Google forms platform. A total of 1212 valid answers were collected, mainly from female, young, and high-educated people. The survey results suggested that (i) household food waste in Serbia is low and there is a positive attitude toward food waste prevention; (ii) food waste increased during the COVID-19 pandemic; (iii) consumers reduced the number of shopping trips and shopped more than usual during the pandemic. This study contributes to a better understanding of consumers’ consumption habits and attitudes toward food waste to prevent and reduce it.
Keywords: COVID-19, Food behavior, Food consumption, Food shopping, Food waste, Serbia, Balkans
Introduction
The food system faces different challenges in its transition toward sustainability, such as food insecurity (FAO et al. 2020) and food contamination (Pejin et al. 2012; WHO 2015). Nevertheless, in the context of increasing food demand due to the global population growth and extending pressures on natural resources, food loss and waste (FLW) is a growing global issue (FAO 2019, 2011; HLPE 2014). Food loss and waste (FLW) occur throughout the entire food supply chain, from harvesting to consumption. Food loss happens upstream of the food chain (e.g., harvesting, transport, storage, and processing), while food waste refers to food lost at retail and consumption levels (FAO 2011, 2019; HLPE 2014). According to FAO (2019), “Food waste is the decrease in the quantity or quality of food resulting from decisions and actions by retailers, food services, and consumers.” Food wastage at the household level is “the food brought home or prepared at home but not consumed” (Grandhi and Appaiah Singh 2016, p. 474).
Food waste is influenced by several factors categorized into behavioral (e.g., planning and organizational practices, shopping, and storing practices, etc.), personal (e.g., level of education, knowledge, and awareness, etc.), product (e.g., food and package properties), and societal factors (e.g., incomes, politics of food prices, etc.) (Roodhuyzen et al. 2017; El Bilali and Ben Hassen 2020). It has also been confirmed that food waste increase when consumers shop from large supermarkets rather than from small shops or local markets (Jörissen et al. 2015). These factors influence consumer behavior in a specific way and vary from one person to another, from one era to another (rural/urban), or from country to another. Although food waste is a global concern, the scope and nature of food waste differ substantially between countries (Roodhuyzen et al. 2017). Additionally, food waste is mainly the result of poor food-management routines and behavior. Food-related behaviors and routines such as planning, purchasing, storing, cooking, eating, and managing leftovers, significantly affect food waste performance (Schanes et al. 2018). Reducing FW is critical for economic, environmental, and social reasons, and it is imperative to have a greater comprehension of how the COVID-19 outbreak has altered household consumption, as well as FW patterns and behavior (WRAP 2020).
The COVID-19 pandemic has significantly disturbed household food buying, altered shopping habits, and affected food waste. Several voices have come forth to warn of COVID-19’s destabilizing effect on agri-food systems and food consumption (Ben Hassen et al. 2020). Undoubtedly, due to the strict measures imposed by governments to mitigate the SARS-CoV-2 virus spread, food management and consumption patterns shifted drastically (Principato et al. 2020). The crisis caused by the COVID-19 outbreak has changed global waste generation mechanisms, resulting in unforeseen changes in waste composition and quantity (Kalina and Tilley 2020), especially in the case of food waste (Sharma et al. 2020). Household food waste generation can either increase due to panic buying or decrease if consumers better use stored food and leftovers (Aldaco et al. 2020). Indeed, on the one hand, at the onset of the outbreak, customers concentrated on stocking food to mitigate the risk of future shortages. Many reports of panic buying of nonperishable food products (e.g., pasta, rice, canned goods, flour, and frozen food) have been recorded worldwide (Baker et al. 2020). Panic buying increased household food waste generation, especially for perishable products, due to storage limitations, bad cooking habits, or overcooking (Cosgrove et al. 2021; Cranfield 2020).
On the other hand, the COVID-19 outbreak has created unanticipated possibilities for sustainable food production and consumption (Sarkis et al. 2020). Many consumers have embraced thriftiness and cut down on food waste during the coronavirus crisis. Several researches, in Italy (Principato et al. 2020), the USA (Babbitt et al. 2021; Rodgers et al. 2021), the UK (Waste and Resources Action Program (WRAP) 2020), Russia (Ben Hassen et al. 2021a), Japan (Qian et al. 2020), Tunisia (Jribi et al. 2020), Lebanon (Ben Hassen et al. 2021b), Mexico (Vargas-Lopez et al. 2021), or Qatar (Ben Hassen et al. 2020) revealed that household food waste decreased. In fact, during the pandemic, households adopted a wide range of positive food management strategies, such as more pre-shop planning (e.g., making a list), better in-home food storage, and creative approaches to cooking/prep (e.g., batch cooking and using up leftovers). Overall, the COVID-19 pandemic improved food shopping performance and prompted a favorable behavioral shift vis-à-vis food waste (Jribi et al. 2020). Adopting these strategies is motivated by several factors: avoiding going to the shops, since shopping in a grocery store has a perceived risk; saving money; not wanting to run out of food, and having more time. Also, it might be because people stayed inside for more extended periods, allowing them to devote more time to kitchen chores without feeling rushed (Vargas-Lopez et al. 2021). However, as Jribi et al. (2020) highlighted, consumer behavior changes toward food waste are likely to be influenced more by the socioeconomic context of the COVID-19 lockdown (i.e., food availability, limited mobility, and loss of income) than by a pro-environmental concern.
As of May 15, 2021, Serbia has confirmed 705,185 confirmed cases of COVID-19 with 6646 deaths (WHO 2021). On March 6, 2020, Serbia confirmed its first case of COVID-19 (The Government of the Republic of Serbia 2020). Consequently, a state of emergency was declared on March 15. Later, Serbia adopted several containment measures to prevent the spread of COVID-19: nationwide lockdown, closure of nonessential business, closure of school and universities, remote work, etc. (Šantić and Antić 2020). However, these measures may have affected attitudes and behaviors related to food, such as food waste. Also, after several years of substantial growth, the Serbian economy had a recession of 3% in 2020 (World Bank 2020). Overall, Serbia is recognized as a medium food waste polluter when it comes to food waste quantities. However, there is no accurate information or official statistics on how much food is wasted in Serbia. According to the National Geographic Srbija (2020), 35 kg of food is thrown per capita per year. Djekic et al. (2019) suggest that, annually, Serbian households discard 198,712 tons of food waste associated with 687,346 tons of CO2 emission. Overall, research on food waste in Serbia is scarce. Since the COVID-19 infection is new and we do not know how long it will last, there is a need for information and knowledge to assess its impacts on food consumption patterns. In this context, the present paper investigates the state of food waste in Serbia.
Accordingly, the present paper sought to achieve three major objectives: 1) to investigate the state of food waste management in Serbia and test the hypothesis that household food waste in Serbia is low and there is a positive attitude toward food waste prevention (H1); 2) To investigate the immediate impact of COVID-19 on consumer awareness and behaviors related to food waste, and to test the hypothesis that consumers have increased their food waste during the pandemic (H2); and 3) to test the hypothesis that decreased grocery stores trips and increased stockpiling and panic buying, increased food waste during the COVID-19 pandemic (H3). Before we expose the results, we present our methodology.
Materials and methods
A sample of n = 1212 adults from Serbia completed a computer-assisted web interview (CAWI) online survey between May 13 and June 13, 2020, through the Google forms platform. The study targets the general adult population (age >18 years) in Serbia. We used the non-probability sampling method. The study adopted the snowball-sampling technique, and participants were asked to roll out the online questionnaire to their acquaintances and relatives. The survey administered in Serbian was disseminated through various communication channels such as social media (Twitter and LinkedIn) and email. Before participating in the study, all participants provided their digital informed consent for data sharing and privacy policy. The questionnaire consisted of 30 one-option and multiple choices questions structured in 8 different sections: 1) Socio-demographics; 2) Food purchase behavior and household food expenditure estimation; 3) Knowledge of food labeling information; 4) Attitudes toward food waste; 5) Extent of household food waste; 6) Economic value of household food waste; 7) Information needed to reduce food waste; 8) Food waste and shopping behavior during the COVID-19 lockdown. To assure the validity and reliability of the survey data, the questionnaire was pretested with 33 respondents.
The data were downloaded into the Statistical Package for Social Sciences (SPSS) version 25.0 for analysis. Data were analyzed using descriptive statistics (frequency and percentage) to summarize data and a nonparametric Chi-square (χ2) test was applied in the inferential part. Chi-square tests of independence were used to test the association with the demographic variables. In addition, Pearson’s coefficient of contingency was applied to examine the relationship between some categorical variables such as throwing away uneaten food and shopping frequency.
Results
Respondents’ profile
According to Table 1, 68.56% of the respondents are women and 43.84% are married with children. Regarding occupation status, 73.68% of the participants were working (full-time or part-time) and 18.81% were students. In addition, most of the respondents were in middle age (47.35% of them were 36 to 55 years old) and 30.69% of the households have four persons. The sample was highly educated, as 80.61% of the respondents possessed a master’s or a Ph.D.
Table 1.
Sociodemographic characteristics of the participants (n = 1212)
| Variable | Group/item | Frequency | % of respondents |
|---|---|---|---|
| Gender | Female | 831 | 68.56 |
| Male | 381 | 31.44 | |
| Age (years) | 18 to 25 | 232 | 19.14 |
| 26 to 35 | 276 | 22.77 | |
| 36 to 55 | 574 | 47.35 | |
| 56 and more | 130 | 10.73 | |
| Education level | Primary and below | 2 | 0.17 |
| Secondary | 204 | 16.83 | |
| Diploma/bachelor | 29 | 2.39 | |
| Master degree | 685 | 56.52 | |
| Higher education (PhD) | 292 | 24.09 | |
| Occupation | In paid work (full time or part time) | 893 | 73.68 |
| Student | 228 | 18.81 | |
| Unemployed | 63 | 5.20 | |
| Home duties | 11 | 0.91 | |
| Retired/age pensioner | 17 | 1.40 | |
| Household situation | Single person household | 128 | 11.02 |
| Living with parents | 331 | 28.51 | |
| Married without children | 168 | 14.47 | |
| Married with children | 509 | 43.84 | |
| Shared household, non-related | 25 | 2.15 | |
| Household members (number of people) | 1 | 123 | 10.15 |
| 2 | 222 | 18.32 | |
| 3 | 291 | 24.01 | |
| 4 | 372 | 30.69 | |
| 5 | 146 | 12.05 | |
| 6 and more | 58 | 4.8 |
Food shopping behaviors
Table 2 provides detailed results about shopping behaviors (place of shopping, expenditure, shopping frequency, etc.). The results show that most of the respondents (59.5%) were shopping from hypermarkets and supermarkets. However, 21.9% of the respondents remained loyal to small shops due to their proximity to their residence. Meanwhile, 15.5% of the surveyed households buy food at local markets and a small percentage (3.1%) buy directly from producers. There were significant associations between the place for buying food and age (χ2 = 47.77, p < 0.01), occupation (χ2 = 36.53, p < 0.01), and household composition (χ2 = 28.95, p < 0.01) (Table 2).
Table 2.
Food shopping behavior (n = 1212)
| Variables | Frequency | Percentage | Gender | Age | Education | Occupation |
Household composition |
|||||
|---|---|---|---|---|---|---|---|---|---|---|---|---|
| χ2 | p-value | χ2 | p-value | χ2 | p-value | χ2 |
p- value |
χ2 | p-value | |||
| Market place | 1.42 | 0.700 | 47.77** | 0.000 | 20.03 | 0.067 | 36.53** | 0.000 | 28.95** | 0.004 | ||
| Hypermarket/supermarket | 721 | 59.49 | ||||||||||
| Mini-market/small market | 265 | 21.86 | ||||||||||
| At the market | 188 | 15.51 | ||||||||||
| Directly from producers | 38 | 3.14 | ||||||||||
| Shopping frequency | 9.71 | 0.084 | 32.00* | 0.043 | 23.53 | 0.264 | 37.16* | 0.011 | 43.20** | 0.002 | ||
| Every day | 361 | 29.81 | ||||||||||
| Once every 2 days | 291 | 24.03 | ||||||||||
| Twice a week | 345 | 28.49 | ||||||||||
| Once a week | 163 | 13.46 | ||||||||||
| Every 2 weeks | 42 | 3.47 | ||||||||||
| Once a month | 9 | 0.74 | ||||||||||
| Household food expenditure per month | 7.62 | 0.106 | 78.37** | 0.000 | 11.45 | 0.781 | 70.66** | 0.000 | 132.55** | 0.000 | ||
| Up to 50 Euros | 37 | 3.07 | ||||||||||
| 51–100 Euros | 111 | 9.20 | ||||||||||
| 101–150 Euros | 286 | 23.70 | ||||||||||
| 151–300 Euros | 483 | 40.02 | ||||||||||
| More than 300 Euros | 290 | 24.03 | ||||||||||
| Use of a shopping list | 5.24 | 0.073 | 12.89 | 0.116 | 7.99 | 0.435 | 5.85 | 0.664 | 24.27** | 0.002 | ||
| Yes | 457 | 37.71 | ||||||||||
| No | 207 | 17.08 | ||||||||||
| Sometimes | 548 | 45.21 | ||||||||||
| Attraction to special offers | 3.72 | 0.155 | 38.25** | 0.000 | 11.05 | 0.199 | 17.47* | 0.026 | 27.64** | 0.001 | ||
| Yes | 536 | 44.22 | ||||||||||
| No | 146 | 12.05 | ||||||||||
| Sometimes | 530 | 43.73 | ||||||||||
| **p < 0.01, *p < 0.05 | ||||||||||||
Regarding shopping frequency, consumers in Serbia buy food relatively often. Nearly a third of households (29.8%) do this every day and 28.49% buy food twice a week. Overall, only 5% buy food less than once a week. The frequency of food purchases was significantly associated with household composition, age, and occupation (Table 2).
Moreover, 40% of the households usually spend 151–300 euros a week on food and 24% spend more than 300 euros. Meanwhile, 36% of households spend weekly less than 150 euros on food. There was also a highly significant association between the value of purchased food and age (χ2 = 78.37, p < 0.05), occupation (χ2 = 70.66, p < 0.05), and household composition (χ2 = 132.55, p < 0.01).
Further, the shopping list is used by 37.7% of the participants and another 45.2% use it occasionally. Using a shopping list is significantly associated with the household composition (χ2 = 24.27, p < 0.01). Finally, special promotions and discounts encourage 44% of the participants to buy and 43.7% occasionally respond to them. Significant associations were found between the attitude toward special promotions and respondent’s age (χ2 = 38.25, p < 0.01), household composition (χ2 = 27.64, p < 0.01), and occupation (χ2 = 17.47, p < 0.05) (Table 2).
Quantities, types, and causes of food waste
According to Table 3, 46.04% of the respondents stated that they did not throw away food, 22.28% threw away less than 250 g per week, and 21.2% threw between 250 and 500 g per week. A significant amount of food, over 500 g per week, was thrown away by 10.48% of the participants. At the same time, there was a highly significant association between the amount of food thrown away and gender (χ2 = 19.59, p < 0.01) and household composition (χ2 = 44.75, p < 0.01) (Table 3).
Table 3.
Amount and economic value of food waste (n = 1212)
| Respondents | Frequency | Percentage | Gender | Age | Education | Occupation |
Household composition |
|||||
|---|---|---|---|---|---|---|---|---|---|---|---|---|
| χ2 | p-value | χ2 | p-value | χ2 | p-value | χ2 | p-value | χ2 | p-value | |||
|
Consumable food throws away per week |
19.59** | 0.001 | 20.32 | 0.438 | 15.79 | 0.729 | 16.21 | 0.704 | 44.75** | 0.001 | ||
| I do not throw away | 558 | 46.04 | ||||||||||
| Less than 250 gr | 270 | 22.28 | ||||||||||
| Between 250 and 500 g | 257 | 21.20 | ||||||||||
| Between 500 g and 1 kg | 87 | 7.18 | ||||||||||
| Between 1 kg and 2 kg | 28 | 2.31 | ||||||||||
| More than 2 kg | 12 | 0.99 | ||||||||||
| Economic value of food wasted per month | 8.84 | 0.032* | 14.56 | 0.266 | 8.99 | 0.704 | 17.13 | 0.145 | 31.08** | 0.002 | ||
| Less than 5 euros | 435 | 36.04 | ||||||||||
| 5–25 euros | 635 | 52.61 | ||||||||||
| 25–50 euros | 109 | 9.03 | ||||||||||
| More than 50 euros | 28 | 2.32 | ||||||||||
| **p < 0.01, *p < 0.05 | ||||||||||||
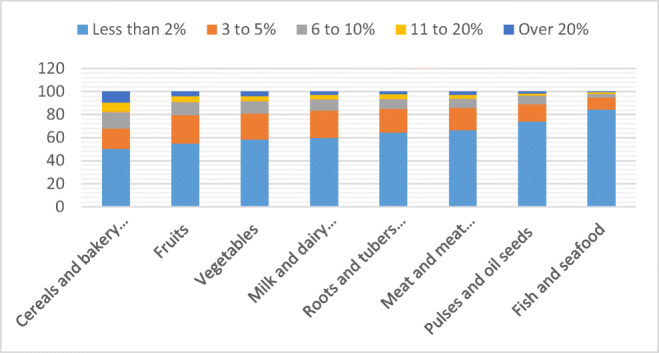
As shown in figure 1, household food waste is moderate for all food groups. In addition, the results reveal that the most wasted food groups were cereals and bakery products, fruits, and vegetables. The least wasted food groups were fish and seafood, pulses and oilseeds, as well as meat and meat products.
Fig. 1.
Estimation of household waste by product group (percentage)
Regarding the economic value of food waste, 36.04% of the participants throw away less than 5 euros worth of food per month, 52.61% between 5 and 25 euros, and 11% throw away more than 25 euros. The economic value of the wasted food was significantly associated with the household composition (χ2 = 31.08, p < 0.01) and gender (χ2 = 8.84, p < 0.05) (Table 3).
Further, shopping frequency and household food expenditure per month impacted some food waste-related behaviors such as cooking a main meal from main raw ingredients and frequency of throwing away leftovers (Table 4).
Table 4.
Impact of shopping frequency and food expenditure on some food waste behaviors (n = 1212)
| Variables | Shopping frequency |
Household food expenditure per month |
||
|---|---|---|---|---|
| Ca | p-value | Ca | p-value | |
| Throwing away uneaten food | 0.173 | 0.01* | 0.155 | 0.021* |
| Frequency of throwing away leftovers | 0.149 | 0.03* | 0.147 | 0.009** |
| Cooking a main meal from main raw ingredients | 0.178 | 0.006** | 0.217 | 0.000** |
| Eating a meal leftover from a previous day | 0.109 | 0.814 | 0.110 | 0.55 |
| Eating at a restaurant | 0.117 | 0.675 | 0.141 | 0.090 |
|
**p < 0.01, *p < 0.05 aPearson’s coefficient of contingency |
||||
Regarding knowledge of expiry time and labeling (Table 5), most of the respondents do not have the proper knowledge about the most used types of labels, namely “use by” and “best before” 1. Indeed, regarding the label “use-by,” only 49% of the respondents know that food must be eaten or thrown away by this date. Only 22.35% of the respondents know that with the label “best before,” food is still safe to eat after this date if it has not been damaged or deteriorated. A significant association exists between the knowledge about the label “use by” and household composition (χ2 = 25.75, p < 0.01) and between the knowledge about the label “best before” and gender (χ2 = 10.98, p < 0.01). For both labels, there is a significant association with age (Table 5).
Table 5.
Knowledge about food labeling (n = 1212)
| Variable | Frequency | Percentage | Gender | Age | Education | Occupation |
Household composition |
|||||
|---|---|---|---|---|---|---|---|---|---|---|---|---|
| χ2 | p-value | χ2 | p-value | χ2 | p-value | χ2 | p-value | χ2 | p-value | |||
| Knowledge of labeling (use by) | 2.06 | 0.358 | 19.40* | 0.013 | 9.22 | 0.324 | 13.56 | 0.094 | 25.77** | 0.001 | ||
| Foods must be eaten or thrown away by this date | 585 | 48.99 | ||||||||||
| Foods are still safe to eat after this date as long as they are not damaged, deteriorated, or perished | 558 | 46.73 | ||||||||||
| Foods must be sold at a discount after this date | 51 | 4.27 | ||||||||||
| Knowledge of labeling (best before) | 10.98** | 0.004 | 16.36* | 0.038 | 13.62 | 0.092 | 7.16 | 0.519 | 10.37 | 0.240 | ||
| Foods must be eaten or thrown away by this date | 892 | 74.40 | ||||||||||
| Foods are still safe to eat after this date as long as they are not damaged, deteriorated, or perished | 268 | 22.35 | ||||||||||
| Foods must be sold at a discount after this date | 39 | 3.25 | ||||||||||
| **p < 0.01, *p < 0.05 | ||||||||||||
Regarding the attitude toward food waste, a high percentage of the participants are concerned about food waste (89.44%), with significant associations with age (χ2 = 37.45, p < 0.01), occupation (χ2 = 28.43, p < 0.01), and household composition (χ2 = 53.98, p < 0.01). Moreover, 60% of the sample throw “almost nothing” and “very little” uneaten food. (Table 6). In addition, the population in Serbia shows moderation in the frequency of food wastage because most respondents (63%) throw food less than once a week and 30% more often. Household size (χ2 = 29.6, p < 0.01) had a significant association with this variable (Table 6).
Table 6.
Attitude toward food waste (n = 1212)
| Variables | Frequency | Percentage | Gender | Age | Education | Occupation | Household composition | |||||
|---|---|---|---|---|---|---|---|---|---|---|---|---|
| χ2 | p-value | χ2 | p-value | χ2 | p-value | χ2 | p-value | χ2 | p-value | |||
| Self-description | 5.12 | 0.163 | 37.45** | 0.000 | 10.53 | 0.570 | 28.43** | 0.005 | 53.98** | 0.000 | ||
| I worry about food waste, and I try to avoid it whenever I can | 1084 | 89.44 | ||||||||||
| I am aware of the problems associated with food waste, but I do not think I will change my behavior in the near future | 100 | 8.25 | ||||||||||
| I was interested in the issue of food waste in the past, but now I do not care | 5 | 0.41 | ||||||||||
| I do not consider food waste as a crucial problem | 23 | 1.90 | ||||||||||
| Throwing away uneaten food | 0.00 | 3.13 | 0.537 | 12.17 | 0.732 | 29.94* | 0.018 | 16.03 | 0.451 | 26.13 | 0.052 | |
| Much more than it should | 56 | 4.62 | ||||||||||
| More than it should | 149 | 12.29 | ||||||||||
| A reasonable amount | 280 | 23.10 | ||||||||||
| Very little | 496 | 40.92 | ||||||||||
| Almost nothing | 231 | 19.06 | ||||||||||
| Frequency of throwing away leftovers | 0.00 | 3.68 | 0.299 | 11.49 | 0.487 | 7.84 | 0.797 | 20.68 | 0.055 | 29.60** | 0.003 | |
| Never | 81 | 6.68 | ||||||||||
| Less than one time a week | 765 | 63.12 | ||||||||||
| From 1 to 2 times a week | 286 | 23.60 | ||||||||||
| More than twice a week | 80 | 6.60 | ||||||||||
| Cooking a main meal from main raw ingredients | 22.82** | 0.000 | 26.16 | 0.052 | 13.76 | 0.617 | 32.18** | 0.009 | 118.00** | 0.000 | ||
| Never | 11 | 0.91 | ||||||||||
| Less than twice a week | 188 | 15.59 | ||||||||||
| Three to six times a week | 861 | 71.39 | ||||||||||
| Seven to ten times a week | 109 | 9.04 | ||||||||||
| More than ten times a week | 37 | 3.07 | ||||||||||
| Eating a meal leftover from a previous day | 2.04 | 0.728 | 24.30 | 0.083 | 14.58 | 0.556 | 15.74 | 0.471 | 49.55** | 0.000 | ||
| Never | 38 | 3.18 | ||||||||||
| Less than twice a week | 767 | 64.13 | ||||||||||
| Three to six times a week | 367 | 30.69 | ||||||||||
| Seven to ten times a week | 17 | 1.42 | ||||||||||
| More than ten times a week | 7 | 0.59 | ||||||||||
| Eating at a restaurant | 15.58** | 0.004 | 41.41** | 0.000 | 26.30 | 0.050 | 28.45* | 0.028 | 97.71** | 0.000 | ||
| Never | 340 | 28.50 | ||||||||||
| Less than twice a week | 721 | 60.44 | ||||||||||
| 3 to 6 times a week | 104 | 8.72 | ||||||||||
| 7 to 10 times a week | 19 | 1.59 | ||||||||||
| More than 10 times a week | 9 | 0.75 | ||||||||||
| Using ready-made meals | 11.20* | 0.024 | 18.89 | 0.274 | 8.15 | 0.944 | 59.94** | 0.000 | 54.75** | 0.000 | ||
| Never | 712 | 59.78 | ||||||||||
| Less than twice a week | 422 | 35.43 | ||||||||||
| Three to 6 times a week | 46 | 3.86 | ||||||||||
| 7 to 10 times a week | 9 | 0.76 | ||||||||||
| More than 10 times a week | 2 | 0.17 | ||||||||||
| **p < 0.01, *p < 0.05 | ||||||||||||
Further, the population in Serbia eats a lot at home. Only 1% of our cohort does not cook the main meal at home, and 99% do it with varying frequency. Around 10% of the respondents do it every day, and 71% three to six times a week. Gender, occupation, and household composition are significantly associated with cooking (Table 6). Reducing food waste is influenced by the fact that many households eat leftovers from the previous day several times a week (3–6 times, 30.7%; and less than twice, an additional 64.1%). As expected, the size of the household had a highly significant effect on this practice (χ2 = 49.55, p < 0.01) (Table 6).
Contrary to those who cook, a small percentage of our cohort eat in restaurants, 28.5% never do it and 0.75% do it more than ten times a week. The majority of the population is in the “golden mean” and eats less than twice a week in restaurants (60%) or more often (about 11%). Gender, age, and household composition (p = 0.000) have highly significant interactions with going to restaurants, and occupation also has a significant influence at p < 0.05 (Table 6).
Change in consumer food habits during the COVID-19 pandemic
Since the survey was conducted during the pandemic, a special group of questions was dedicated to the changes in food consumption, shopping, and waste, during the outbreak and psychological pressure due to the risk of SARS-CoV-2 virus infection (Table 7).
Table 7.
Changes in food purchase and wastage behavior during the outbreak of COVID-19 and lockdown (n = 1212)
| Item | Frequency | Percentage | Gender | Age | Education | Occupation | Household composition | |||||
|---|---|---|---|---|---|---|---|---|---|---|---|---|
| χ2 |
p- value |
χ2 | p-value | χ2 | p-value | χ2 | p-value | χ2 |
p- value |
|||
| What has changed in your shopping behavior during the outbreak of COVID-19 and lockdown? | 5.08 | 0.079 | 19.63 | 0.012 | 12.11 | 0.15 | 9.47 | 0.304 | 8.00 | 0.43 | ||
| I buy online | 60 | 5.0 | ||||||||||
| I rarely go shopping | 444 | 36.9 | ||||||||||
| I’m going shopping like I used to | 699 | 58.1 | ||||||||||
| What has changed in the extent of your purchase during the outbreak of COVID-19 and lockdown?* | 2.82 | 0.58 | 18.85 | 0.28 | 34.39 | 0.005 | 26.58 | 0.046 | 8.72 | 0.92 | ||
| I buy a lot less than usual | 14 | 1.2 | ||||||||||
| I buy less than usual | 86 | 7.1 | ||||||||||
| I buy as same as usual | 746 | 61.6 | ||||||||||
| I buy more than usual | 298 | 24.6 | ||||||||||
| I buy a lot more than usual | 67 | 5.5 | ||||||||||
| How has your food wastage changed during the outbreak of COVID-19 and lockdown?** | 11.27 | 0.24 | 31.18 | 0.013 | 14.81 | 0.54 | 15.21 | 0.51 | 31.35 | 0.12 | ||
| It has become much less | 23 | 1.9 | ||||||||||
| Less | 75 | 6.2 | ||||||||||
| Has not changed | 758 | 62.5 | ||||||||||
| More | 324 | 26.7 | ||||||||||
| Much more | 32 | 2.6 | ||||||||||
*Scale: I buy a lot less than usual = 1; I buy less than usual = 2; I buy as same as usual = 3; I buy more than usual = 4; I buy a lot more than usual = 5.
**Scale: It has become much less = 1; less = 2; has not changed = 3; more = 4; much more = 5
Slightly more than a third of respondents go shopping less often than before. Furthermore, approximately one-third of consumers buy more food than usual (24.6% more and 5.5% much more), which might denote panic buying and food stockpiling behaviors among Serbian consumers following the outbreak of COVID-19. This behavior has undoubtedly been influenced by limited movement and panic over food shortages. Approximately proportional to the increase in food supplies, the quantities of food thrown away also increased. During the COVID-19 outbreak and lockdown, 26.7% of the respondents confirmed throwing more food and only 8.1% threw less or much less.
Discussion
This paper investigated the state of food waste management in Serbia and the immediate impact of the COVID-19 pandemic on Serbian consumer awareness, attitudes, and behaviors related to food consumption, food shopping, and food waste. The research highlighted several key consumer trends that are currently shaping food consumption habits, food waste patterns as well as food purchasing behavior in Serbia.
First, in Serbia, food is mainly bought in hyper/supermarkets, as in most countries in the Western Balkans region (Berjan et al. 2019; Bogevska et al. 2020; Preka et al. 2020), because supermarkets have become dominant in global food supply chains (Machado et al. 2017) and “buying in this type of store has an element of pleasure” (Farhangmehr et al. 2000). The place of purchase of food affects the individual purchased quantities of food. Regarding buying frequency, more than half of our cohort goes shopping every two days, which certainly affects the amount of food thrown away. Rationality in shopping can be achieved by following a pre-prepared list, but only about a third of the participants do it. Moreover, we noticed some differences in sociodemographic factors, such as the value of purchased food, age, occupation, and household composition. Undeniably, as observed in Japan by Qian et al. (2020), larger families and younger people tend to purchase excessive food. Households with children are more likely to buy more food than single-person households or couples without children. Also, older individuals have a greater awareness of household food waste and consequently buy less food than younger adults. Individuals who are 65 or older have been shown to engage in food waste-reducing practices such as meal preparation in advance and having a greater understanding of food waste than younger adults (Quested et al. 2013). Also, the difference in occupation implies variance of income and lifestyle. Individuals in paid work (full-time or part-time) have more income and consequently tend to buy more food than students, unemployed, etc.
Second, consistent with our hypothesis H1, the results showed that household food waste in Serbia is low, as in most developing countries in the Balkan region (Berjan et al. 2019; Bogevska et al. 2020; Vaško et al. 2020; Yildirim et al. 2016) and less than what Djekic et al. (2019) determined for Serbia in 2019. FW in Serbia is significantly lower than in developed countries [e.g., from 21% (Gunders 2012) to 30% (Yu and Jaenicke 2020) in the US, 22% in the UK (WRAP 2020), and 21–35% in the EU (Caldeira et al. 2019)], taking into account the limitations regarding different methodologies used for FW calculations (Bräutigam et al. 2014) and that there are differences between studies and in the reliability of data (Corrado and Sala 2018). Further, the most wasted food groups were cereals and bakery products, fruits, and vegetables. Due to their specific physiological and microbiological characteristics, fruits and vegetables are highly perishable products that can end up in the bin if they are not adequately preserved. Because it is susceptible to stalling and spoiling, consumers find that old bread is less attractive than fresh. These results confirm those observed in Serbia by Djekic et al. (2019) and other European countries such as UK (Quested et al. 2011) and Switzerland (Visschers et al. 2016).
Third, most participants cook meals from fresh ingredients several times a week and have developed cooking skills. This contributes to harmonizing the size of prepared meals to the household’s size and reducing the ingredients’ wastage. In addition, it is a common practice in Serbia to store and eat leftovers during the next few days. This habit might probably be driven more by socioeconomic factors than by a pro-environmental concern. A similar practice has been observed in other low-income countries such as Egypt (Elmenofi et al. 2015), Morocco (Abouabdillah et al. 2015), Lebanon (Charbel et al. 2016), Tunisia (Sassi et al. 2016), Montenegro (Berjan et al. 2019), Bosnia and Herzegovina (Vaško et al. 2020), and North Macedonia (Bogevska et al. 2020). Regarding food labeling knowledge, we observed confusion about the interpretation of food labels. This is not a unique case, and consumer confusion has been found in other studies (Secondi 2019; Zielińska et al. 2020), as well as calls on national regulations to reconcile food waste and food safety in labeling packaged food (Newsome et al. 2014).
Finally, a high percentage of participants are concerned about food waste (89%) and their actions regarding food handling and food waste amount confirm this concern. However, there is room for practices improving in food management, especially in educational campaigns for the correct interpretation of labels and better planning of procurement and storage of food to prevent its deterioration. Also, the use of food waste and leftovers for composting and energy production are practices that should be used more in the future, as is already the case in more developed countries. These are many social norms that lead to behavior changes toward food waste, as Stöckli et al. (2018) recommended.
The COVID-19 pandemic led consumers during the outbreak and lockdown to go shopping less often, buy larger quantities of food, and, consequently, throw away more food than before the pandemic, which confirms our hypothesis H2. Indeed, as observed in several countries, consumers decreased the frequency of shopping trips and were shopping fewer than usual, spending more on each trip to limit supermarket visits, thereby controlling their perceived risk of exposure to COVID-19 (Cranfield 2020). In Serbia, leading retail chains witnessed a 20% increase in household consumption. Also, during March 2020, the opening hours of supermarkets in Serbia were reduced to contain the spread of the SARS-CoV-2 virus (Danas 2020). Accordingly, consistent with our hypothesis H3, the increase of household food waste in Serbia during the pandemic may be triggered by panic buying.
The main limitation of this research is the sample bias. The survey participants were selected at random and recruited voluntarily (cf. self-selection of the sample). The overrepresentation of women and educated individuals jeopardized the sample’s representativeness and, as a result, the degree to which results could be generalized to the whole adult population in Serbia. We believe this is related to the cultural context in Serbia and the Balkans in general, where women are in charge of cooking and food management in most households. Consequently, women were more interested in participating in the survey. Furthermore, persons who are not web-literate, as well as the elderly, are often excluded from online surveys. The limitations described above are prevalent in CAWI, frequently used in surveys (Couper 2000; Evans and Mathur 2018; Monzon and Bayart 2018). However, due to the COVID-19 pandemic, online surveys can collect data remotely, a significant benefit when social distancing is necessary, and face-to-face interviews are impossible and/or unsafe.
Conclusions
The study identified many consumer trends that presently affect Serbians’ food consumption habits, food waste patterns, and food shopping habits. First, the results showed that household food waste in Serbia is low and there is a positive attitude toward food waste prevention. Second, most participants cook meals from fresh ingredients several times a week and have developed cooking skills. In addition, it is a common practice in Serbia to store and eat leftovers during the next few days. Third, regarding food labeling knowledge, we observed confusion about the interpretation of food labels. Hence, an appropriate media campaign should be conducted to bring consumers’ attitudes and behaviors in line with food safety standards. Finally, the COVID-19 pandemic led consumers to go shopping less often, buy larger quantities of food, and, consequently, throw away more food than before. The increase of household food waste in Serbia during the pandemic might have been triggered by panic buying. This suggests that raising consumers’ awareness through effective, multichannel information and communication campaigns, as well as ensuring a regular supply of agri-food markets, is fundamental to prevent household food wastage during crisis situations such as pandemics.
Author contribution
Conceptualization, S.B., Z.V., T.B.H., and H.E.B.; methodology, T.B.H., H.E.B., and M.S.A.; software, M.S.A; validation, M.S.A.; formal analysis, S.B., Z.V., T.B.H., H.E.B., and M.S.A.; investigation, V.T. and A.R.; writing—original draft preparation, S.B., Z.V., V.T., and A.R.; writing—review and editing, T.B.H. and H.E.B.; project administration, S.B. and Z.V. All authors have read and agreed to the published version of the manuscript.
Funding
This research did not receive any specific grant from funding agencies in the public, commercial, or not-for-profit sectors.
Data availability
The datasets used and/or analyzed during the current study are available from the corresponding author on reasonable request.
Declaration
Ethics approval and consent to participate
This study was performed in compliance with the Helsinki Declaration guidelines. The Western Michigan University Human Subjects Institutional Review Board (HSIRB) approved all procedures relevant to study participants. Participation in the research was voluntary. At the beginning of the study, each participant was informed of the study objective and context and provided their written informed consent regarding privacy and information management policies.
Consent to publish
Not applicable
Competing interests
The authors declare no competing interests.
Footnotes
According to the EU regulation 1169/2011, “use-by” and “best before” dates are the two most used types of labels. The label “use-by” is used for highly perishable food and indicates minimum durability of food, and after that date, food may no longer be safe to eat. The label “best before” means that past that date food may be safe to eat, but its quality may have deteriorated (EC 2011).
Publisher’s note
Springer Nature remains neutral with regard to jurisdictional claims in published maps and institutional affiliations.
References
- Abouabdillah A, Capone R, El Youssfi L, Debs P, Harraq A, El Bilali H, El Amrani M, Bottalico F, Driouech N (2015) Household food waste in Morocco: an exploratory survey. VI International Scientific Agriculture Symposium “Agrosym 2015”; 15-18 October, 2015; Jahorina, Bosnia and Herzegovina, December, 1353–1360. 10.7251/AGSY15051353A
- Aldaco R, Hoehn D, Laso J, Margallo M, Ruiz-Salmón J, Cristobal J, Kahhat R, Villanueva-Rey P, Bala A, Batlle-Bayer L, Fullana-i-Palmer P, Irabien A, Vazquez-Rowe I. Food waste management during the COVID-19 outbreak: a holistic climate, economic and nutritional approach. Sci Total Environ. 2020;742:140524. doi: 10.1016/j.scitotenv.2020.140524. [DOI] [PMC free article] [PubMed] [Google Scholar]
- Babbitt CW, Babbitt GA, Oehman JM. Behavioral impacts on residential food provisioning, use, and waste during the COVID-19 pandemic. Sustain Prod Consum. 2021;28:315–325. doi: 10.1016/j.spc.2021.04.012. [DOI] [PMC free article] [PubMed] [Google Scholar]
- Baker S, Meyer S, Pagel M, Yannelis C (2020) How does household spending respond to an epidemic? Consumption During the 2020 COVID-19 Pandemic. Natl Bureau Econ Res. 10.3386/w26949
- Ben Hassen T, El Bilali H, Allahyari MS. Impact of COVID-19 on food behavior and consumption in Qatar. Sustainability. 2020;12(17):6973. doi: 10.3390/su12176973. [DOI] [Google Scholar]
- Ben Hassen T, El Bilali H, Allahyari MS, Berjan S, Fotina O. Food purchase and eating behavior during the COVID-19 pandemic: a cross-sectional survey of Russian Adults. Appetite. 2021;165:105309. doi: 10.1016/j.appet.2021.105309. [DOI] [PMC free article] [PubMed] [Google Scholar]
- Ben Hassen T, El Bilali H, Allahyari MS, Charbel L (2021b) Food shopping, preparation and consumption practices in times of COVID-19: case of Lebanon. Journal of Agribusiness in Developing and Emerging Economies, ahead-of-p(ahead-of-print). 10.1108/JADEE-01-2021-0022
- Berjan S, Mrdalj V, El Bilali H, Velimirovic A, Blagojevic Z, Bottalico F, Debs P, Capone R. Household food waste in Montenegro. Italian J Food Sci. 2019;31(2):274–287. doi: 10.14674/IJFS-1276. [DOI] [Google Scholar]
- Bogevska Z, Berjan S, Capone R, Debs P, El Bilali H, Bottalico F, Davitkovska M. Household food wastage in north macedonia. Agric Forestry. 2020;66(2):125–135. doi: 10.17707/AgricultForest.66.2.12. [DOI] [Google Scholar]
- Bräutigam KR, Jörissen J, Priefer C. The extent of food waste generation across EU-27: different calculation methods and the reliability of their results. Waste Manag Res. 2014;32(8):683–694. doi: 10.1177/0734242X14545374. [DOI] [PubMed] [Google Scholar]
- Caldeira C, De Laurentiis V, Corrado S, van Holsteijn F, Sala S. Quantification of food waste per product group along the food supply chain in the European Union: a mass flow analysis. Resour Conserv Recycl. 2019;149(June):479–488. doi: 10.1016/j.resconrec.2019.06.011. [DOI] [PMC free article] [PubMed] [Google Scholar]
- Charbel L, Capone R, Grizi L, Debs P, Khalife D, El Bilali H, Bottalico F. Preliminary insights on household food wastage in Lebanon. J Food Secur. 2016;4(6):131–137. doi: 10.12691/jfs-4-6-2. [DOI] [Google Scholar]
- Corrado S, Sala S. Food waste accounting along global and European food supply chains: state of the art and outlook. Waste Manag. 2018;79:120–131. doi: 10.1016/j.wasman.2018.07.032. [DOI] [PMC free article] [PubMed] [Google Scholar]
- Cosgrove K, Vizcaino M, Wharton C. COVID-19-related changes in perceived household food waste in the United States: a cross-sectional descriptive study. Int J Environ Res Public Health. 2021;18(3):1104. doi: 10.3390/ijerph18031104. [DOI] [PMC free article] [PubMed] [Google Scholar]
- Couper MP. Web surveys. Public Opin Q. 2000;64(4):464–494. doi: 10.1086/318641. [DOI] [PubMed] [Google Scholar]
- Cranfield JAL. Framing consumer food demand responses in a viral pandemic. Canadian Journal of Agricultural Economics/Revue Canadienne d’agroeconomie. 2020;68:151–156. doi: 10.1111/cjag.12246. [DOI] [Google Scholar]
- Danas. (2020). Panic buying makes serbians spend more on grocery, household goods. https://www.danas.rs/drustvo/zbog-panike-domacinstva-u-srbiji-potrosila-dve-milijarde-dinara-vise/
- Djekic I, Miloradovic Z, Djekic S, Tomasevic I. Household food waste in Serbia – attitudes, quantities and global warming potential. J Clean Prod. 2019;229:44–52. doi: 10.1016/j.jclepro.2019.04.400. [DOI] [Google Scholar]
- EC. (2011) EC regulatio 1169-2011-EC. https://eur-lex.europa.eu/legal-content/EN/ALL/?uri=CELEX%3A32011R1169
- El Bilali H, Ben Hassen T. Food waste in the countries of the gulf cooperation council: a systematic review. Foods. 2020;9(463):1–21. doi: 10.3390/foods9040463. [DOI] [PMC free article] [PubMed] [Google Scholar]
- Elmenofi, G. A. G., Capone, R., Waked, S., Debs, P., Bottalico, F., & El Bilali, H. (2015). An exploratory survey on household food waste in Egypt. Book of Abstracts of the VI International Scientific Agriculture Symposium “Agrosym 2015”; 15-18 October, 2015; Jahorina, Bosnia and Herzegovina, March 2016, 533. 10.7251/AGSY15051298E
- Evans JR, Mathur A. The value of online surveys: a look back and a look ahead. Internet Res. 2018;28(4):854–887. doi: 10.1108/IntR-03-2018-0089. [DOI] [Google Scholar]
- FAO, IFAD, UNICEF, W. and W. (2020). The state of food security and nutrition in the world. FAO. 10.4060/ca9692en
- FAO. (2011). Global food losses and food waste: extent, causes and prevention. http://www.fao.org/3/i2697e/i2697e.pdf
- FAO. (2019). The State of Food and Agriculture 2019. Moving forward on food loss and waste reduction. http://www.fao.org/policy-support/tools-and-publications/resources-details/en/c/1242090/
- Farhangmehr M, Marques S, Silva J. Consumer and retailer perceptions of hypermarkets and traditional retail stores in Portugal. J Retail Consum Serv. 2000;7(4):197–206. doi: 10.1016/S0969-6989(00)00019-9. [DOI] [Google Scholar]
- Grandhi B, Appaiah Singh J. What a waste! a study of food wastage behavior in Singapore. J Food Prod Mark. 2016;22(4):471–485. doi: 10.1080/10454446.2014.885863. [DOI] [Google Scholar]
- Gunders D (2012) Wasted: how america is losing up to 40 percent of its food from farm to fork to landfill. NRDC Issue Paper, August, pp 1–26 https://www.nrdc.org/resources/wasted-how-america-losing-40-percent-its-food-farm-fork-landfill
- HLPE. (2014). Food losses and waste in the context of sustainable food systems. A Report by the High Level Panel of Experts on Food Security and Nutrition of the Committee on World Food Security. 65842315
- Jörissen J, Priefer C, Bräutigam KR. Food waste generation at household level: results of a survey among employees of two European research centers in Italy and Germany. Sustainability (Switzerland) 2015;7(3):2695–2715. doi: 10.3390/su7032695. [DOI] [Google Scholar]
- Jribi S, Ben Ismail H, Doggui D, Debbabi H. COVID-19 virus outbreak lockdown: what impacts on household food wastage? Environ Dev Sustain. 2020;22(5):3939–3955. doi: 10.1007/s10668-020-00740-y. [DOI] [PMC free article] [PubMed] [Google Scholar]
- Kalina M, & Tilley E (2020) “This is our next problem”: cleaning up from the COVID-19 response. In Waste Management (Vol. 108, pp. 202–205). Elsevier Ltd. 10.1016/j.wasman.2020.05.006 [DOI] [PMC free article] [PubMed]
- Machado PP, Claro RM, Canella DS, Sarti FM, Levy RB. Price and convenience: the influence of supermarkets on consumption of ultra-processed foods and beverages in Brazil. Appetite. 2017;116(November):381–388. doi: 10.1016/j.appet.2017.05.027. [DOI] [PubMed] [Google Scholar]
- Monzon A, Bayart C. Workshop synthesis: web-based surveys, new insight to address main challenges. Transp Res Procedia. 2018;32:167–173. doi: 10.1016/j.trpro.2018.10.030. [DOI] [Google Scholar]
- National Geographic Serbia. (2020). How much (really) do we throw away food?https://www.nationalgeographic.rs/vesti/14153-koliko-zaista-bacamo-hranu.html
- Newsome R, Balestrini CG, Baum MD, Corby J, Fisher W, Goodburn K, Labuza TP, Prince G, Thesmar HS, Yiannas F. Applications and perceptions of date labeling of food. Compr Rev Food Sci Food Saf. 2014;13(4):745–769. doi: 10.1111/1541-4337.12086. [DOI] [PubMed] [Google Scholar]
- Pejin B, Kien-Thai Y, Stanimirovic B, Vuckovic G, Belic D, Sabovljevic M. Heavy metal content of a medicinal moss tea for hypertension. Nat Prod Res. 2012;26(23):2239–2242. doi: 10.1080/14786419.2011.648190. [DOI] [PubMed] [Google Scholar]
- Preka R, Berjan S, Capone R, El Bilali H, Allahyari MS, Debs P, Bottalico F, Mrdalj V. Household food wastage in Albania: causes, extent and implications. Future Food: J Food Agric Soc. 2020;8(1):1–20. doi: 10.17170/kobra-202002281029. [DOI] [Google Scholar]
- Principato, L., Secondi, L., Cicatiello, C., & Mattia, G. (2020). Caring more about food: the unexpected positive effect of the COVID-19 lockdown on household food management and waste. Socio Econ Plan Sci, 100953. 10.1016/j.seps.2020.100953 [DOI] [PMC free article] [PubMed]
- Qian K, Javadi F, Hiramatsu M. Influence of the COVID-19 pandemic on household food waste behavior in Japan. Sustainability. 2020;12(23):9942. doi: 10.3390/su12239942. [DOI] [Google Scholar]
- Quested TE, Marsh E, Stunell D, Parry AD. Spaghetti soup: the complex world of food waste behaviours. Resour Conserv Recycl. 2013;79:43–51. doi: 10.1016/j.resconrec.2013.04.011. [DOI] [Google Scholar]
- Quested TE, Parry AD, Easteal S, Swannell R. Food and drink waste from households in the UK. Nutr Bull. 2011;36(4):460–467. doi: 10.1111/j.1467-3010.2011.01924.x. [DOI] [Google Scholar]
- Rodgers, R. F., Lombardo, C., Cerolini, S., Franko, D. L., Omori, M., Linardon, J., Guillaume, S., Fischer, L., & Tyszkiewicz, M. F. (2021). “Waste not and stay at home” evidence of decreased food waste during the COVID-19 pandemic from the U.S. and Italy. Appetite, 160, 105110. 10.1016/j.appet.2021.105110 [DOI] [PMC free article] [PubMed]
- Roodhuyzen DMA, Luning PA, Fogliano V, Steenbekkers LPA. Putting together the puzzle of consumer food waste: towards an integral perspective. Trends Food Sci Technol. 2017;68:37–50. doi: 10.1016/j.tifs.2017.07.009. [DOI] [Google Scholar]
- Šantić D, Antić M. Serbia in the time of COVID-19: between “corona diplomacy”, tough measures and migration management. Eurasian Geogr Econ. 2020;61(4–5):546–558. doi: 10.1080/15387216.2020.1780457. [DOI] [Google Scholar]
- Sarkis J, Cohen MJ, Dewick P, Schröder P. A brave new world: lessons from the COVID-19 pandemic for transitioning to sustainable supply and production. Resour Conserv Recycl. 2020;159:104894. doi: 10.1016/j.resconrec.2020.104894. [DOI] [PMC free article] [PubMed] [Google Scholar]
- Sassi K, Capone R, Abid G, Debs P, El Bilali H, Bouacha OD, Bottalico F, Driouech N, Terras DS. Food wastage by Tunisian households. AGROFOR Int J. 2016;1(1):172–181. doi: 10.7251/AGRENG1601172S. [DOI] [Google Scholar]
- Schanes K, Dobernig K, Gözet B. Food waste matters - a systematic review of household food waste practices and their policy implications. J Clean Prod. 2018;182:978–991. doi: 10.1016/j.jclepro.2018.02.030. [DOI] [Google Scholar]
- Secondi L. Expiry dates, consumer behavior, and food waste: how would Italian consumers react if there were no longer “best before” labels? Sustainability (Switzerland) 2019;11(23):1–15. doi: 10.3390/su11236821. [DOI] [Google Scholar]
- Sharma HB, Vanapalli KR, Cheela VS, Ranjan VP, Jaglan AK, Dubey B, Goel S, Bhattacharya J. Challenges, opportunities, and innovations for effective solid waste management during and post COVID-19 pandemic. Resour Conserv Recycl. 2020;162:105052. doi: 10.1016/j.resconrec.2020.105052. [DOI] [PMC free article] [PubMed] [Google Scholar]
- Stöckli S, Niklaus E, Dorn M. Call for testing interventions to prevent consumer food waste. Resour Conserv Recycl. 2018;136:445–462. doi: 10.1016/j.resconrec.2018.03.029. [DOI] [Google Scholar]
- The Government of the Republic of Serbia. (2020). First case of coronavirus in Serbia confirmed. https://www.srbija.gov.rs/vest/en/150981/first-case-of-coronavirus-in-serbia-confirmed.php
- Vargas-Lopez A, Cicatiello C, Principato L, Secondi L. Consumer expenditure, elasticity and value of food waste: a quadratic almost ideal demand system for evaluating changes in Mexico during COVID-19. Socio Econ Plan Sci. 2021;101065:101065. doi: 10.1016/j.seps.2021.101065. [DOI] [PMC free article] [PubMed] [Google Scholar]
- Vaško Ž, Berjan S, El Bilali H, Allahyari MS, Ostojić A, Bottalico F, Debs P, Capone R. Attitude and behaviour of Bosnian households towards food waste. Agric Forestry. 2020;66(4):139–150. doi: 10.17707/AgricultForest.66.4.11. [DOI] [Google Scholar]
- Visschers VHM, Wickli N, Siegrist M. Sorting out food waste behaviour: a survey on the motivators and barriers of self-reported amounts of food waste in households. J Environ Psychol. 2016;45:66–78. doi: 10.1016/j.jenvp.2015.11.007. [DOI] [Google Scholar]
- Waste and Resources Action Programme (WRAP). (2020). Citizens and food during lockdown. https://wrap.org.uk/content/citizens-and-food-covid-19-lockdown
- WHO. (2015). Estimates of the global burden of foodborne diseases: foodborne disease burden epidemiology reference group 2007-2015. https://apps.who.int/iris/bitstream/handle/10665/199350/9789241565165_eng.pdf?sequence=1
- WHO. (2021). Serbia: WHO coronavirus disease (COVID-19) dashboard. https://covid19.who.int/region/euro/country/rs
- World Bank. (2020). An uncertain recovery. Western Balkans regular economic report No. 18. https://openknowledge.worldbank.org/bitstream/handle/10986/34644/153774.pdf
- WRAP. (2020). Food waste trends survey 2019: citizen behaviours, attitudes and awareness around food waste. https://wrap.org.uk/resources/report/food-waste-trends-survey-2019
- Yildirim H, Capone R, Karanlik A, Bottalico F, Debs P, El Bilali H. Food wastage in Turkey: an exploratory survey on household food waste. J Food Nutrition Res. 2016;4(8):483–489. doi: 10.12691/jfnr-4-8-1. [DOI] [Google Scholar]
- Yu Y, Jaenicke EC. Estimating food waste as household production inefficiency. Am J Agric Econ. 2020;102(2):525–547. doi: 10.1002/ajae.12036. [DOI] [Google Scholar]
- Zielińska D, Bilska B, Marciniak-łukasiak K, Łepecka A, Trząskowska M, Neffe-skocińska K, Tomaszewska M, Szydłowska A, Kołożyn-krajewska D (2020) Consumer understanding of the date of minimum durability of food in association with quality evaluation of food products after expiration. Int J Environ Res Public Health 17(5). 10.3390/ijerph17051632 [DOI] [PMC free article] [PubMed]
Associated Data
This section collects any data citations, data availability statements, or supplementary materials included in this article.
Data Availability Statement
The datasets used and/or analyzed during the current study are available from the corresponding author on reasonable request.