

Abstract
For decades, the class of anabolic androgenic steroids has represented the most frequently detected doping agents in athletes’ urine samples. Roughly 50% of all adverse analytical findings per year can be attributed to anabolic androgenic steroids, of which about 2/3 are synthetic exogenous steroids, where a qualitative analytical approach is sufficient for routine doping controls. For the remaining 1/3 of findings, caused by endogenous steroid-derived analytical test results, a more sophisticated quantitative approach is required, as their sheer presence in urine cannot be directly linked to an illicit administration. Here, the determination of urinary concentrations and concentration ratios proved to be a suitable tool to identify abnormal steroid profiles. Due to the large inter-individual variability of both concentrations and ratios, population-based thresholds demonstrated to be of limited practicability, leading to the introduction of the steroidal module of the Athlete Biological Passport. The passport enabled the generation of athlete-specific individual reference ranges for steroid profile parameters. Besides an increase in sensitivity, several other aspects like sample substitution or numerous confounding factors affecting the steroid profile are addressed by the Athlete Biological Passport-based approach. This narrative review provides a comprehensive overview on current prospects, supporting professionals in sports drug testing and steroid physiology.
Key words: analytical chemistry, steroids, isotope ratio mass spectrometry, doping, anabolic steroids, nutritional supplements, isotopes
Introduction
Donike and co-workers laid the foundation of comprehensive steroid profiling for sports drug testing purposes already in the early 1980s by introducing a suitable derivatization technique for steroids 1 . Based on this approach, a method for the sensitive quantification of urinary testosterone (T) and epitestosterone (E) was established, and the ratio between both urinary concentrations (T/E) was introduced as a robust indicative marker for T administrations 2 . Also the general concept of urinary steroid profiles dates back to this time albeit, in the beginning, mainly abundant steroids were considered here to evaluate the health status of individuals encompassing determinations of androsterone (A), etiocholanolone (ETIO) and dehydroepiandrosterone (DHEA) 3 4 .
The applicability of the T/E ratio to detect the misuse of T was corroborated by several excretion studies employing deuterated T, and the methodology was straightforwardly implemented in doping control analysis by the Medical Commission of the International Olympic Committee in 1982 5 6 7 . Initially, a reference population-derived threshold was established at T/E ≥ 6 based on a population of 97 sport students (n = 50 males and 47 females) and a series of athletes’ samples (n = 1291), mainly encompassing male individuals 2 . This population-derived threshold was later confirmed by several follow-up studies 8 9 .
Obviously, due to the broad distribution of T/E ratios, the possibility of naturally elevated T concentrations resulting in T/E ≥ 6 was taken into consideration right from the beginning. Additionally, physiological or pathological factors like the diminished excretion of E or a steroid-producing tumour had to be excluded as confounding factors prior to sanctioning an athlete. Therefore, already at the earliest stage of steroid profiling, analytical data from follow-up doping control samples or samples collected prior to the conspicuous finding were included in the process of result interpretation 7 10 11 . In order to ascertain naturally elevated T/Es, endocrinological studies were carried out in the 1990s, mainly supported by the International Cycling Union 10 . As these studies were laborious, the number of participants was comparably low, and this approach was not generally applicable to doping controls.
In 1994, isotope ratio mass spectrometry (IRMS) was introduced as a possible measure to distinguish between naturally elevated T/Es and the administration of T, and the analytical strategy was applied to samples producing suspicious urinary steroid profiles on a routine basis since the late 1990s 12 13 14 . Ever since, the IRMS methodology has been used as a confirmation procedure for elevated T/Es and atypical steroid profiles. Relying on this supplementary and unambiguous confirmation, the threshold for T/E was lowered to 4 by the World Anti-Doping Agency (WADA) in 2004 15 . Lowering the T/E ratio did not significantly affect the number of adverse analytical findings. For example, in the Cologne laboratory, only 4 additional samples representing only 0.3% of all samples investigated in the years 2005 to 2007 showed suspicious carbon isotope ratio (CIR) values 16 . By means of CIR it is possible to differentiate if urinary steroids have been produced inside the body or if they have been administered. Some points related to CIR will be discussed at the end of this article.
A significant increase in sensitivity of the T/E ratios and the steroid profiles was achieved by the implementation of the steroidal module in the Athlete Biological Passport starting in 2014 17 . A prerequisite for this implementation was the harmonization of steroid profile measurements throughout the world. This harmonization of methods was the main goal of the Technical Document on steroid profiling issued by WADA in their function as an accreditation body. This document explained in detail which steroids should be quantified (T, E, A, ETIO, 5α-androstane-3α,17β-diol (5αADIOL) and 5β-androstane-3α,17β-diol (5βADIOL), all excreted unconjugated and glucuronidated), which internal standards should be applied, and how the T/E ratio should be determined 17 . Additionally, other potentially significant ratios like A/T or 5αADIOL/E were introduced but not considered mandatory at that time. Important confounding factors to the steroid profile such as ethanol intake or microbial contaminations were also highlighted, and laboratories were enrolled to monitor these in conjunction with steroid profile analyses. In 2018, a revised Technical Document for steroid profiling came into effect, further standardizing the analytical methods and the reporting of endogenous urinary steroid concentrations 18 . As all WADA accredited laboratories world-wide are obliged to follow these technical regulations, an alignment of results can easily be obtained.
The strict harmonization of quantification enables the retrospective longitudinal data evaluation of an athleteʼs samples over years by the Bayesian statistical approach introduced by Sottas et al. 19 20 . The early longitudinal or endocrinological studies computed a mean value for the T/E based on at least 3 different samples and an individual threshold is calculated thereof by adding the 3-fold standard deviation (SD) and taking into consideration the coefficient of variation (CV) 10 . This straightforward statistical approach was found to be sufficient in many cases and, especially with a larger number of the tested person’s samples, allowed for a clear discrimination between naturally elevated T/Es and doping scenarios. The more sophisticated Bayesian approach starts with the population-based threshold and adopts this individually with each new sample added to the passport. Already after the first collected sample the results are used to adopt the thresholds for the second one resulting in substantially more narrow decision limits 19 . After 2 to 3 samples, the individual threshold stabilizes and yields a highly sensitive indicator for fluctuations of the T/E 20 . This statistical approach is not only applicable to the T/E ratio but can be applied to each meaningful ratio.
Besides, this straightforward benefit allows the comprehensive and reliable collection of data within the steroidal module for the possible detection of doping scenarios even beyond the intended use of this application like, for example, sample mix up or sample substitution. Within this review the reader will be provided with several examples for both the increased sensitivity towards the detection of steroid applications and the enhanced observation possibilities given to the Athlete Passport Management Unit (APMU) 21 by the ABP regarding other doping scenarios or confounding factors. Issues that may wait for further improvements will also be discussed.
Increased sensitivity by applying the longitudinal T/E ratio
While the first systematic population-based investigations on T/E ratios suggested a rather homogenous distribution 2 , in subsequent determinations encompassing larger populations a clear bimodal distribution with maxima at 0.16 and 1.0 was established 8 . A first interpretation of this finding was the differentiation between “Oriental” or “Asian” steroid profiles with a low T/E and other steroid profiles with T/Es around 1 9 . More than a decade of research was required to identify the main factor responsible for this significant difference, and Jakobsson et al. eventually demonstrated the considerable influence of UGT2B17 polymorphism on the glucuronidation of T and, thus, the urinary T/E ratio 22 . Especially the del/del genotype results in very low urinary T/E ratios, and this polymorphism is found with a higher probability in the Asian population resulting in the “Asian” steroid profiles reported 10 years before 22 23 24
Even without that knowledge, Ayotte et al. suggested a different T/E threshold for the different individuals depending on their basal T/E ratio already in the 1990s 8 . While this was impossible to employ for a single spot urine sample at that time, it was one of the triggers for and direct benefits of the steroidal module. As soon as the first sample is collected, the thresholds are individualized accordingly as demonstrated exemplarily in Fig. 1 . This reduces the number of unnecessary IRMS confirmations for athleteʼs with naturally elevated T/E ratios and increases the sensitivity of the steroid profile dramatically for those excreting low amounts of T. The number of adverse analytical findings (AAFs) based on IRMS increased after the implementation of the steroidal module as demonstrated in Fig. 2 . Samples with T/E ratios below 1 were found suspicious by applying the individual thresholds and the exogenous origin of steroids was confirmed by IRMS. While the number of samples analysed by IRMS remained rather stable over the years, the number of AAFs increased, and especially since 2015 samples were confirmed by IRMS that would not have been analysed without the longitudinal approach. This ‘local’ trend found in the Cologne laboratory is also corroborated by IRMS findings throughout the world as summarized in WADA´s Testing Figure Report, which illustrates a constant number of IRMS tests with a slight increase in IRMS AAFs since 2013 25 .
Fig. 1.

Adaption of the T/E threshold (red line) according to the individual values (blue line). Samples shown as circles represent out-of-competition, samples shown as stars in-competition testing. Example taken from the steroidal module of ADAMS (Anti-Doping Administration & Management System).
Fig. 2.

Increasing number of IRMS-based adverse analytical findings (AAF) per year in the Cologne laboratory. The striped pattern columns stand for samples forwarded to IRMS triggered by population derived thresholds, black columns represent those samples showing atypical passport findings (mostly T/E samples). The absolute number of samples investigated by each year is given at the top.
Increased sensitivity by applying other ratios like 5αADIOL/E
Despite the overall increased sensitivity of the steroidal module towards individuals with naturally low T/E ratios, especially those with the del/del polymorphism of the UGT2B17 genotype may not show any significant response in urinary steroid concentrations upon the administration of T. This was reported for Japanese subjects in 2012 and corroborated later on applying the ABP from 2014 onwards 24 26 27 While the IRMS test, where applicable, could prove the exogenous origin of T and T-metabolites, the urinary concentrations of T were only slightly affected in agreement with the modest effect on the T/E ratio. A similar low response of the T/E may be recognized if only low doses of T are applied 28 . In such cases, the ratio of 5αADIOL and E was found to offer superior performance and resulted in atypical classifications of the steroid profiles even after the administration of DHEA 29 30 . An example for the successful implementation of 5αADIOL/E into the steroidal module is presented in Fig. 3 . The athlete produced a very low T/E of ca. 0.1, and the corresponding individual threshold was calculated with 0.28; however, this variable was not applicable to a variety of the athlete’s doping control samples as T and E concentrations were below the test method’s limit of detection (LOD) and, consequently, yielded invalid T/E determinations. Therefore, no threshold for the T/E is computed by the software ( Fig. 3 , left). Nevertheless, the limits for 5αADIOL/E were calculated, and their application to the sample number 38 identified an atypical value, corresponding to a likewise slightly elevated T/E. All other parameters were found to be non-suspicious. Forwarding this sample to IRMS resulted in an AAF for both 5αADIOL and 5βADIOL while T fell below the LOD of the IRMS method. Similar results obtained on 10 different athletes have been described in the literature recently 31 .
Fig. 3.

Longitudinal profile obtained on one athlete with very low T/E ratios (left, blue line) and the corresponding ratio of 5αADIOL/E (right, blue line) and calculated individual thresholds (red line). Further information in the text. Samples shown as circles represent out-of-competition, samples shown as stars in-competition testing. Example taken from the steroidal module of ADAMS.
While these results underline the added value of including 5αADIOL/E into the steroid profile of athletes’ doping controls, it should be mentioned that this ratio may exhibit a larger variability compared to other urinary steroid ratios, especially concerning urine samples from females. This effect has also been recognized for the T/E and can be attributed to the menstrual cycle, hormonal contraceptives, and general analytical challenges caused by the lower concentrations of urinary steroids in urine samples collected from females 32 33 34 35 36 . Carefully considering these confounding factors where applicable will help to avoid unnecessary confirmation procedures by simultaneously maintaining the high probative force of the steroidal module.
The detection of another possible endogenous steroid application, i. e . dihydrotestosterone (DHT), was also found to be improved by the application of the 5αADIOL/E ratio. Already in 1992, this ratio was introduced to detect the administration of DHT and verified shortly after 37 38 . In addition, the absolute concentration of urinary DHT and the DHT/E ratio were also investigated. Both ratios appeared to perform equally well, which was recently corroborated by an excretion study performed with a single oral dose of DHT as shown in Fig. 4 39 . Directly after application, both ratios were found significantly elevated and returned back to initial values after 35 h. The absolute concentration of DHT and other possible markers such as 5αADIOL/5βADIOL or A/ETIO were observed beyond individual thresholds only for 21 h. As DHT is not included as a mandatory component of the steroid profile, administrations will preferentially be detected by the ratio of 5αADIOL/E. Steroid profile confirmations triggered by this ratio should therefore encompass the concentration determination of DHT, where applicable, and samples forwarded to IRMS should focus on 5αADIOL, A and especially epiandrosterone found in the fraction of sulfoconjugated steroids as this metabolite will be found influenced for a prolonged time period 39 .
Fig. 4.

Urinary concentration ratios of 5αADIOL/E (black triangles) and DHT/E (grey circles) after a single oral application of 50 mg of DHT. The dashed lines represent the respective individual threshold for each ratio calculated from 6 pre- and post-administration samples.
Confounding factors and the ABP
Numerous confounding factors to the steroid profile have been described and are well summarized in the relevant literature 40 41 . Within this review, we will focus on those factors detectable by the steroidal module and which can directly be linked to a certain confounder. Therefore, ethanol consumption, hormonal contraceptives, pathological states, and mental stress will be carefully considered, complemented by a short discussion on problems attributed to (microbial) sample degradation and the administration of 5α-reductase inhibitors and other potential confounders to the steroid profile.
Ethanol consumption
The impact of ethanol ingestion on the endogenous steroid synthesis and metabolism was already described in the 1960s 42 , and further investigations on the mode of action of the ingestion of ethanol on the urinary T/E ratio followed approximately 20 years later 43 44 45 46 47 . Especially in samples from females, a strong increase of the T/E ratio was found and, most probably, triggered numerous IRMS confirmations as a result of a steroid profile-confounding factor 48 . A decrease in urinary concentrations of A and ETIO was also described and the T/A ratio was suggested as the most promising marker to detect the influence of ethanol administration 46 . In order to enhance the probative force of the steroidal module, a reporting level for Ethyl Glucuronide (EtG) was implemented at 5 µg/mL and if a sample shows elevated levels of EtG, the related steroid profile may be invalidated for the ABP in order to maintain a high probative force of the passport. EtG is a urinary metabolite of ethanol and strongly correlated with ethanol administration 46 . The effect of ethanol is exemplarily depicted in Fig. 5 . The female athlete shows a very stable T/E profile over the time period of 5 years with the exception of two values. In both cases significantly elevated T/E ratios were reported in the initial testing procedure and confirmed afterwards together with the strongly elevated concentrations of EtG. In both cases, an IRMS confirmation was automatically triggered and conducted with negative results. In order to maintain the high probative force of the threshold calculated by the Bayesian model, both T/E values were removed from the longitudinal profile.
Fig. 5.

Longitudinal profile obtained on a female athlete over a time period of 5 years. The red lines represent the threshold for T/E as calculated by the Bayesian approach, the blue stars the T/E measurements. The 2 samples found with elevated T/E ratios have been added to the plot but were not considered for threshold determinations. Samples shown as circles represent out-of-competition, samples shown as stars in-competition testing. Example taken from the steroidal module of ADAMS.
The procedure how to handle elevated T/E ratios found in coincidence with elevated concentrations of EtG has been adopted since then. Today, a general recommendation is to perform IRMS for the first incidence in order to exclude the possible co-administration of T and ethanol. For subsequent samples showing elevated levels, the IRMS remains optional but not mandatory.
Hormonal contraceptives
Due to the menstrual cycle, women’s longitudinal steroid profile data tend to show a larger variation compared to male steroid profiles 33 36 . This scatter is compensated for by the Bayesian approach and results in broader confidence intervals for females and does not challenge the principle of the steroidal module. The use of hormonal contraceptives (HC) in contrast does, especially if initiated or ceased during the monitored time period 34 35 . During the application of HC, the urinary concentration of E is found diminished, which results in increased ratios of T/E and 5αADIOL/E.
This is exemplarily depicted in Fig. 6 . After the first two samples, collected within 2 months, defined the boundaries of the steroidal module, the third sample collected 4 months later fell beyond the threshold and triggered steroid profile confirmation and IRMS analysis. The IRMS could unambiguously demonstrate the endogenous origin of T and T-metabolites. Follow-up samples collected (number 4 and 5) confirmed the increased T/E and 5αADIOL/E ratios. The German National Anti-Doping Agency contacted the athlete who confirmed the administration of HC starting after sample number 2. The Bayesian approach adopted to the new elevated values with increased thresholds over a short time period. Samples collected over the next 2 years (samples 6–18) did not show any atypical values anymore.
Fig. 6.

Longitudinal profile of T/E and 5αADIOL/E for a female athlete starting to use hormonal contraceptives after sample 2. Samples shown as circles represent out-of-competition, samples shown as stars in-competition testing. Example taken from the steroidal module of ADAMS.
Another example for the use of HC is shown in Fig. 7 . Between samples number 8 and 9, the steroid profile starts to change significantly returning back to starting values at sample number 14. The time period in-between encompasses 14 months. While the T/E ratio is only slightly affected, especially the 5αADIOL/E shows a strong increase. Obviously, not only the concentration of E is diminished in this individual, but the urinary concentration of T is also slightly affected. Absolute mean concentrations decrease from 5 to 2 ng/mL for T and from 12 to 1.5 ng /mL for E. The fluctuations in T concentrations are reflected by the A/T ratio. The use of HC during the described time period was confirmed by the Testing Authority (TA) and clearly demonstrates the impact of HC on the longitudinal steroid profile.
Fig. 7.
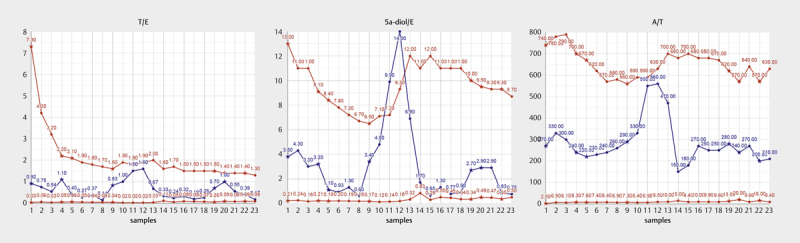
Longitudinal profile of T/E, 5αADIOL/E, and A/T for a female athlete presumptively starting to use hormonal contraceptives after sample 8. Samples shown as circles represent out-of-competition, samples shown as stars in-competition testing. Example taken from the steroidal module of ADAMS.
In general, the use of HC should be considered as a confounding factor for female athletes as soon as atypical fluctuation become visible in a female athletes passport as even single dose applications of emergency contraceptives may have an impact on the steroid profile 49 .
Pathological states
Several medical conditions are known to influence steroid production and metabolism in the human body 50 . Whenever a disease occurs that impacts steroidogenesis, the longitudinal profile may be affected, too. Either directly by a medical condition changing the endogenous steroid production or indirectly due to the prescribed medication. One example for a direct impact is the presence of a prolactinoma, i. e . a benign tumour at the pituitary gland that substantially increases the amount of circulating prolactin which, downstream, strongly stimulates the steroid production in females 51 52 53 In males, the steroid producing pattern induced by hyperprolactinaemia is different and was reported to result in a decreased T and DHT production, accompanied by diminished 5α-reductase activity 54 55 56 . Elevated prolactin blood concentrations can also be induced by medications such as, for example, antidepressants and can therefore occur intermittently 57 .
An example for a possible benign tumour at the pituitary gland affecting prolactin is given in Fig. 8 . A male athlete presents a naturally elevated T/E ratio, and the first doping control urine sample was confirmed to contain endogenous steroids only by IRMS. This result was once more corroborated by IRMS determinations obtained from sample 16. The elevated T/E ratio is due to the urinary excretion of low amounts of E (mean value of 4.3±2.1 ng/mL), and the E concentrations close to the limit of detection are reflected by the above-average scatter of the T/E. Between sample 7 and sample 8 a significant decrease of the T/E ratio is visible, driven by a reduction in urinary T concentrations from more than 20 ng/mL to 5 ng/mL. This decrease is accompanied by a simultaneous trend in both the 5αADIOL/5βADIOL and A/ETIO ratio. There is no known doping scenario that would explain this pattern but it would fit the above-mentioned effects caused by hyperprolactinaemia. Unfortunately, it was not possible to contact the athlete regarding any possible medical condition during the time period of 17 months covered by samples 7–14. In any case, the privacy and data protection of the individual athlete prevail and in cases where medical conditions are assumed, the APMU can only inform the relevant TA and may request to forward the suspicion in order to encourage the athlete to seek necessary medical assistance. But the TA confirmed a medical condition for this athlete who had to withdraw from competitive sport for a certain time period. The general possibility that any pathological state may have an impact of the steroidal module should always be taken into consideration when evaluating atypical passport findings.
Fig. 8.

Longitudinal profile of T/E, A/ETIO, and 5αADIOL/5βADIOL for a male athlete presumptively suffering from hyperprolactinaemia between samples 7 and 14 covering a time period of 17 months. Samples shown as circles represent out-of-competition, samples shown as stars in-competition testing. Example taken from the steroidal module of ADAMS.
Fluctuations in the ABP caused indirectly by prescribed medications can often be followed-up by existing therapeutic use exemptions (TUE). In cases an athlete shows any medical condition that necessitates the administration of a drug listed as a banned substance according to the WADA Prohibited List, the athlete can apply for a TUE. One possible medication with a strong impact on the steroid profile is T, which may be prescribed in cases of hypogonadism. If the medication starts or stops during the longitudinal monitoring of the athlete, the steroidal module will flag atypical test results and trigger a confirmation and IRMS analysis. Such processes can be avoided if the TUE of the athlete is recognized by the APMU. If the T administration is continuous, the athlete will be recognized with an elevated T/E ratio and a pronounced scattering of the urinary steroid concentrations and calculated ratios, but not necessarily with an atypical passport finding.
Mental and physical stress
Participating in competition is, for the majority of athletes, associated with mental stress. The response of the body to stress is multifaceted and encompasses the upregulation of glucocorticoid hormones 58 59 60 The stimulus of the adrenal glands alone may have an impact on the urinary concentration of excreted steroids. Additionally, more than 20 years ago, the effect of competition stress on plasma T-levels was investigated and significant increases after competition were recognized 61 . The increase was correlated to an index of self-evaluation of stress but not reflected by urinary T/E ratios. The impact on plasma T-levels even depend on the type of in-competition (IC) event, i. e . differences between home and away games were measured 62 63 .
This impact should result in a general significant difference between samples collected IC and out-of-competition (OOC) and may be reflected by the steroidal module depending on the individual response to competition-provoked stress. The first question was investigated by a statistical evaluation of n = 10031 samples collected IC and n = 12447 samples collected OOC in the year 2016 and analysed by the routine doping control method as applied in the Cologne laboratory 39 . The distribution of all T/E ratios was found to depend on the collection site of the sample (IC vs OOC) as depicted in Fig. 9 . The overall mean value was found to be highly significantly elevated in IC samples (median of 0.98 OOC vs 1.11 IC, p < 0.001, Kruskal-Wallis test, Calculation performed in R) 64 . As directly visible in the density-plot ( Fig. 9 ) this was not due to different amounts of samples showing naturally low T/E ratios or due to a different percentage of male and female samples IC (31 % of female samples) and OOC (33 %). Of course, these population-derived differences can only be attributed to stress with some uncertainty as other potential confounding factors are unknown.
Fig. 9.

Density plot of T/E ratios obtained in routine doping control samples collected out-of-competition (blue) and in-competition (red). The differences in mean values were found to be highly significant. Further information in the text.
An additional investigation of steroid ratios encompassing a 5α- or a 5β-configuration corroborates the hypothesis of competition stress-induced changes in the steroid profile. Samples collected IC tend to show elevated ratios of A/ETIO and 5αADIOL/5βADIOL as shown in Fig. 10 . Both difference were found to be highly significant by applying a generalized linear model in R (p < 0.001) 64 . Again, this is an observation based only on population data and will of course be inter-individually highly variable. For example, the increase in both ratios can either be triggered by an increase in the urinary concentrations of A or 5αADIOL or a decrease in ETIO and 5βADIOL, both resulting in comparable elevations.
Fig. 10.
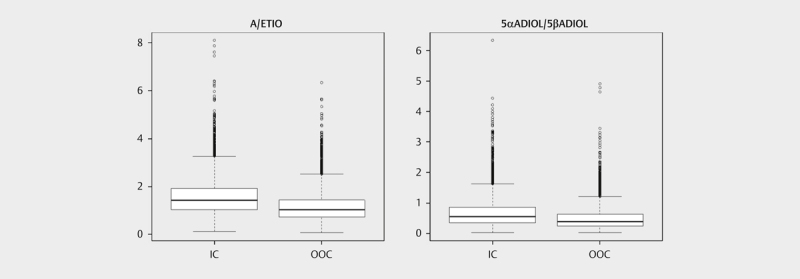
Box plot of the ratios A/ETIO (left) and 5αADIOL/5βADIOL (right) obtained in routine doping control samples collected out-of-competition (OOC) and in-competition (IC). The differences in mean values were found to be highly significant. Further information in the text.
Nevertheless, in selected individual ABPs, the influence of competition is clearly visible. This is exemplarily depicted in Fig. 11 showing the longitudinal profile of a male athlete with samples collected over a time period of 21 months. Samples number 2, 4, and 6 were collected IC while the others derive from OOC testing, exhibiting elevated 5α/5β ratios. Sample number 9 was collected OOC and demonstrates that either stress can of course also occur during training (maybe due to high intensities) or that other confounding factors may have influenced these ratios. Further studies focussing on different confounding factors may be helpful to further elucidate the impact of stress on the steroid profile.
Fig. 11.

Longitudinal profile of A/ETIO and 5αADIOL/5βADIOL for a male athlete. Samples number 2, 4, and 6 were collected in-competition. Samples shown as circles represent out-of-competition, samples shown as stars in-competition testing. Example taken from the steroidal module of ADAMS.
Sample degradation
Due to inappropriate storage conditions during sample transportation in combination with the non-sterile sampling of urine doping control specimen, degradation of endogenous steroids and especially steroid conjugates may occur. For the de-conjugation of glucuronides and sulphates, even ambient temperatures during (prolonged) sample transportation and custom clearance may be sufficient. This effect has already been reported in 1977 and was investigated in the field of doping controls several times since then due to the possible impact on the validity of test results 65 66 67 68 69 70 71 . In the context of the steroidal module, microbial sample degradation was implemented as a confounding factor, and samples exhibiting elevated levels of 5α- and/or 5β-androstanedione are considered as invalid. The employed decisive criteria are the ratios of androstanediones (5α-androstanedione or 5β-androstanedione) divided by A or ETIO, respectively, which should not exceed a value of 0.1 18 . During the steroid profile confirmation analysis, the ratio of unconjugated T and T-glucuronide present in urine without enzymatic hydrolysis may also be considered and invalidate the steroid profile if found elevated. This may result in inadequate analytical results as recently demonstrated in a case study 31 . All urine samples showing only minor signs of microbial degradation can be considered valid regarding their IRMS confirmation and should therefore be forwarded to this technique in any reasonable case 72 73 .
Other confounding factors
In principle, all compounds administered to the human body such as food, beverage or medication can act as a confounding factor if they encompass the ability to act on steroid genesis or metabolism 74 75 76 77 . A class of compounds with a straightforward and well investigated action on steroid metabolism are 5α-reductase inhibitors like for example finasteride 78 . This commonly prescribed medication to treat male pattern baldness or prostate enlargement shows a significant impact on the steroid profile as exemplarily depicted in Table 1 . After a prolonged time period encompassing very stable steroid profile data, a sudden change was detected with sample 13. Further investigations showed the presence of finasteride in this specimen and all subsequently collected samples. The strong decrease in urinary concentrations of 5αADIOL and A is accompanied by a slight increase in 5βADIOL and ETIO resulting in the significant decrease of the 5αADIOL/5βADIOL and A/ETIO ratios and, thus, in an atypical steroid profile. In the presence of finasteride, the explanation for such atypical findings is straightforward as this inhibitor is implemented in routine screening methods. But other compounds with 5α-reductase inhibitory properties, which may either not be screened for or which may even not have been recognized as 5α-reductase inhibitors, will also have a significant impact on the steroidal module. This possibility should always be considered during the evaluation of longitudinal steroid profile data showing diminished 5α-steroid concentrations.
Table 1 Results obtained on a male athlete over the time period of 3 years. From sample 13 on finasteride was present in urine samples. Example taken from the steroidal module of ADAMS (Anti-Doping Administration & Management System).
| Sample number | Days | A [ng/mL] | ETIO [ng/mL] | A/ETIO | 5aADIOL [ng/mL] | 5bADIOL [ng/mL] | 5aADIOL/ 5bADIOL |
|---|---|---|---|---|---|---|---|
| 1 | 0 | 7400 | 3100 | 2.4 | 79 | 160 | 0.49 |
| 2 | 24 | 8400 | 3600 | 2.3 | 73 | 140 | 0.52 |
| 3 | 195 | 2600 | 1400 | 1.9 | 49 | 100 | 0.49 |
| 4 | 228 | 6500 | 3500 | 1.9 | 61 | 110 | 0.55 |
| 5 | 236 | 4200 | 1600 | 2.6 | 51 | 130 | 0.39 |
| 6 | 303 | 4200 | 3000 | 1.4 | 69 | 160 | 0.43 |
| 7 | 314 | 4300 | 2300 | 1.9 | 58 | 92 | 0.63 |
| 8 | 529 | 5400 | 3200 | 1.7 | 140 | 230 | 0.61 |
| 9 | 648 | 4000 | 2000 | 2.0 | 51 | 120 | 0.43 |
| 10 | 761 | 4500 | 2600 | 1.7 | 95 | 360 | 0.26 |
| 11 | 783 | 4100 | 2400 | 1.7 | 59 | 150 | 0.39 |
| 12 | 881 | 4000 | 2000 | 2.0 | 120 | 100 | 1.2 |
| 13 | 979 | 1500 | 6200 | 0.24 | 14 | 240 | 0.06 |
| 14 | 1004 | 1100 | 4400 | 0.25 | 13 | 160 | 0.08 |
| 15 | 1124 | 2400 | 5100 | 0.47 | 30 | 170 | 0.18 |
| 16 | 1133 | 960 | 3900 | 0.25 | 14 | 160 | 0.09 |
| 17 | 1163 | 1200 | 5300 | 0.23 | 27 | 330 | 0.08 |
All of the above mentioned confounding factors should be considered for profile evaluation by the respective APMU, especially as many of these factors are not covered by analytical evidence as for ethanol consumption or some 5α-reductase inhibitors. This will improve the over-all sensitivity of the longitudinal approach and may help to minimize the number of samples to be confirmed.
Possible sample mix up and attempts to defraud disclosed by the ABP
As the increased sensitivity of the steroidal module of the ABP increases the probability to detect cheating athletes, some individuals may try to circumvent atypical steroid profiles by sample substitution. Depending on how this sample substitution was carried out, it might be detected by the longitudinal profile. Several different scenarios will be discussed in detail.
Sample mix up by the doping control laboratory or ADAMS
Taking into account that more than 200,000 samples per year are analysed worldwide, it is not surprising that under rare circumstances it may happen that either a sample is mixed up in a laboratory during analysis or that a result is not directly linked to the appropriate individual´s passport. This is usually easily detected as the obtained profile does not match with all previous profiles summarized in the passport. If the mistake was by the laboratory, the mandatory confirmation of the steroid profile directly corrects the incongruity. If a mismatch was triggered by ADAMS, an individually performed alignment of the data solves the issue. These safety measures proved to be adequate to avoid any further consequences for the athlete.
Urine substitution by the athlete
Any tampering or attempt to tamper a doping control sample is forbidden according to WADA´s Prohibited List, and sample substitution is explicitly listed as a prohibited method 79 . If any kind of manipulation has been detected and can be circumstantiated, this is sanctioned like any other anti-doping rule violation. In order to detect such manipulations, the steroidal module of the ABP can be extremely helpful.
If artificial urine or any other possible liquid (for example apple juice or non-alcoholic beer) was used by the athlete to substitute the original urine, this usually results in an abnormal steroid profile as no or nearly no endogenous steroids are detected 80 81 . An example is given in Table 2 summarizing the results obtained on 2 different samples provided by the same athlete. Not only the missing endogenous steroids demonstrate sample substitution but also other parameters like odour or the absence of compounds found regularly in human urine samples like metabolites of social drugs or medications can support the anti-doping rule violation. Besides steroids, other endogenous compounds derived from any metabolic pathway and excreted via urine have to be present at least in trace amounts and if they are covered and detected by routine doping control methods they can be consulted to differentiate between urine and any other liquid.
Table 2 Summary of analytical results obtained on 2 different doping control samples provided by the same athlete.
| Investigated parameter | Sample #1 | Sample #2 |
|---|---|---|
| A [ng/ml] | n.d. | 539 |
| ETIO [ng/ml] | n.d. | 579 |
| E [ng/ml] | n.d. | 3.3 |
| T [ng/ml] | n.d. | 1.1 |
| 5αADIOL [ng/ml] | n.d. | 7.9 |
| 5βADIOL [ng/ml] | n.d. | 9.3 |
| Olfactory test | no odor | urine odor |
| Colour | colourless | yellowish |
| pH | 7 | 6.7 |
| Specific gravity | 1 | 1.006 |
| Analysis by screening method to detect unconjugated, basic and neutral substances | - no caffeine and nicotine | - caffeine |
| - no biological background | - cholesterol | |
| - no indol/indol derivatives | - indol/indol derivatives | |
| - no piperidine derivatives | - piperidine derivatives |
Several cases have been reported in the literature demonstrating sample substitution. 82 83 In all of these cases, the same urine specimen was divided into several individual urine samples resulting in identical steroid profiles leading to the detection of anti-doping rule violations. Urine substitutions initiated by the athlete using urine aliquots of another individual are more challenging but may be detected by discrepancies visible in the longitudinal profile, which cannot be attributed to any of the above-mentioned confounding factors or any doping scenario. Ten cases have been detected in recent years in the Cologne laboratory and one of these is exemplarily discussed here in detail. The longitudinal profile is depicted in Fig. 12 . After the first 2 samples did not show any conspicuous features, the third samples was found with an atypically elevated T/E which triggered an IRMS confirmation demonstrating the endogenous origin of T and T metabolites. Additionally, the ratio of 5αADIOL/5βADIOL was decreased, which does also not match a potential T administration. Samples 4 and 5 again showed unsuspicious T/E ratios but especially sample 5 did not fit into the sequence with an extraordinary A/T and 5αADIOL/5βADIOL ratio. Sample 6 showed a similar pattern to sample 3 with elevated T/E and decreased 5αADIOL/5βADIOL. From sample 6 onwards, the longitudinal profile stabilized. As the observed scatter in the first data points was not explainable, an investigation on possible sample substitution was conducted. This investigation encompassed long-term stored samples (in this case samples 4 and 6), the confirmation of relevant steroid profiles, the IRMS analysis of the sample showing the elevated T/E (which was found to be negative as for sample 3), and the DNA analysis of urine samples in order to verify if the different specimen can be attributed to the same individual or not. In this specific case, the DNA analysis could clearly demonstrate that sample 4 and sample 6 were not derived from the same individual. In order to clarify which of the samples belonged to the athlete, an additional blood sample was collected from the athlete and subjected to DNA analysis. By comparison, sample 6 was attributed to the athlete. Considering this finding, the conclusion may be drawn that samples number 1, 2, 4, and 5 were not from the athlete. Interestingly, samples 1, 2, and 4 were OOC samples and here the substitution may be easier, but sample 5 was collected IC (as sample 3 and 6 were) and here the effort to swap samples can be considered much higher than for OOC collections. This may also explain the very different steroid profile found in sample 5 compared to the other samples used for substitution. Nevertheless, as mentioned above, the tampering of a single doping control specimen is considered as an anti-doping rule violation and was prosecuted in this case.
Fig. 12.

Longitudinal profile of T/E, A/T, A/ETIO, and 5αADIOL/5βADIOL for a male athlete covering a time period of more than 2 years demonstrating the impact of sample substitution. Example taken from the steroidal module of ADAMS.
As soon as an APMU has the suspicion that sample substitution may have taken place and after verification that no administrative error exists, it is strongly recommended to follow the described procedure encompassing:
Long-term storage of available samples and initiation of additional target tests of the athlete (if necessary)
Confirmation of relevant steroid profiles
Confirmation by IRMS
Application of DNA analysis in order to prove a potential anti-doping rule violation.
This procedure reaches its limitations in cases where athletes substitute their urine samples with their own, earlier collected, samples. In these cases, the steroid profiles will be very similar and may only become suspicious due to their “abnormal” similarity and DNA analysis will not provide evidence for manipulation either. But other analytical methods can be applied to samples suspicious for this form of substitution. As partly mentioned in Table 2 , the pattern of other urinary ingredients or endogenous metabolites beyond the endogenous steroids should also vary over time, and if these patterns are highly similar for different samples this will further raise the suspicion for a possible sample substitution. Producing unequivocal evidence by this procedure is much more complicated and to the best of our knowledge, no sanction has been established solely on analytical evidence alone in such a case so far. But the combination of analytical data with information derived by Intelligence and Investigations may offer a solution here.
Future perspectives and current complements to the steroidal module
New biomarkers and statistical approaches
The steroidal module in its present form is a powerful tool to detect the misuse of endogenous steroids that is based on scientific research and method development conducted in the last four decades. Multifaceted research was conducted in order to further improve the detectability focussing mainly on the implementation of additional endogenous metabolites and their ratios 84 85 86 87 88 89 90 . In many of these cases, slight improvements in sensitivity or retrospectivity were demonstrated but this seemed not to justify spending the effort necessary to implement these metabolites into routine screening procedures world-wide. Especially if additional steps in sample preparation like de-conjugation of sulphated steroids or cysteine conjugates have to be implemented or the analytical strategy changes from gas to liquid chromatography, expenditures will become enormous 87 88 90 . Much easier would be the implementation of novel metabolites that are already covered by current sample preparations but even here measurement time on the analytical instrument may become the limiting factor. Modifying the statistical approach would be another option, and also here research is ongoing. Until now, several multivariate approaches have been tested and as soon as they will be applicable in a longitudinal manner this might become a powerful aid to the steroidal module 89 .
Steroid concentrations in blood and serum
Especially in those individuals with the above-mentioned del/del polymorphism of the UGT2B17, the sensitivity of the markers of the urinary steroid profile was found to be limited. As this polymorphism only affects the phase-II-metabolism, i. e. the glucuronidation prior to urinary excretion, serum samples might offer an alternative in those individuals and in general. Several methods were developed in recent years based on analytical approaches coming from clinical applications employing liquid chromatography/mass spectrometry due to the increased sensitivity necessary for serum steroids 91 92 93 94 95 96 . These methods will allow for expanding the analytical properties of the steroidal module and, taking into account first results, will be applicable in a longitudinal manner comparable to the steroidal module 93 96 . The main drawback associated with serum samples is the more invasive and expensive sample collection compared to urine specimen. A possible alternative here may offer the substitution of serum with dried blood spots (DBS). But as here only 10–20 µL of whole blood is collected, the sensitivity necessary for a steroid profile will pose a challenge, but both approaches can be expected to become an interesting complement to the current ABP.
Another drawback which should be considered is the missing possibility for confirmation procedures on samples found with an atypical steroid profile as the IRMS approach will not straightforwardly be applicable to blood due to the low absolute amount or steroids found in either DBS or serum. Regarding serum, concentrations of more abundant metabolites will be sufficient for an IRMS analysis, and recently a method has been developed addressing these challenges 97 .
A different aspect for doping controls employing blood, serum and DBS as matrices is the detection of intact steroid esters 98 99 100 101 102 . The unequivocal benefit of this approach is the exogenous nature of all possible steroid esters. T and prohormones of T do not occur in human metabolism esterified, and if they are detected, they can be directly linked to an anti-doping rule violation. Therefore, this offers the opportunity to confirm atypical passport findings if other analytical approaches like IRMS fail. This may happen under circumstances where the steroid ester applied by the athlete shows an endogenous or at least close to endogenous CIR. Several preparations have been confirmed with these unusual enriched isotopic ratios 103 104 . But even for T-applications with non-esterified steroids possible solution for enriched CIR have been considered and investigated as summarized in the next paragraph.
Enriched carbon isotope ratios found in steroid preparations
Early investigations on CIR of steroid preparations and the first results obtained on endogenous urinary steroids demonstrated that artificial pharmaceutical preparations show depleted CIR compared to endogenous steroids 12 14 105 . Further investigations encompassing a larger athlete population covering a wide spectrum of different geographic origins indicated a broad distribution of isotopic ratios 16 . A comparison between the CIR at natural abundance especially for athletes of Northern European origin showed a distinctive overlap between the distributions of values found endogenously and in pharmaceutical preparations 16 103 104 As the steroidal module has been set up to detect atypical steroid profiles in order to confirm these by investigations in CIR, this overlap constitutes a challenge for doping controls.
One possible alternative was to investigate the other abundant element in steroids – hydrogen 106 . Analogously to the investigations performed on CIR, a suitable method was developed, validated and reference population-derived thresholds were established. In principle, the approach was found suitable for sports drug testing and already demonstrated the ability to differentiate between endogenous and exogenous sources of urinary steroids. The main drawback which has to be considered is the relatively strong overlap of hydrogen isotope ratios (HIR) found between the endogenous distribution and values found for T-preparations 103 106 . The HIR in the investigated reference population fall between –240 and –280%, and pharmaceutical preparations were found between –170 and –260% with the majority of samples at –230%. Taking into account the measurement uncertainty and the safety margins applied to population based thresholds, the probability to misuse a T-preparation that will not differ significantly from the endogenous HIR is relatively large.
Another scientific approach to enhance the detectability of preparations with CIR close to endogenous ones was the application of a longitudinal profile for CIR in parallel to the ABP 107 . By this approach it is possible to define individual thresholds that are more sensitive towards the detection of exogenous steroids. And with individual thresholds as close as ± 0.8% to the mean the detection of T-preparations closely related to the endogenous CIR become much more likely. The main drawback with this technique is the relatively large number of samples necessary to build the “isotopic module” and the presumable larger scatter of data between different laboratories as the harmonization of IRMS measurements was found more complicated compared to concentration determinations.
A recent approach was aiming at a combination of steroid concentrations and CIR especially of those endogenous steroids easy to measure regarding IRMS, i. e. ETIO and A 108 . An example obtained for this approach is given in Fig. 13 . The calculated parameter named Deviation (ETIO) is intra-individually stable and allows for the calculation of individual thresholds by adding the threefold SD to the mean. After the administration of 100 mg T (CIR of –28.5 %) the equilibrium of concentration ratios and isotopic ratios is significantly disturbed, resulting in the abnormal values for Deviation (ETIO). As this approach is not relying on absolute CIR but only on differences in-between different steroids it should also be applicable for administrations of steroids encompassing a CIR comparable to endogenous ones. Further research is ongoing here in order to evaluate the possibilities of this novel approach.
Fig. 13.

Results obtained on a combination of urinary carbon isotope ratios and steroid concentrations (Deviation (ETIO)) after oral application of 100 mg of T at t = 0. The dashed lines indicate individual thresholds for Deviation (ETIO). Further information in the text.
Conclusion
By implementing the steroidal module into the ABP numerous challenges in sports drug testing have been addresses. While the principle of longitudinal steroid profiling has already been employed in the detection of abnormal steroid profiles more or less from the beginning on, the broad application of this technique became possible only with its implementation into the ABP.
The sensitivity of the steroid profile to detect steroid administrations was straightforwardly improved by employing individual thresholds for each athlete enabling to detect those with naturally low or high T/E ratios. Especially in those individuals with a low T/E the implementation of the complement 5αADIOL/E ratio further improved the detection of low-dose T administrations.
Numerous confounding factors to the steroid profile demonstrated distinct patterns in the steroidal module and should always be considered during the evaluation of ABP cases. The potential to detect sample substitutions committed by individual athletes proved to be an interesting and until now underestimated feature of the longitudinal profile. In combination with DNA analysis, anti-doping rule violations can be established.
The existing ABP approach may be further improved by application of multivariate statistics or complemented by steroid concentrations determined in blood or serum in a longitudinal manner. Here research is ongoing and may show promising results in the near future.
Acknowledgements
The authors thank the Ministry of the Interior, Building and Community (Berlin, Germany) and the Manfred-Donike Institute for Doping Analysis (Cologne, Germany) for supporting the presented work.
Footnotes
Conflict of Interest The authors declare no conflict of interests and the manuscript was written based on the IJSM ethical standards 109 .
References
- 1.Donike M, Zimmer J. Zur Darstellung von Trimethylsilyl-, Triethylsilyl- und tert.-Butyldimethyl-silyl-enoläthern von Ketosteroiden für gas-chromatographische und massenspektroskopische Untersuchungen. J Chromatogr A. 1980;202:483–486. [Google Scholar]
- 2.Donike M, Bärwald K R, Klosterman K.Nachweis von exogenem Testosteron. Sport: Leistung und GesundheitIn: Heck H, Hollmann W, Liesen H, Rost R, Eds.Köln: Deutscher Ärzteverlag; 1983293–298. [Google Scholar]
- 3.Shackelton CH L, Charro-Salgado A L, Mitchel F L. Urinary neutral steroid profile analysis in adults and infants. Clin Chim Acta. 1968;24:105–118. doi: 10.1016/0009-8981(68)90017-x. [DOI] [PubMed] [Google Scholar]
- 4.Pfeiffer P, Spiteller G. Steroid profiles of healthy individuals. J Chromatogr B Biomed Appl. 1981;223:21–32. doi: 10.1016/s0378-4347(00)80064-x. [DOI] [PubMed] [Google Scholar]
- 5.Baba S, Shinohara Y, Kasuya Y. Differentiation between endogenous and exogenous testosterone in human plasma and urine after oral administration of deuterium-labeled testosterone by mass fragmentography. J Clin Enocrin Metab. 1980;50:889–894. doi: 10.1210/jcem-50-5-889. [DOI] [PubMed] [Google Scholar]
- 6.Shinohara Y, Baba S, Kasuya Y. Absorption, metabolism, and excretion of oral testosterone in humans by mass fragmentography. J Clin Enocrin Metab. 1980;51:1459–1462. doi: 10.1210/jcem-51-6-1459. [DOI] [PubMed] [Google Scholar]
- 7.Ueki M, Okano M. Doping with naturally occurring steroids. J Toxicol Toxin Rev. 1999;18:177–195. [Google Scholar]
- 8.Ayotte C, Goudreault D, Charlebois A. Testing for natural and synthetic anabolic agents in human urine. J Chromatogr B Biomed Appl. 1996;687:3–25. doi: 10.1016/s0378-4347(96)00032-1. [DOI] [PubMed] [Google Scholar]
- 9.de la Torre X, Segura J, Yang Z. Köln: Sport und Buch Strauß; 1997. Testosterone detection in different ethnic groups. Recent Advances in Doping Analysis (4) pp. 71–89. [Google Scholar]
- 10.Geyer H, Mareck-Engelke U, Schänzer W.The Cologne Protocol to Follow up High Testosterone/Epitestosterone Ratios. Recent Advances in Doping Analysis (4)In: Schänzer W, Geyer H, Gotzmann A, Mareck-Engelke U Eds.Köln: Sport und Buch Strauß; 1997107–125. [Google Scholar]
- 11.Donike M, Ueki M, Kuroda Y et al. Detection of dihydrotestosterone (DHT) doping: alterations in the steroid profile and reference ranges for DHT and ist 5α-metabolites. J Sports Med Phys Fitness. 1995;35:235–250. [PubMed] [Google Scholar]
- 12.Becchi M, Aguilera R, Farizon Y et al. Gas chromatograhy/combustion/isotope ratio mass spectrometry analysis of urinary steroids to detect misuse of testosterone in sport. Rapid Commun Mass Spectrom. 1994;8:304–308. doi: 10.1002/rcm.1290080404. [DOI] [PubMed] [Google Scholar]
- 13.Ueki M, Okano M. Analysis of exogenous dehydroepiandrosterone excretion in urine by gas chromatography/combustion/isotope ratio mass spectrometry. Rapid Commun Mass Spectrom. 1999;13:2237–2243. doi: 10.1002/(SICI)1097-0231(19991130)13:22<2237::AID-RCM780>3.0.CO;2-C. [DOI] [PubMed] [Google Scholar]
- 14.Piper T, Emery C, Saugy M. Recent developments in the use of isotope ratio mass spectrometry in sports drug testing. Anal Bioanal Chem. 2011;401:433–447. doi: 10.1007/s00216-011-4886-6. [DOI] [PubMed] [Google Scholar]
- 15.WADA Laboratory Committee. WADA Technical Document – TD2004EAAShttps://www.wada-ama.org/sites/default/files/resources/files/WADA-TD2004-EAAS-Reporting-and-Evaluation-Guidance-for-Testosterone%2C-Epitestosterone%2C-T-E-Ratio-and-Other-Endogenous-Steroids.pdf Accessed 23.11.2020
- 16.Piper T, Flenker U, Mareck U. 13 C/ 12 C Ratios of endogenous urinary steroids investigated for doping control purposes . Drug Test Anal. 2009;1:65–72. doi: 10.1002/dta.15. [DOI] [PubMed] [Google Scholar]
- 17.WADA Laboratory Expert Group. WADA Technical Document – TD2014EAAShttps://www.wada-ama.org/sites/default/files/resources/files/wada-td2014eaas-v1.0-endogenous-anabolic-androgenic-steroids-measurement-and-reporting-en.pdf Accessed 23.11.2020
- 18.WADA Laboratory Expert Group. WADA Technical Document – TD2018EAAShttps://www.wada-ama.org/sites/default/files/resources/files/td2018eaas_final_eng.pdf Accessed 23.11.2020
- 19.Sottas P E, Baume N, Saudan C et al. Bayesian detection of abnormal values in longitudinal biomarkers with an application to T/E ratio. Biostatistics. 2007;8:285–296. doi: 10.1093/biostatistics/kxl009. [DOI] [PubMed] [Google Scholar]
- 20.Sottas P E, Saugy M, Saudan C. Endogenous Steroid Profiling in the Athlete Biological Passport. Endocrinol Metab Clin N Am. 2010;39:59–73. doi: 10.1016/j.ecl.2009.11.003. [DOI] [PubMed] [Google Scholar]
- 21.WADA. WADA Technical Document – TD2021APMUhttps://www.wada-ama.org/sites/default/files/resources/files/td2021apmu_final_eng.pdf Accessed 25.02.2021
- 22.Jakobsson J, Ekström L, Inotsume N et al. Large differences in testosterone excretion in Korean and Swedish men are strongly associated with a UDP-glucuronosyl transferase 2B17 Polymorphism. J Clin Endocrinol Metab. 2006;91:687–693. doi: 10.1210/jc.2005-1643. [DOI] [PubMed] [Google Scholar]
- 23.Strahm E, Sottas P E, Schweizer C et al. Steroid profiles of professional soccer players: An international comparative study. Br J Sports Med. 2009;43:1126–1130. doi: 10.1136/bjsm.2008.056242. [DOI] [PubMed] [Google Scholar]
- 24.Okano M, Ueda T, Nishitani Y et al. UDP-glucuronosyltransferase 2B17 genotyping in Japanese athletes and evaluation of the current sports drug testing for detecting testosterone misuse. Drug Test Anal. 2013;5:166–181. doi: 10.1002/dta.1394. [DOI] [PubMed] [Google Scholar]
- 25.WADA. 2019 anti-doping testing figureshttps://www.wada-ama.org/sites/default/files/resources/files/2019_anti-doping_testing_figures_en.pdf accessed 23.12.2020
- 26.Schulze J J, Lundmark J, Garle M et al. Doping test results dependent on genotype of uridine diphospho-glucuronosyl transferase 2B17, the major enzyme for testosterone glucuronidation. J Clin Endocrinol Metab. 2008;93:2500–2506. doi: 10.1210/jc.2008-0218. [DOI] [PubMed] [Google Scholar]
- 27.Strahm E, Mullen J E, Garevik N et al. Dose-dependent testosterone sensitivity of the steroidal passport and GC-C-IRMS analysis in relation to the UGT2B17 deletion polymorphism. Drug Test Anal. 2015;7:1063–1070. doi: 10.1002/dta.1841. [DOI] [PubMed] [Google Scholar]
- 28.Nair V S, Husk J, Miller G D et al. Evaluation of longitudinal steroid profiling with the ADAMS adaptive model for detection of transdermal, intramuscular, and subcutaneous testosterone administration. Drug Test Anal. 2020;12:1419–1431. doi: 10.1002/dta.2885. [DOI] [PubMed] [Google Scholar]
- 29.Mullen J, Börjesson A, Hopcraft O et al. Sensitivity of doping biomarkers after administration of a single dose testosterone gel. Drug Test Anal. 2018;10:839–848. doi: 10.1002/dta.2341. [DOI] [PubMed] [Google Scholar]
- 30.Buisson C, Frelat C, Privat K et al. Metabolic and isotopic signature of short-term DHEA administration in women: Comparison with findings in men. Drug Test Anal. 2018;10:1744–1754. doi: 10.1002/dta.2519. [DOI] [PubMed] [Google Scholar]
- 31.Geyer H, Fusshoeller G, Haenelt N.The ratio 5aAdiol/E as indicator for the detection of T-doping in athletes with naturally low T/E – a case study. In: Thevis M, Geyer H, Mareck U Eds Recent Advances In Doping Analysis (28) Köln: Sport und Buch Strauß; 2020. in press [Google Scholar]
- 32.Mareck-Engelke U, Geyer H, Donike M. Köln: Sport und Buch Strauß; 1993. Stability of steroid profiles. Recent Advances in Doping Analysis pp. 87–89. [Google Scholar]
- 33.Mareck-Engelke U, Geyer H, Donike M.Stability of Steroid Profiles (4): The circadian rhythm of urinary ratios and excretion rates of endogenous steroids in female and its menstrual dependency. Recent Advances in Doping Analysis (2)In: Donike M, Geyer H, Gotzmann A, Mareck-Engelke U Eds.Köln: Sport und Buch Strauß; 1995135–155. [Google Scholar]
- 34.Mareck-Engelke U, Flenker U, Schänzer W. Köln: Sport und Buch Strauß; 1997. Stability of steroid profiles (6): The Influence of oral contraceptives on steroid profiles. Recent Advances in Doping Analysis (4) pp. 139–157. [Google Scholar]
- 35.Ekström L, Knutsson J E, Mullen J et al. Impact of hormonal contraceptives on urinary steroid profile in relation to serum hormone changes and CYP17A1 polymorphism. Drug Test Anal. 2019;11:1284–1289. doi: 10.1002/dta.2663. [DOI] [PubMed] [Google Scholar]
- 36.Schulze J, Suominen T, Bergström H et al. Urinary steroid profile in relation to the menstrual cycle. Drug Test Anal. 2020 doi: 10.1002/dta.2960. [DOI] [PMC free article] [PubMed] [Google Scholar]
- 37.Southan G J, Brooks R V, Cowan D A et al. Possible indices for the detection of the administration of dihydrotestosterone to athletes. J Steroid Biochem Molec Biol. 1992;42:87–94. doi: 10.1016/0960-0760(92)90014-a. [DOI] [PubMed] [Google Scholar]
- 38.Kicman A T, Coutts S B, Walker C J. Proposed confirmatory procedure for detecting 5α-dihydrotestosterone doping in male athletes. Clin Chem. 1995;41:1617–1627. [PubMed] [Google Scholar]
- 39.Piper T, Putz M, Schänzer W et al. Epiandrosterone sulfate prolongs the detectability of testosterone, 4-androstenedione, and dihydrotestosterone misuse by means of carbon isotope ratio mass spectrometry. Drug Test Anal. 2017;9:1695–1703. doi: 10.1002/dta.2291. [DOI] [PubMed] [Google Scholar]
- 40.Mareck U, Geyer H, Opfermann G et al. Factors influencing the steroid profile in doping control analysis. J Mass Spectrom. 2008;43:877–891. doi: 10.1002/jms.1457. [DOI] [PubMed] [Google Scholar]
- 41.Kuuranne T, Saugy M, Baume N. Confounding factors and genetic polymorphism in the evaluation of individual steroid profiling. Br J Sports Med. 2014;48:848–855. doi: 10.1136/bjsports-2014-093510. [DOI] [PMC free article] [PubMed] [Google Scholar]
- 42.Cronholm T, Sjövall J. Effect of ethanol on the concentrations of solvolyzable plasma steroids. Biochim Biophys Acta. 1968;152:233–236. doi: 10.1016/0005-2760(68)90030-1. [DOI] [PubMed] [Google Scholar]
- 43.Falk O, Palonek E, Björkhem I. Effect of Ethanol on the Ratio between Testosterone and Epitestosterone in Urine. Clin Chem. 1988;34:1462–1464. [PubMed] [Google Scholar]
- 44.Mareck-Engelke U, Geyer H. Köln: Sport und Buch Strauß; 1996. Influence of ethanol on steroid profile parameters. Recent Advances in Doping Analysis (3) pp. 143–155. [Google Scholar]
- 45.Seppenwoolde-Waasdorp TJ A, de Boer D, Van Engelen HM J. Köln: Sport und Buch Strauß; 1996. Evaluation of endogenous steroid profiles in urine (2) effects of ethanol intake reinvestigated. Recent Advances in Doping Analysis (3) pp. 157–165. [Google Scholar]
- 46.Thieme D, Grosse J, Keller L, Graw M. Urinary concentrations of ethyl glucuronide and ethyl sulfate as thresholds to determine potential ethanol-induced alteration of steroid profiles. Drug Test Anal. 2011;3:851–856. doi: 10.1002/dta.396. [DOI] [PubMed] [Google Scholar]
- 47.Albeiroti S, Ahrens B D, Sobolevskii T. The influence of small doses of ethanol on the urinary testosterone to epitestosterone ratio in men and women. Drug Test Anal. 2018;10:575–583. doi: 10.1002/dta.2241. [DOI] [PubMed] [Google Scholar]
- 48.Geyer H, Mareck U, Haenelt N. Köln: Sport und Buch Strauß; 2009. Atypical steroid profiles in connection with ethanol findings in urine. Recent Advances In Doping Analysis (17) pp. 261–264. [Google Scholar]
- 49.Mullen J E, Thörngren J O, Schulze J J et al. Urinary steroid profile in females - the impact of menstrual cycle and emergency contraceptives. Drug Test Anal. 2017;9:1034–1042. doi: 10.1002/dta.2121. [DOI] [PubMed] [Google Scholar]
- 50.Freeman D A. Steroid hormone-producing tumors in man. Endocr Rev. 1986;2:204–220. doi: 10.1210/edrv-7-2-204. [DOI] [PubMed] [Google Scholar]
- 51.Bassi F, Giusti G, Borsi L et al. Plasma androgens in women with hyperprolactiaemic amenorrhoea. Clin Endocrinol. 1977;6:5–10. doi: 10.1111/j.1365-2265.1977.tb01990.x. [DOI] [PubMed] [Google Scholar]
- 52.Lobo R A, Kletzky O A. Normalization of androgen and sex hormone-binding globulin levels after treatment of hyperprolactinemia. J Clin Endocrinol Metab. 1983;56:562–566. doi: 10.1210/jcem-56-3-562. [DOI] [PubMed] [Google Scholar]
- 53.Lee S H, Nam S Y, Chung B C. Altered profile of endogeneous steroids in the urine of patients with prolactinoma. Clin Biochem. 1998;31:529–535. doi: 10.1016/s0009-9120(98)00063-0. [DOI] [PubMed] [Google Scholar]
- 54.Magrini G, Ebiner J R, Burckhardt P. Study on the relationship between plasma prolactin levels and androgen metabolism in man. J Clin Endocrinol Metab. 1976;43:944–947. doi: 10.1210/jcem-43-4-944. [DOI] [PubMed] [Google Scholar]
- 55.Bernini G P, Gasperi M, Franchi F et al. Effects of sulpiride induced hyperprolactinemia on testosterone secretion and metabolism before and after HCG in normal men. J Endocrinol Invest. 1983;6:287–291. doi: 10.1007/BF03347591. [DOI] [PubMed] [Google Scholar]
- 56.Roke Y, van Harten P N, Buitelaar J K et al. Antipsychotic-induced hyperprolactinemia and testosterone levels in boys. Horm Res Paediatr. 2012;77:235–240. doi: 10.1159/000337910. [DOI] [PubMed] [Google Scholar]
- 57.La Torre D, Falorni A. Pharmacological causes of hyperprolactinemia. Ther Clin Risk Manag. 2007;3:929–951. [PMC free article] [PubMed] [Google Scholar]
- 58.Sapolsky R M, Romero L M, Munck A U. How do glucocorticoids influence stress responses? integrating permissive, suppressive, stimulatory, and preparative actions. Endocr Rev. 2000;21:55–89. doi: 10.1210/edrv.21.1.0389. [DOI] [PubMed] [Google Scholar]
- 59.Charmandari E, Tsigos C, Chrousos G. Endocrinology of the stress response. Annu Rev Physiol. 2005;67:259–284. doi: 10.1146/annurev.physiol.67.040403.120816. [DOI] [PubMed] [Google Scholar]
- 60.Romero L M, Butler L K. Endocrinology of stress. Int J Comp Psychol. 2007;20:89–95. [Google Scholar]
- 61.Cuezennec C Y, Lafarge J P, Bricout V A et al. Effect of competition stress on tests used to assess testosterone administration in athletes. Int J Sports Med. 1995;16:368–372. doi: 10.1055/s-2007-973022. [DOI] [PubMed] [Google Scholar]
- 62.Neave N, Wolfson S. Testosterone, territoriality, and the ‘home advantage’. Physiol Behav. 2003;78:269–275. doi: 10.1016/s0031-9384(02)00969-1. [DOI] [PubMed] [Google Scholar]
- 63.Carré J M. No Place Like Home: Testosterone Responses to Victory Depend on Game Location. Am J Hum Biol. 2009;21:392–394. doi: 10.1002/ajhb.20867. [DOI] [PubMed] [Google Scholar]
- 64.R Core Team (2017). R: A language and environment for statistical computing. R Foundation for Statistical Computing, Vienna, Austria URL Accessed 07.12.2020
- 65.Kjeld J M, Puah C M, Joplin G F. Rise of unconjugated sex hormones in human urine on storage. Clin Chim Acta. 1977;80:285–291. doi: 10.1016/0009-8981(77)90035-3. [DOI] [PubMed] [Google Scholar]
- 66.Hemmersbach P, Birkeland K I, Norli H R. Köln: Sport und Buch Strauß; 1997. Urine storage conditions and steroid profile analysis. Recent Advances in Doping Analysis (4) pp. 99–107. [Google Scholar]
- 67.Ayotte C, Charlebois A, Lapointe S. Köln: Sport und Buch Strauß; 1997. Validity of urine samples: microbial degradation. Recent Advances in Doping Analysis (4) pp. 127–137. [Google Scholar]
- 68.De la Torre R, de la Torre X, Alia C et al. Changes in androgenic steroid profile due to urine contamination by microorganisms: A prospective study in the context of doping control. Anal Biochem. 2001;289:116–123. doi: 10.1006/abio.2000.4918. [DOI] [PubMed] [Google Scholar]
- 69.Tsivou M, Livadra D, Georgakopoulos D G et al. Stabilization of human urine doping control samples: II. Microbial degradation of steroids. Anal Biochem. 2009;388:146–154. doi: 10.1016/j.ab.2009.02.013. [DOI] [PubMed] [Google Scholar]
- 70.Ojanperä S, Leinonen A, Apajalahti J et al. Characterization of microbial contaminants in urine. Drug Test Anal. 2010;2:576–581. doi: 10.1002/dta.202. [DOI] [PubMed] [Google Scholar]
- 71.Mazzarino M, Abate M G, Alocci R et al. Urine stability and steroid profile: Towards a screening index of urine sample degradation for anti-doping purpose. Anal Chim Acta. 2011;683:221–226. doi: 10.1016/j.aca.2010.10.003. [DOI] [PubMed] [Google Scholar]
- 72.Piper T, Geyer H, Schänzer W. Degradation of urine samples and its influence on the 13 C/ 12 C ratios of excreted steroids . Drug Test Anal. 2010;2:620–629. doi: 10.1002/dta.219. [DOI] [PubMed] [Google Scholar]
- 73.WADA Laboratory Expert Group. WADA Technical Document – TD2019IRMShttps://www.wada-ama.org/sites/default/files/td2019irms_final_eng_clean.pdf accessed 15.12.2020
- 74.Coll S, Matabosch X, Garrotas L et al. Effect of glucocorticoid administration on the steroid profile. Drug Test Anal. 2018;10:947–955. doi: 10.1002/dta.2351. [DOI] [PubMed] [Google Scholar]
- 75.Mazzarino M, Bragano M C, de la Torre X et al. Relevance of the selective oestrogen receptor modulators tamoxifen, toremifene and clomiphene in doping field: endogenous steroids urinary profile after multiple oral doses. Steroids. 2011;76:1400–1406. doi: 10.1016/j.steroids.2011.06.005. [DOI] [PubMed] [Google Scholar]
- 76.Coll S, Matabosch X, Garrotas L et al. The effect of tea consumption on the steroid profile. Drug Test Anal. 2018;10:1438–1447. doi: 10.1002/dta.2392. [DOI] [PubMed] [Google Scholar]
- 77.Piper T, Heimbach S, Adamczewski M.An in vitro assay approach to investigate the potential impact of different doping agents on the steroid profile Drug Test Anal 20201–13.Online ahead of print 10.1002/dta.2991 [DOI] [PubMed] [Google Scholar]
- 78.Thevis M, Geyer H, Mareck U et al. Doping-control analysis of the 5α-reductase inhibitor finasteride: determination of its influence on urinary steroid profiles and detection of its major urinary metabolites. Ther Drug Monit. 2007;29:236–247. doi: 10.1097/FTD.0b013e31803bb85d. [DOI] [PubMed] [Google Scholar]
- 79.World Anti-Doping Agency. Prohibited List – January 2020 Accessed 08.12.2020
- 80.Thevis M, Geyer H, Sigmund G et al. Sports drug testing: Analytical aspects of selected cases of suspected, purported, and proven urine manipulation. J Pharm Biomed Anal. 2012;57:26–32. doi: 10.1016/j.jpba.2011.09.002. [DOI] [PubMed] [Google Scholar]
- 81.Thevis M, Krug O, Geyer H et al. Analytical challenges in sports drug testing. Anal Bioanal Chem. 2018;410:2275–2281. doi: 10.1007/s00216-018-0934-9. [DOI] [PubMed] [Google Scholar]
- 82.Geyer H, Berschick P, Mareck-Engelke U. Vol. 301 Köln: Sport und Buch Strauß; 1998. DNA Typing for the confirmation of manipulation in dope control. Recent advances in doping analysis (5) [Google Scholar]
- 83.Thevis M, Geyer H, Mareck U et al. Detection of manipulation in doping control urine sample collection: a multidisciplinary approach to determine identical urine samples. Anal Bioanal Chem. 2007;399:1539–1543. doi: 10.1007/s00216-006-1112-z. [DOI] [PubMed] [Google Scholar]
- 84.van Renterghem P, van Eenoo P, Geyer H et al. Reference ranges of urinary concentrations and ratios of endogenous steroids, which can be used as markers for steroid misuse, in a Caucasian population of athletes. Steroids. 2010;75:154–163. doi: 10.1016/j.steroids.2009.11.008. [DOI] [PubMed] [Google Scholar]
- 85.van Eenoo P, Sottas P E.van RenterghemA pilot study on subject-based comprehensive steroid profiling: novel biomarkers to detect testosterone misuse in sports Clin Endocrinol (Oxf) 201175134–140. [DOI] [PubMed] [Google Scholar]
- 86.Polet M, Van Renterghem P, Van Gansbeke W. Studies on the minor metabolite 6α-hydroxy-androstenedione for doping control puposes and ist contribution to the steroid profile. Drug Test Anal. 2014;6:978–984. doi: 10.1002/dta.1618. [DOI] [PubMed] [Google Scholar]
- 87.Kotronoulasa A, Gomez-Gómez À, Fabregat A et al. Evaluation of markers out of the steroid profile for the screening of testosterone misuse. Part I: transdermal administration. Drug Test Anal. 2018;10:821–831. doi: 10.1002/dta.2338. [DOI] [PubMed] [Google Scholar]
- 88.Esquivel A, Alechaga E, Monfort N et al. Evaluation of sulfate metabolites as markers of intramuscular testosterone administration in Caucasian and Asian populations. Drug Test Anal. 2019;11:1218–1230. doi: 10.1002/dta.2598. [DOI] [PubMed] [Google Scholar]
- 89.Amante E, Pruner S, Alladio E et al. Multivariate interpretation of the urinary steroid profile and training-induced modifications. The case study of a marathon runner. Drug Test Anal. 2019;11:1556–1565. doi: 10.1002/dta.2676. [DOI] [PubMed] [Google Scholar]
- 90.Saad K, Vonaparti A, Athanasiadou I et al. Population reference ranges of urinary endogenous sulfate steroids concentrations and ratios as complement to the steroid profile in sports antidoping. Steroids. 2019;152:108477. doi: 10.1016/j.steroids.2019.108477. [DOI] [PubMed] [Google Scholar]
- 91.French D. Advances in bioanalytical techniques to measure steroid hormones in serum. Bioanalysis. 2016;8:1203–1219. doi: 10.4155/bio-2015-0025. [DOI] [PubMed] [Google Scholar]
- 92.Ponzetto F, Mehl F, Boccard J et al. Longitudinal monitoring of endogenous steroids in human serum by UHPLC-MS/MS as a tool to detect testosterone abuse in sports. Anal Bioanal Chem. 2016;408:705–719. doi: 10.1007/s00216-015-9185-1. [DOI] [PubMed] [Google Scholar]
- 93.Handelsman D J, Bermon S. Detection of testosterone doping in female athletes. Drug Test Anal. 2019;11:1566–1571. doi: 10.1002/dta.2689. [DOI] [PubMed] [Google Scholar]
- 94.Elmongy H, Masquelier M, Ericsson M. Development and validation of a UHPLC-HRMS method for the simultaneous determination of the endogenous anabolic androgenic steroids in human serum. J Chromatogr A. 2020;1613:460686. doi: 10.1016/j.chroma.2019.460686. [DOI] [PubMed] [Google Scholar]
- 95.Salamin O, Ponzetto F, Cauderay M et al. Development and validation of an UHPLC–MS/MS method for extended serum steroid profiling in female populations. Bioanalysis. 2020;12:753–768. doi: 10.4155/bio-2020-0046. [DOI] [PubMed] [Google Scholar]
- 96.Knutsson J E, Andersson A, Baekken L V et al. Disposition of urinary and serum steroid metabolites in response to testosterone administration in healthy women. J Clin Endocrinol Metab. 2021;106:697–707. doi: 10.1210/clinem/dgaa904. [DOI] [PubMed] [Google Scholar]
- 97.Piper T, Geyer H, Nieschlag E Carbon isotope ratios of endogenous steroids found in human serum – method development, validation and reference population derived thresholds submitted to Anal Bioanal Chem. [DOI] [PMC free article] [PubMed]
- 98.
- 99.Forsdahl G, Vatne H K, Geisendorfer T. Screening of testosterone esters in human plasma. Drug Test Anal. 2013;5:826–833. doi: 10.1002/dta.1560. [DOI] [PubMed] [Google Scholar]
- 100.Tretzel L, Thomas A, Geyer H et al. Use of dried blood spots in doping control analysis of anabolic steroid esters. J Pharm Biomed Anal. 2014;96:21–30. doi: 10.1016/j.jpba.2014.03.013. [DOI] [PubMed] [Google Scholar]
- 101.Forsdahl G, Erceg D, Geisendorfer T et al. Detection of testosterone esters in blood. Drug Test Anal. 2015;7:983–989. doi: 10.1002/dta.1914. [DOI] [PubMed] [Google Scholar]
- 102.De la Torre X, Iannone M, Botre F. Improving the detection of anabolic steroid esters in human serum by LC-MS. J Pharm Biomed Anal. 2021;194:113807. doi: 10.1016/j.jpba.2020.113807. [DOI] [PubMed] [Google Scholar]
- 103.Cawley A, Collins M, Kazlauskas R et al. Stable isotope ratio profiling of testosterone preparations. Drug Test Anal. 2010;2:557–567. doi: 10.1002/dta.175. [DOI] [PubMed] [Google Scholar]
- 104.Forsdahl G, Östreicher C, Koller M, Gmeiner G. Carbon isotope ratio determination and investigation of seized testosterone preparations. Drug Test Anal. 2011;3:814–819. doi: 10.1002/dta.373. [DOI] [PubMed] [Google Scholar]
- 105.de la Torre X, Gonzáles J C, Pichini S et al. 13 C/ 12 C Isotope Ratio MS analysis of testosterone, in chemicals and pharmaceutical preparations . J Pharm Biomed Anal. 2001;24:645–650. doi: 10.1016/s0731-7085(00)00452-0. [DOI] [PubMed] [Google Scholar]
- 106.Piper T, Thomas A, Thevis M et al. Investigations on hydrogen isotope ratios of endogenous urinary steroids: reference population- based thresholds and proof-of-concept. Drug Test Anal. 2012;4:717–727. doi: 10.1002/dta.1416. [DOI] [PubMed] [Google Scholar]
- 107.Jardines D, Botrè F, Colamonici C et al. Longitudinal evaluation of the isotope ratio mass spectrometric data: towards the "isotopic module" of the athletic biological passport. Drug Test Analyis. 2016;8:1212–1221. doi: 10.1002/dta.2118. [DOI] [PubMed] [Google Scholar]
- 108.Flenker U, Riemann P, Hülsemann F. Intracrine androgen metabolism. Fundamentals and a new approach to make use of 13 C/ 12 C signals of endogenous Steroids . Recent Advances in Doping Analysis (26)In: Thevis M, Geyer H, Mareck U EdsKöln: Sportverlag Strauß; 201836–42. [Google Scholar]
- 109.Harriss D J, Macsween A, Atkinson G. Ethical standards in sport and exercise science research: 2020 update. Int J Sports Med. 2019;40:813–817. doi: 10.1055/a-1015-3123. [DOI] [PubMed] [Google Scholar]