Abstract
Epigenetic editing is an emerging technology that uses artificial transcription factors (aTFs) to regulate expression of a target gene. Although human genes can be robustly upregulated by targeting aTFs to promoters, the activation induced by directing aTFs to distal transcriptional enhancers is substantially less robust and consistent. Here we show that long-range activation using CRISPR-based aTFs in human cells can be made more efficient and reliable by concurrently targeting an aTF to the target gene promoter. We used this strategy to direct target gene choice for enhancers capable of regulating more than one promoter and to achieve allele-selective activation of human genes by targeting aTFs to SNPs embedded in distally located sequences. Our results broaden the potential applications of the epigenetic editing toolbox for research and therapeutics.
Introduction
Epigenetic editing using aTFs with programmable DNA binding domains enables tunable regulation of target gene expression and has a broad range of potential applications in basic research, synthetic biology, and human therapeutics1–3. To date, robust transcriptional activation using aTFs has been primarily accomplished by targeting these factors to promoter sequences (typically less than +/− 500 bp relative to the transcription start site [TSS]). However, more distally located regulatory sequences such as enhancers, which are enriched for disease-associated single nucleotide polymorphisms (SNPs)4–6, are attractive targets for achieving more complex outcomes such as allele-specific gene activation. Although aTFs have been previously reported to induce activation from enhancers in heterotopic cell settings and other distally located sequences, these efforts have not consistently resulted in efficient target gene activation, with fold-activation levels often much lower than what has been achieved by targeting aTFs to promoters7–14.
Here we show that long-range activation using CRISPR-based aTFs in human cells can be made more consistent and robust by concurrently directing an aTF to the target gene promoter of interest. Importantly, we illustrate how aTF-mediated activation can be used to influence target gene choice for an enhancer sequence known to regulate multiple promoters and provide a first proof-of-concept for allele-selective activation of human genes by targeting aTFs to SNPs embedded in distally located sequences. Our results improve the ability to effectively deploy aTFs for directing long-range gene activation and thereby broaden the potential applications of the epigenetic editing toolbox.
Results
aTFs do not consistently activate from enhancer sequences
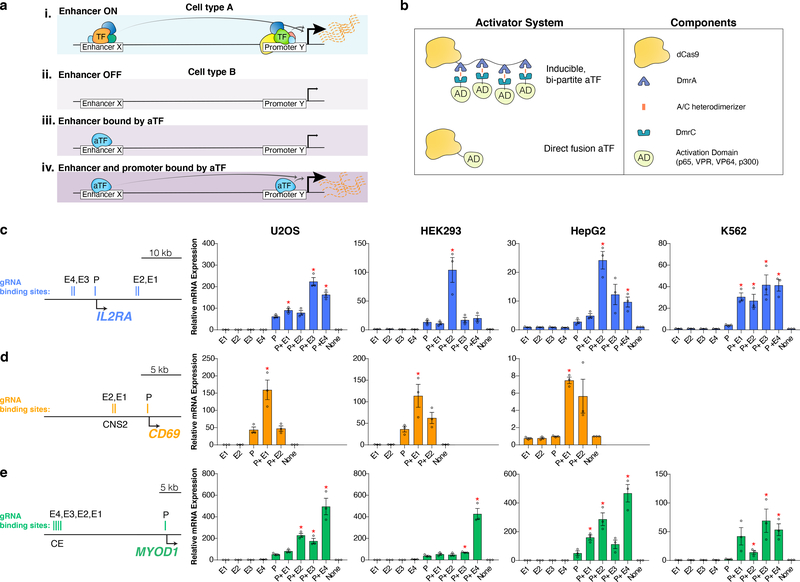
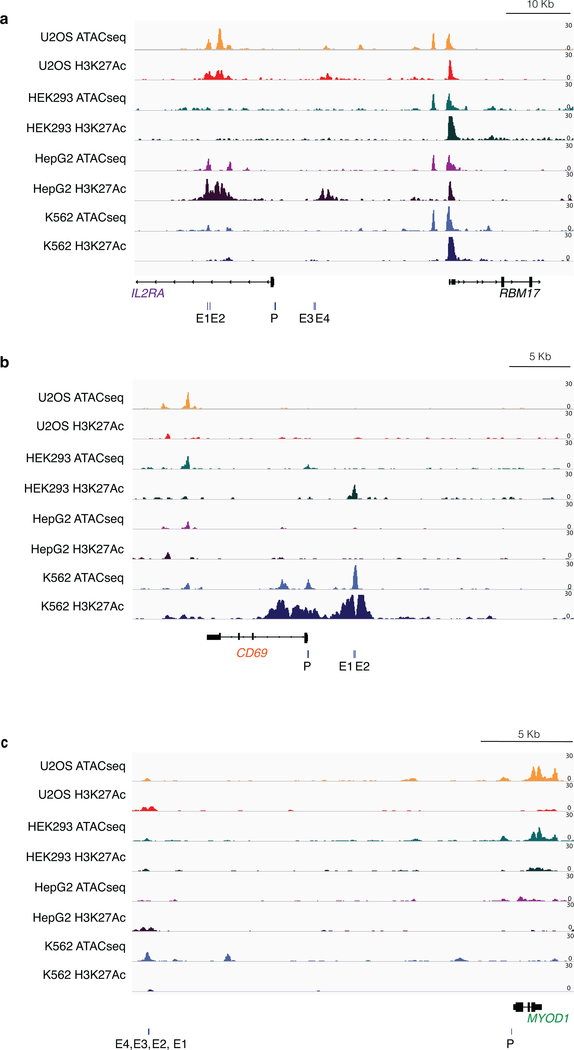
Initially, we identified examples where recruitment of an aTF to a distal sequence does not yield robust activation of the expected target gene, despite these sequences acting as enhancers in other cell types (Fig. 1a (i–iii)). Previous studies have attempted to achieve such heterotopic cell-type activation of enhancers or other distal sequences but did not consistently yield target gene expression of five-fold or more and/or required the use of multiple guide RNAs (gRNAs) to recruit catalytically inactive or “dead” Streptococcus pyogenes Cas9 (dCas9)-based aTFs7–14 (Supplementary Note). We targeted three endogenous genes (IL2RA, CD69, and MYOD1) that are not expressed at detectable levels as measured by RNA-seq (FPKM values < 2; see Online Methods) in four human cell lines: U2OS, HEK293, HepG2, and K562 (with the exception of CD69, which is moderately expressed in K562 cells, and therefore not tested) (Supplementary Table 1). We used a bi-partite, small molecule-inducible, dCas9-based aTF consisting of two components: dCas9 fused to four DmrA (DmrA(x4)) domains and DmrC fused to a NF-κB p65 activation domain (hereafter referred to as the bi-partite p65 aTF)15. DmrA and DmrC domains are fragments of the FK506-binding protein (FKBP) and FKBP-rapamycin-binding protein (FRB), respectively, and interact only in the presence of a rapamycin analog known as the A/C heterodimerizer (Fig. 1b). The bi-partite p65 aTF provides a robust activator that can recruit multiple copies of an activation domain using a single gRNA. For IL2RA, we designed gRNAs to direct this aTF to two sequences known to be functional enhancers in T cells14 that are located ~5 kb upstream or ~10 kb downstream of the TSS (Fig. 1c). These targeted sequences are present in inactive, closed chromatin in HEK293 and K562 cells and in open chromatin with H3K27Ac marks in U2OS and HepG2 cells (Extended Data Fig. 1a). Testing of individual gRNAs targeted to each of these two regions (Fig. 1c) did not yield a significant increase in IL2RA transcription in any of the four cell lines (Fig. 1c, Online Methods). Similarly, we did not observe activation of CD69 in U2OS, HEK293, and HepG2 cells when we used the bi-partite p65 aTF with single gRNAs targeting an upstream conserved non-coding sequence 2 (CNS2) known to be a stimulus-responsive enhancer in T-cells16 and present in closed chromatin in these three cell lines (Fig. 1d; Extended Data Fig. 1b). Additionally, we tested the bi-partite p65 aTF with four single gRNAs targeted to a core enhancer (CE) located ~20 kb upstream of the MYOD1 TSS (Fig. 1e), previously shown to be active in myoblasts17, but that resides in inactive, closed chromatin in human HEK293, U2OS, HepG2, and K562 cell lines (Extended Data Fig. 1c). These experiments revealed only modest activation of MYOD1 (~6-fold) with just one of the four gRNAs (E4) in HEK293 and U2OS cells and no significant activation with any of the four gRNAs in HepG2 and K562 cells (Fig. 1e).
Figure 1. Heterotopic activation of enhancer sequences by dCas9-based aTFs in multiple human cell lines.
a, Schematics illustrating: (i) an enhancer X that activates promoter Y in cell type A, (ii) lack of enhancer X activity on promoter Y in a different cell type B, (iii) lack of enhancer X activity on promoter Y in cell type B when an aTF is recruited only to enhancer X, and (iv) robust enhancer X activity on promoter Y in cell type B when aTFs are recruited to both enhancer X and promoter Y.
b, Architectures of dCas9-based bi-partite and direct fusion aTFs used in this study.
c-e, mRNA expression levels of the endogenous IL2RA, CD69 and MYOD1 genes in human cell lines in the presence of the bi-partite p65 aTF and one or more gRNAs targeting enhancer (E1, E2, E3, or E4) or promoter (P) sequences. Relative expression of each gene was measured by RT-qPCR, normalized to HPRT1 levels and calculated relative to that of a control sample (None) expressing a non-targeting gRNA. Open circles indicate biological replicates (n=3), bars the mean of replicates, and error bars the s.e.m. * indicates significantly different from the sample targeting only the promoter, p<0.05 (Student’s t-test, two-tailed test assuming equal variance). The exact p-values are in Source Data for Fig. 1.
Concurrent aTF promoter targeting unlocks enhancer activity
We speculated that the inability to consistently and efficiently induce gene activation from distal enhancer elements with an aTF might be due to the inactive, closed state of the target gene promoter in these heterotopic cell settings (Fig. 1a (iii)) and therefore further envisioned that concurrent targeting of an aTF to both the distal element and the target promoter might yield more reliable and robust activation (Fig. 1a (iv)). Consistent with this idea, we were able to modestly activate MYOD1 from the CE enhancer sequence in U2OS and HEK293 cells (Fig. 1e), in which the promoter exhibited an open architecture and weak H3K27Ac marks (Extended Data Fig. 1c); by contrast, we could not activate MYOD1 with an aTF targeted to the CE enhancer in HepG2 and K562 cells (Fig. 1e), in which the promoter is in closed chromatin (Extended Data Fig. 1c) perhaps rendering it inert to any activating effects. To test this hypothesis, we co-expressed each of the enhancer-targeted gRNAs used in our experiments with IL2RA, CD69, and MYOD1 described above together with a promoter-targeted gRNA (Figs. 1c - 1e), thereby recruiting the bi-partite p65 aTF to both sequences concurrently (Fig. 1a (iv)). In control experiments, we found that these promoter-targeted gRNAs each activated transcription of its target gene (ranges of three- to 62-fold, one- to 44-fold, and two- to 52-fold for IL2RA, CD69, and MYOD1, respectively) across the various cell lines tested (Figs. 1c - 1e). However, co-expression of enhancer- and promoter-targeted gRNAs with the bi-partite p65 aTF led to synergistically higher levels of target gene transcription (i.e., greater levels of expression than the product of activation with each gRNA individually) for nearly all combinations of gRNAs (ranges of 5 to 224-fold, 6- to 160-fold, and 14- to 496-fold for IL2RA, CD69, and MYOD1, respectively) (Figs. 1c - 1e). This represents as much as an additional ten-, eight-, and 32-fold upregulation in expression of IL2RA, CD69, and MYOD1, respectively (Figs. 1c - 1e) that can be attributed to aTF binding to the distal enhancer sequence. Levels of activation we observed with concurrent enhancer-promoter targeting were generally somewhat lower than the synergistic effect observed with two aTFs targeted to the promoter (Supplementary Note; Supplementary Fig. 1). In addition, RNA-seq experiments revealed that the transcriptome-wide specificity of activation with concurrent enhancer-promoter aTF targeting is dependent on the design of the gRNAs and the functional effects of the target genes themselves (Supplementary Note; Supplementary Fig. 2).
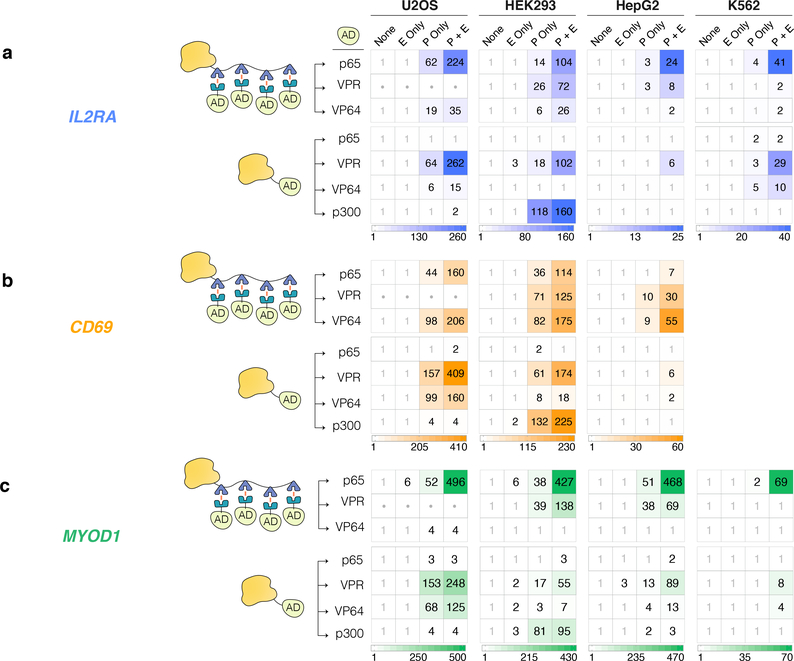
We additionally assessed whether bi-partite aTFs harboring synthetic VPR or VP64 domains and direct fusions of dCas9 to p65, VPR, VP64, or p300 domains (Fig. 1b) could mediate activation from distal sequences with concurrent promoter targeting. For these experiments, we used the same pairs of enhancer-promoter gRNAs we had tested with the bi-partite p65 aTF on IL2RA, CD69, and MYOD1 (Figs. 2a – 2c). In general, we found that bi-partite p65 aTF and direct fusion VPR aTF functioned robustly at all three genes across all cell types tested (Figs. 2a – 2c). Bi-partite VPR, bi-partite VP64, direct fusion VP64, and direct fusion p300 aTFs could also each activate all three gene targets but did so with less consistency across cell lines (although each aTF activated all three target genes in at least one cell type) (Figs. 2a – 2c). Bi-partite VPR aTF showed substantial toxicity in U2OS cells and therefore could not be reliably assessed for gene activation in that context (Figs. 2a – 2c). We speculate that toxicity observed with bi-partite VPR aTF may result from high level expression of the relatively small sized DmrC-VPR and its oligomerization on dCas9-DmrA(x4), both of which could contribute to potential transcriptional squelching in U2OS cells. Direct fusion p65 aTFs did not robustly activate any of the three genes in all four cell lines (Figs. 2a – 2c). In general, concurrent targeting worked in nearly every setting in which aTF bound to the promoter alone stimulated gene expression, suggesting that efficient long-distance aTF activity is strongly dependent on active transcription from the target gene promoter.
Figure 2. Various levels of heterotopic enhancer activation using aTFs with different architectures and/or harboring other activation domains.
a-c, mRNA expression levels of the endogenous IL2RA, CD69 and MYOD1 genes in human cell lines in the presence of bi-partite and direct fusion Cas9-based aTFs together with a non-targeting gRNA (None), an enhancer-targeting gRNA optimal for each cell line from panels of Figs. 1c – e (E only), a promoter-targeting gRNA (P only), or both (P + E). The number in each box represents the mean fold-activation relative to the non-targeting gRNA control (None) (n=3). Dots in boxes for bi-partite VPR in U2OS cells indicate lack of data reliability caused by cell toxicity.
Directing promoter choice of multi-gene enhancers using aTFs
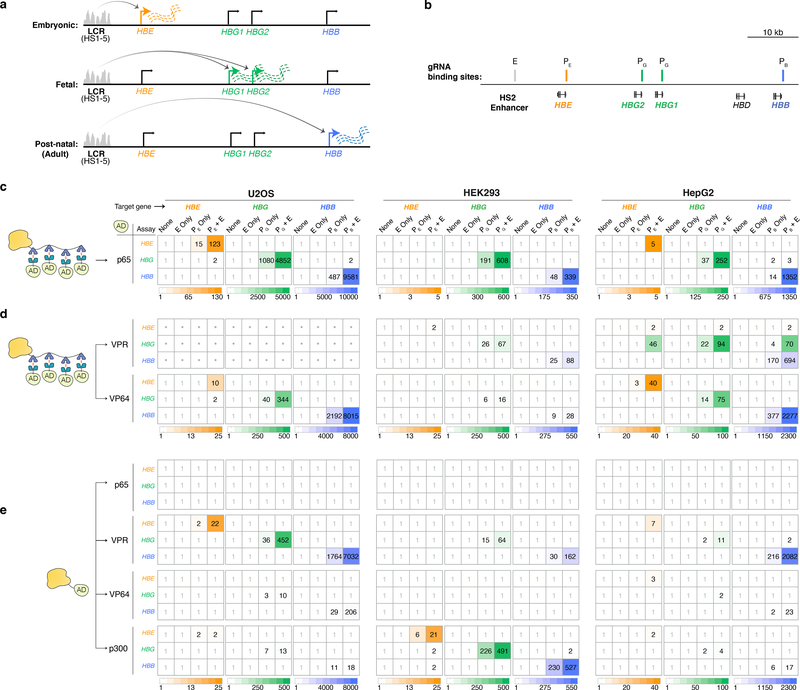
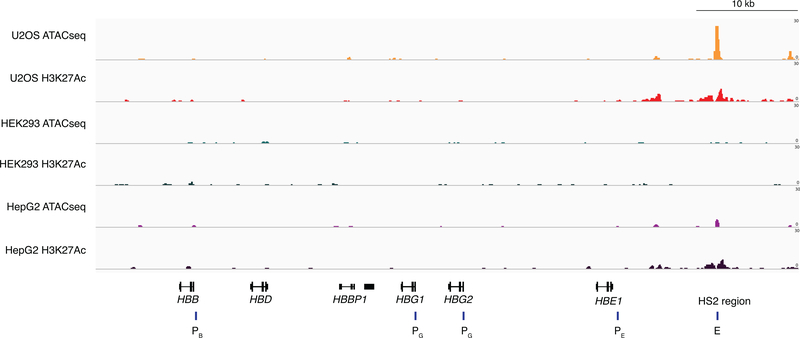
We wondered whether our strategy might be used to direct the activity of an enhancer that is known to be able to regulate multiple target genes in a different cell type. For example, the locus control region (LCR) enhancer sequentially and preferentially activates transcription in erythroid cells from the HBE, HBG1/2, and HBB promoters during embryonic, fetal, and postnatal stages of human development, respectively18–21 (Fig. 3a). We tested whether our aTF strategy might be used to direct the LCR enhancer to selectively activate each of these three target gene promoters in human cell lines (U2OS, HEK293, and HepG2) in which these genes are not normally expressed (Supplementary Table 1). We co-expressed the bi-partite p65 aTF together with one gRNA designed to target the well-characterized DNase hypersensitive site 2 (HS2) site22 within the LCR and a second gRNA targeted to either the HBE, HBG1/2 or HBB promoter (Fig. 3b). In all three cell lines, we observed differential and specific transcriptional activation of only the gene targeted by the promoter gRNA expressed (with one exception being the inability to activate HBE in HEK293 cells) and not the other two non-targeted genes (Fig. 3c). These activation events were observed regardless of whether open chromatin (ATAC-seq) and H3K27Ac marks in the LCR HS2 enhancer region were absent, weak, or robust in HEK293, HepG2 or U2OS cells, respectively (Extended Data Fig. 2). For all three genes, the activation observed in the presence of both the LCR HS2 enhancer and promoter gRNAs was much higher than in the presence of only the promoter gRNA in all three cell lines (with the exception again of HBE in HEK293 cells) (Fig. 3c); in addition, targeting the LCR enhancer alone using only the HS2-targeted gRNA did not yield measurable promoter activation (Fig. 3c).
Figure 3. Directing heterotopic enhancer activities to a specific promoter in the human β-globin locus using dCas9-based aTFs.
a, Schematic of developmental stage-specific activity of the LCR on expression of HBE, HBG1/2, and HBB in human erythroid cells. The LCR consists of five DNase hypersensitive sites (HS1–5) indicated by the grey peaks.
b, Genomic locations of gRNAs targeting the LCR HS2 region (E) and the promoter regions of HBE (PE), HBG1/2 (PG), and HBB (PB). PG targets promoters of both HBG1 and HBG2 due to their high sequence homology.
c – e, mRNA expression levels of the HBE, HBG1/2, and HBB genes in human cell lines in which bi-partite (c and d) or direct fusion (e) dCas9-based aTFs were co-expressed with either a non-targeting gRNA (None), the LCR HS2 enhancer-targeting gRNA (E only), a promoter-targeting gRNA (PE, PG, or PB only), or the E gRNA with one of the promoter-targeting gRNAs (PE + E, PG + E, or PB + E). Relative expression of each gene was measured by RT-qPCR and normalized to HPRT1 levels. Note that due to the high sequence homology between HBG1 and HBG2, the assay measures transcripts from both genes. The number in each box is the mean fold-activation of gene expression of three biological replicates (n = 3), relative to the control (None). Dots in boxes for bi-partite VPR in U2OS cells indicate lack of data reliability caused by cell toxicity.
The bi-partite VPR, bi-partite VP64, direct fusion VPR, direct fusion VP64, and direct fusion p300 aTFs also worked to direct LCR enhancer activity to target promoters with only a small number of exceptions: the bi-partite VPR aTF was not completely specific in its differential activation of HBG in HepG2 cells and again showed significant toxicity in U2OS cells (Fig. 3d), the direct fusion VP64 aTF did not activate any genes in HEK293 cells (Fig. 3e), and no activation of HBE was observed with some aTFs in certain cell lines (Figs. 3c - 3e). In addition, the direct fusion VP64 aTF did not activate even when paired with aTFs harboring heterologous activation domains (Supplementary Note; Supplementary Fig. 3). Finally, direct fusion VPR aTFs targeted to the LCR failed to activate when only dCas9 or dCas12a proteins (lacking activation domains) were targeted to the promoter, demonstrating the requirement for activation domains at both the enhancer and promoter (Supplementary Note; Supplementary Fig. 4).
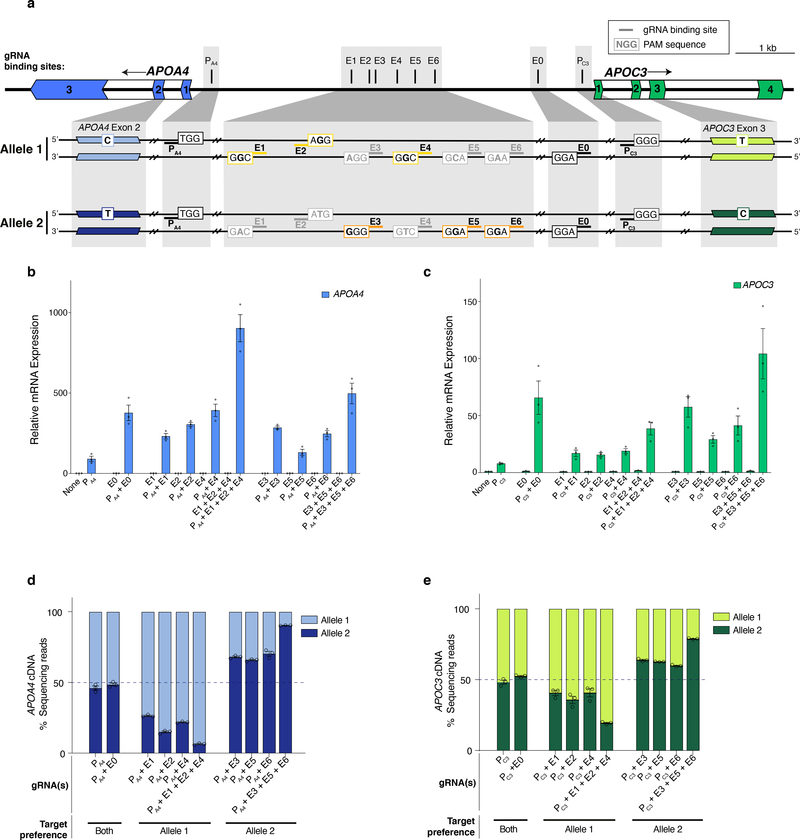
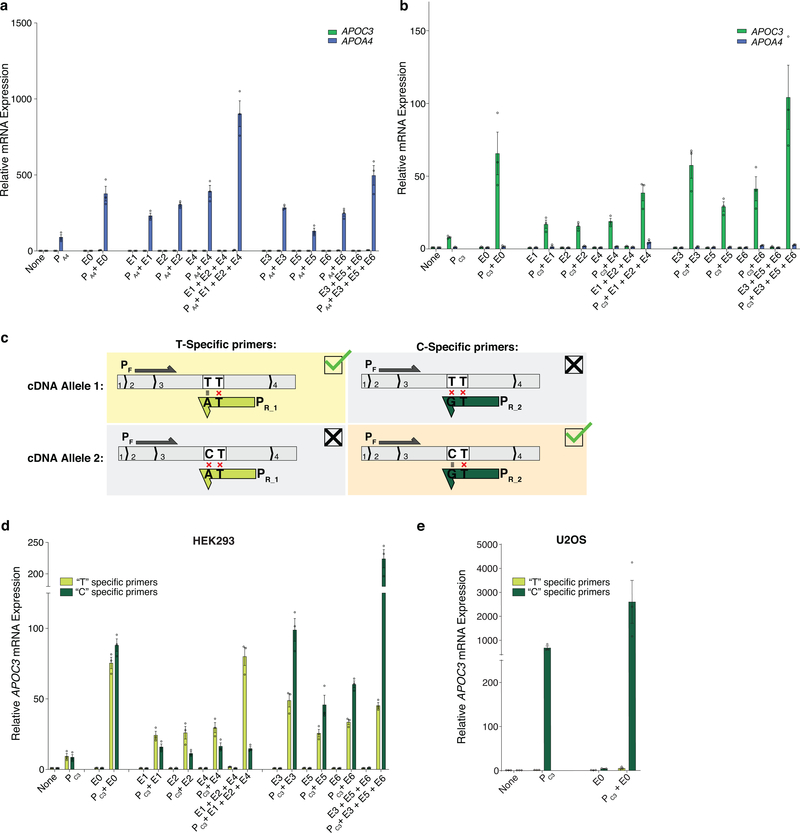
To test whether aTF targeting could guide promoter choice of a different multi-gene enhancer, we used the human APO gene cluster, which includes an enhancer that regulates the expression of both the APOA4 and APOC3 genes in hepatic cells23. We designed an SpCas9 gRNA (named E0) that targets a site in the enhancer and gRNAs that target sites in the APOA4 or APOC3 promoter (named PA4 and PC3, respectively) (Fig. 4a). Co-expression of bi-partite p65 aTF with only E0 gRNA failed to activate either APOA4 or APOC3 but addition of either PA4 or PC3 promoter-targeted gRNA led to dramatic and specific upregulation of each cognate gene that was substantially higher than that observed with only the PA4 or PC3 gRNA (Figs. 4b - 4c, Extended Data Figs. 3a - 3b).
Figure 4. Inducing allele-selective gene upregulation in HEK293 cells using heterotopic enhancer activation.
a, Schematic of the human APOA4 and APOC3 genes and the two alleles of this locus present in HEK293 cells. E0 and PA4/PC3 indicate binding sites for gRNAs targeting the known shared enhancer and the promoters, respectively. E1-E6 indicate binding sites for gRNAs targeting the potential enhancer regions, that are expected to selectively target one allele over the other based on whether the SNP present in the SpCas9 PAMs (NGG) of these target sites maintain or disrupt the PAM. (Black bold letters indicate bases that maintain an intact PAM site and gray bold letters indicate bases that are expected to disrupt the PAM). Colored outlined boxes (yellow for allele 1, orange for allele 2) indicate PAMs targeted by E1-E6 on specific alleles, while black outlined boxes indicate PAMs targeted by E0, PA4, PC3 on both alleles. The SNPs in exon 2 of APOA4 and exon 3 of APOC3 that distinguish between the mRNA of the two alleles are also shown.
b-c, Total expression of APOA4/APOC3 in HEK293 cells by the bi-partite p65 aTF targeting the promoter (PA4 /PC3) and various sites on the enhancers including the SNP regions (E1-E6) and non-SNP region (E0) determined by RT-qPCR, normalized to HPRT1 levels, calculated relative to sample with non-targeting gRNA (None). Open circles indicate biological replicates (n=3), bars the mean of replicates and error bars the s.e.m.
d-e, Relative quantification (percent next-generation sequencing reads of cDNA) of the two alleles of APOA4 or APOC3 mRNA when the bi-partite p65 aTF was co-expressed with a gRNA targeting the promoter (PA4 or PC3) alone or with one or more gRNAs targeting the known enhancer (E0) or upstream potential enhancer (E1 – E6). Open circles indicate biological replicates (n=3), bars the mean of replicates and error bars the s.e.m.
Allele-selective activation using SNPs in distal sequences
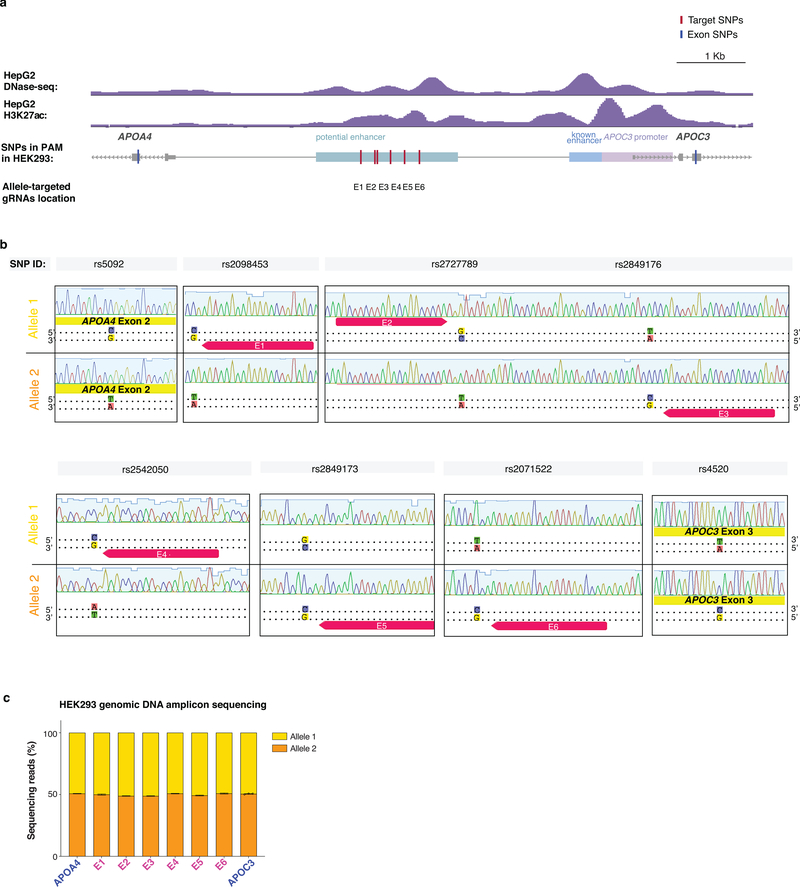
Although native transcription factors have been shown to exert allele-selective gene activation in human cells24–26, no study has, to our knowledge, shown that aTFs can do so using SNPs in distal regulatory sequences (although a recent study showed allele-selective binding of an aTF to a 12bp-inserted allele present in the TAL1 super enhancer in Jurkat cells11). To perform a proof-of-principle experiment, we used the APOA4 and APOC3 genes in HEK293 cells, which we found were heterozygous for alleles (hereafter referred to as Allele 1 and Allele 2) distinguishable by SNPs within the coding sequences of each gene (in exon 2 of APOA4 and exon 3 of APOC3) (Online Methods; Fig. 4a; Extended Data Figs. 4a - 4c). We also identified a distal sequence (Fig. 4a and Extended Data Fig. 4a) that we hypothesized might function as a potential enhancer of both APOA4 and APOC3 based on previously defined H3K27Ac and open chromatin marks at this site in HepG2 cells (Extended Data Fig. 4a). Within this potential enhancer sequence in HEK293 cells, we identified target sites for six SpCas9 gRNAs (named E1 – E6), each of which are heterozygous for a SNP that alters one of the two conserved guanines in the PAM sequence (Fig. 4a; Extended Data Figs. 4b - 4c). Using amplicon sequencing of ChIP products, we confirmed that these gRNAs can each preferentially direct binding of bi-partite p65 aTF to the allele that bears an intact PAM relative to the other allele that has a disrupted PAM (i.e., the E1, E2, and E4 gRNAs bind preferentially to their target sites on Allele 1 over Allele 2 and vice versa for the E3, E5, and E6 gRNAs) (Extended Data Fig. 5). When tested with the bi-partite p65 aTF, each of the six E1 – E6 gRNAs only activated APOA4 when the PA4 promoter-targeted gRNA was also co-expressed (Fig. 4b; Extended Data Fig. 3a), verifying that binding to the potential enhancer can lead to long-range activation (Fig. 4b). cDNA sequencing of these activated APOA4 mRNA transcripts revealed unbalanced expression of the two APOA4 alleles with each of the E1 – E6 gRNAs, in contrast to more equally balanced expression with the E0 gRNA (Fig. 4d). Combined expression of enhancer gRNAs targeted to the same allele (i.e., E1 + E2 + E4 or E3 + E5 + E6) together with the PA4 gRNA resulted in even greater increases in APOA4 expression (Fig. 4b) and further imbalances in relative expression of the two alleles (Fig. 4d). We were able to induce similar allele-selective expression of APOC3 with the enhancer gRNAs (E0, E1 – E6), the promoter-targeted PC3 gRNA, and the bi-partite p65 aTF in HEK293 cells (Fig. 4c, 4e; Extended Data Figs. 3b – 3d). (We use the term “allele-selective” rather than “allele-specific” to describe the differential gene activation effects we observe on different alleles, which are preferential but not absolute.) Potential reasons for differences in the magnitude of imbalance observed for aTF binding versus target gene activation (Figs. 4d – 4e; Extended Data Fig. 5c) include the possibility that not all binding events of an aTF molecule might lead to activation and that the two methods used to measure these parameters have different sensitivities.
To further test the generalizability of our approach for allele-selective gene activation, we tested two additional genes in two other cell lines. In one case, we assessed HBB expression in U2OS cells using four gRNAs that target sites in the HS4 LCR enhancer that are each heterozygous for a PAM-disruptive SNP (Extended Data Fig. 6a). In the second case, we examined MYOD1 expression in K562 cells and used allele-selective gRNAs targeting the distal regulatory region (DRR) enhancer27 (Extended Data Fig. 7a). For both experiments, we tested these enhancer-targeted gRNAs with a gRNA targeting the target gene promoter and the bi-partite p65 aTF. At both genes, we were able to leverage targeting of SNPs present in enhancer sequences to achieve robust, allele-selective gene activation (Extended Data Figs. 6b - 6c and 7b -7c).
Discussion
The work described here defines a general strategy to more robustly and consistently access the gene activation capabilities of enhancers in heterotopic settings or other distal sequences by directing an aTF not only to these sequences (as done in previous studies7–14) but also concurrently to the target gene promoter. The extent of gene activation we observed depended on cell-type, perhaps due to differing expression levels of cofactors of the activation domains in the aTFs we used in this study. The magnitude of activation achieved might be further tuned by intentionally introducing mismatched positions with targeting gRNAs as recently described28. Distal sequences that can be targeted by aTFs can be identified in existing databases29,30 based on their known enhancer function or characteristics consistent with that of an enhancer (i.e., open chromatin and H3K27Ac marks) in another cell type. While all the distal and promoter sequences we used lie within a single topologically-associated domain (TAD) conserved across multiple cell-types (Supplementary Note; Supplementary Fig. 5), we found in preliminary studies that simultaneous targeting of aTFs to sequences outside of the TAD in which the target gene lies can in some cases also lead to activation (Supplementary Note; Supplementary Fig. 6).
Our studies have potential implications for understanding normal enhancer function. The finding that enhancer activity is influenced by promoter status may impact how such sequences are identified using CRISPR activation (CRISPRa) screens. For example, in heterotopic cell settings, an associated enhancer for an inactive target promoter might be missed without also activating that promoter. In addition, our studies can improve our understanding of how a single enhancer differentially regulates multiple promoters within a cluster. Our findings with the β-globin gene cluster suggest that enhancers might be redirected simply by upregulating or downregulating different promoters. Consistent with this, hemoglobin gene switching studies have shown both an increase in the KLF1 activator at the HBB promoter and eviction of the NF-Y activator by the BCL11A repressor on the HBG promoter when LCR activity is re-directed from HBG to HBB 31–33.
Finally, our method for robust heterotopic activation of enhancers expands the utility and precision of CRISPR-based aTFs. Concurrent aTF targeting could enable differential increases in target gene expression when more than one promoter can potentially be upregulated, enabling the generation of more complex spatio-temporal gene expression patterns. This approach provides a more parsimonious solution to the challenge of robustly regulating different target genes in the same cluster because a single enhancer-targeted gRNA can be used with each promoter-targeted gRNA to activate individual genes instead of using multiple promoter-targeted gRNAs for each of those genes. In addition, our aTF strategy enables allele-selective gene expression by differentially targeting SNPs embedded in enhancer or other distal sequences. Our analysis using data from the 1000 Genomes Project and chromatin accessibility data from multiple cell lines found that SNPs that disrupt or create NGG PAM sequences for SpCas9 are greatly enriched genome-wide in putative enhancers compared with promoters: ~2-fold and ~12-fold higher for SNP density and for total number of SNPs, respectively (Online Methods; Extended Data Fig. 8 and Supplementary Table 2). Allele-selective gene activation might provide a general therapeutic strategy for haploinsufficient or dominant-negative diseases, enabling preferential upregulated expression of a wild-type allele over a mutant allele for therapeutic benefit34–40. In sum, our robust strategy for enabling long-range activation should broaden the scope and range of research, synthetic biology, and therapeutic applications of CRISPR-based aTFs.
ONLINE METHODS
Plasmids and oligonucleotides
The list of plasmids and related sequences used in this study can be found in Supplementary Note; SpCas9 gRNA and LbCas12a crRNA oligo sequences can be found in Supplementary Table 3.
Human cell culture conditions
ATCC STR-authenticated HEK293 (Invitrogen, similar to ATCC CRL-1573; a loss of two alleles, #9 at the D5S818 locus and the #11 at the CSF1PO locus), U2OS (gift of Dr. Toni Cathomen, similar match to ATCC HTB-96; gain of no. 8 allele at the D5S818 locus), HepG2 (ATCC HB-8065), K562 (ATCC CCL-243) were used in this study. (HEK293, U2OS, and K562 cells were authenticated Nov 8, 2019. HepG2 cells were authenticated Dec 14, 2018.) All cell culture reagents were obtained from ThermoFisher unless otherwise specified. HEK293 cells and U2OS cells were grown in Dulbecco’s Modified Eagle Medium (11995073), HepG2 cells in Eagle’s Minimum Essential Medium (ATCC, 30–2033) and K562 cells in Roswell Park Memorial Institute 1640 medium (62870–127) with additional 2 mM Glutamax (35050061), supplemented with 10% heat-inactivated fetal bovine serum (16140–089) and 1% penicillin and streptomycin (1507006), at 37° C, in 5% CO2. Media supernatant was analyzed biweekly for any contamination of the cultures with mycoplasma using MycoAlert PLUS Mycoplasma Detection Kit (Lonza, LT07–703).
Gene activation experiments
For direct fusion aTF experiments, HEK293, U2OS, HepG2and K562 cells were transfected with dCas9/dCas12a activator plasmids (750 ng) and Cas9 gRNA/Cas12a crRNA plasmids (250 ng). For bi-partite aTF experiments, the cell lines were transfected with dCas9-DmrA(x4)/dCas12a-DmrA(x4) plasmid (400 ng), DmrC-p65, DmrC-VP64 or DmrC-VPR plasmids (200 ng), and Cas9 gRNA/Cas12a crRNA plasmids (400 ng). For heterotopic activation of enhancer sequences of IL2RA, CD69, MYOD1 and hemoglobin genes by dCas9-based aTFs (Figs. 1 - 3), we chose gRNAs that were validated in previous studies9,14. For inducing allele-selective gene upregulation in HEK293 cells using heterotopic enhancer activation (Fig. 4), we first screened promoter gRNAs to identify those that induced target gene activation with the bi-partite p65 aTF. Next, we screened the selected promoter gRNAs with 10 enhancer gRNAs using bi-partite p65 aTF to identify the best promoter and enhancer gRNA combination that showed synergistic target gene activation. We observed that as long as a given promoter gRNA induced gene activation, all of the enhancer gRNAs tested boosted target gene activation. For control samples, a gRNA targeting a sequence that does not occur in the human genome41 (hereafter, referred to as non-targeting gRNA) was expressed. When multiple gRNAs were used in a single experiment the total amount of Cas9 gRNA plasmid remained the same, the quantity of individual gRNAs were varied (Source Data). When bi-partite dCas9 activators were used, 500 μM A/C heterodimerizer (Takara Clontech, 635056) was added in the complete media to a final concentration of 500 nM at the time of transfection. 24 hours prior to transfection, HEK293 cells (8.6 × 10⁴) and HepG2 cells (2.0 × 10⁵) were seeded in 12-well plates and then lipofected with the plasmids using 3 μl of TransIT-293 (Mirus Bio, MIR2705) for HEK293 cells and 3 μl of TransfeX (ATCC, ACS-4005) for HepG2 cells. U2OS cells and K562 cells (2 × 10⁵) were nucleofected with the plasmids using a 4D- Nucleofector (Lonza) and the DN-100 program with the SE Cell Line Nucleofector Kit and FF-120 program with the SF Cell Line Nucleofector Kit respectively. Biological replicates are independent transfections on separate days or on same days with cells that have different passage numbers. 72 hours post-transfection, total RNA was extracted from the cells using the NucleoSpin RNA Plus Kit (Clontech, 740984.250) and 50 – 250 ng of purified RNA was used for cDNA synthesis using High-Capacity RNA-to-cDNA Kit (ThermoFisher, 4387406) or SuperScript III First Strand Synthesis System (for analysis of β-globin genes) (ThermoFisher, 18080–400). The cDNA was used for quantitative PCR (qPCR) using Fast SYBR Green Master Mix (ThermoFisher, 4385612) with the gene-specific primers (Supplementary Table 3) in 384-well plates on a LightCycler 480 (Roche) with the following program: initial denaturation at 95 °C for 20 seconds (s) followed by 45 cycles of 95 °C for 3 s and 60 °C for 30 s. Since Ct values fluctuate for transcripts expressed at very low levels, values greater than 35 were considered as 35, and used as the baseline Ct value. Gene expression levels were normalized to HPRT1 and calculated relative to that of the negative controls (dCas9 activators and non-targeting gRNA plasmids). HPRT1 qPCR control was independently assayed for each sample. Frequency, mean, and standard error of the mean were calculated using GraphPad Prism 8.
Chromatin Immunoprecipitation (ChIP)
24 hours prior to transfections, HEK293 cells (2 × 10⁶) were seeded in 10 cm dishes and then transfected with 15 μg of plasmids (6 μg of dCas9-DmrA(x4), 3 μg of DmrC-p65, and 6 μg of Cas9 gRNA) using 45 μl of TransIT-293. Cells were trypsinized 72 hours post-transfection and ChIP assays were carried out as previously described42 with some modifications, using specific antibodies detailed below. Input DNA control samples were not treated with antibodies. Antibody-chromatin complexes were pulled down with protein G-Dynabeads (ThermoFisher, cat#10003D), the DNA was purified with paramagnetic beads as described previously43, and quantified using Qubit 4 Fluorometer (ThermoFisher, Q33226).
H3K27Ac ChIP-seq
Active status of chromatin was determined by histone 3 lysine 27 acetylation (H3K27Ac) levels using ChIP-seq. H3K27Ac ChIP assay was conducted with 5 μg of anti-H3K27Ac antibody (Active Motif, 39133) using the protocol described above. Sequencing libraries were prepared with 3 ng each of H3K27Ac ChIP DNA and input sample using SMARTer ThruPLEX DNA-seq kit (Takara, R400675). Libraries were sequenced with single-end (SE) 75 cycles on an Illumina Nextseq 500 system at the Broad Institute of Harvard and MIT and the reads were aligned to human reference genome hg19 using Burrows-Wheeler Alignment (BWA) tool44. Genome-wide coverage was calculated after extending to 200 bases (approximate fragment size) and averaged over 25 bp windows using igvtools45. Coverage was then normalized and scaled using RSeqC (http://rseqc.sourceforge.net/#normalize-bigwig-py). ChIP-seq peaks were called using MACS2 2.0.10.20120913.
ChIP-qPCR
dCas9 fused to DmrA(x4) was pulled down using 5 μg anti-Cas9 antibody (Active motif, cat#61757) per ChIP assay as detailed above. The immunoprecipitated DNA was analyzed by qPCR using Fast SYBR Green Master Mix (ThermoFisher, 4385612) with the primers listed in Supplementary Table 3 on a LightCycler 480 (Roche) with the following program: initial denaturation at 95 °C for 20 seconds (s) followed by 45 cycles of 95 °C for 3 s and 60 °C for 30 s. Relative enrichment for each target was calculated by normalization to input control.
RNA-seq
RNA libraries were prepared from 500 ng of total RNA treated with Ribogold zero to remove ribosomal RNA, using TruSeq Stranded Total RNA Library Prep Gold kit (Illumina, 20020599) and TruSeq RNA Single Indexes. The RNA libraries were sequenced with SE 75 cycles on an Illumina Nextseq500 system at the Broad Institute of Harvard and MIT. Reads were aligned to human reference genome hg19 using STAR (doi:10.1093/bioinformatics/bts635) and PCR duplicates were removed using Picard tools (http://broadinstitute.github.io/picard/). Reads aligning to ribosomal RNA were then filtered out of the alignment. Genomic coverage from filtered alignments were calculated by normalizing to sequencing depth using bedtools46. FPKMs were calculated using Cufflinks47. Differential gene expression was performed using DESeq2 v.1.20.048.
GO enrichment analysis
GO analysis was done using the PANTHER website (http://pantherdb.org)49. A list of genes that showed differential expression after activation of MYOD1 identified by RNA-seq (Supplementary Fig. 2c) was used as the input for the analysis. PANTHER Overrepresentation Test (Released 20200407) was performed with GO Ontology database (Released 2020–02-21). Fisher’s exact test with FDR correction was used and GO biological process complete was used as an annotation data set.
ATAC-seq
Open or closed status of the chromatin was determined using Assay for Transposase-Accessible Chromatin by Sequencing (ATAC-seq). The ATAC-seq libraries were constructed following the protocol of Corces et. al50 and using Nextera DNA Flex Library Prep Kit (Illumina, FC-121–1030). The libraries were sequenced with paired end (PE) 150 cycles on an Illumina Nextseq500 system at the Broad Institute of Harvard and MIT. Reads were aligned to human reference genome hg19 using BWA and filtered to exclude PCR duplicates and processed as previously described51. Read start positions were shifted towards the 3’ end by 4 bp for reads aligning to plus strand and towards the 5’ end by 5 bp for reads aligning to minus strand. Genomic coverage was calculated by counting reads in 150 bp sliding windows at 20 bp steps across the genome and then normalized to 10 million reads in each experiment using bedtools46.
Defining APOC3 enhancer sequences for SNP analysis
Known APOC3 enhancer sequences are located 500 to 890 bp upstream of the TSS23,52 and show open chromatin features H3K27Ac enrichment in HepG2 cells in which APOC3 is highly expressed. (UCSC genome browser (hg19), Supplementary Table 1) We identified potential enhancer sequences in the region encompassing ~4.4 Kb to 2 Kb upstream of TSS based on similar open chromatin and H3K27Ac enrichment features (Extended Data Fig. 4a).
Haplotype analysis
Primers flanking the APOA4 exon2 SNP (rs5092) and enhancer site E6 (rs2071522) were used to amplify ~4.3kb of HEK293 genomic DNA (Supplementary Table 3). Primers flanking enhancer site E1 (rs2098452) and APOC3 exon 3 SNP (rs4520) were used to amplify ~4.9kb of HEK293 genomic DNA (Supplementary Table 3). Amplicons were TOPO cloned using Zero Blunt TOPO PCR cloning kit (ThermoFisher, 450031) and ~100 colonies for each amplicon were analyzed by Sanger sequencing (Extended Data Fig. 4b).
Allele-selective binding of activators and gene expression experiments
Allele-selective binding of activators to gDNA identified by ChIP, allele ratio in native gDNA, and allele-selective gene expression were determined using next-generation amplicon sequencing. Libraries for sequencing were prepared in two steps by PCR. In the first step, target sites were amplified by PCR using primers that contain Illumina adaptor sequences. The PCR reactions contained 50 ng of gDNA, 5 μl of ChIP DNA or 5 μl of 1:20 diluted cDNA, 500 nM each of forward and reverse primer, 200 μM dNTP, 1 unit of Phusion Hot Start Flex DNA Polymerase (NEB, Cat#M0535L) and 1X Phusion HF buffer in a total volume of 50 μl. The first PCR cycling conditions were 98°C for 2 min followed by 25 cycles of 98°C for 10 s, 65°C for 12s and 72°C for 12s, and a final 72°C extension for 10 min. PCR products were purified using paramagnetic beads (0.7–1.2X beads to sample ratio) according to amplicon size as described previously43 and quantified on Qubit 4 Fluorometer (ThermoFisher, Q33226) using 1X DNA high sensitivity kit (Thermofisher, Q33231). Bead-purified amplicons with Illumina adapters from the first PCR (1–19 ng) were barcoded with Illumina indexes containing sequences complementary to the adapter overhangs in a second PCR, using the cycling conditions of 98 °C for 2 min, 7 cycles of 98 °C 10s, 65 °C 30s and 72 °C 30s followed by 72 °C 10 min. The PCR products were purified as above and quantified by Qubit 4 Fluorometer. Amplicon libraries were sequenced with PE 300 cycles on the Illumina Miseq using 300-cycle MiSeq Reagent Kit v2 (Illumina, MS-102–2002) or Micro Kit v2 (Illumina, MS-103–2002). Demultiplexed FASTQ files were analyzed using TrimGalore (https://github.com/FelixKrueger/TrimGalore), FLASH2 (http://github.com/dstreett/FLASH2) and CRISPResso253. Allele-selective expression of APOC3 gene in HEK293 was confirmed by RT-qPCR using allele-specific primers targeting the APOC3 exonic SNP (rs4520) designed as per Li et. al. for mismatch amplification mutation assays54 (Extended Data Fig. 3c). All the primers used in the above reactions are listed in Supplementary Table 3. The specificity of the allele-specific primers was verified using U2OS cDNA in which the variant allele is not present (Extended Data Fig. 3e).
K562 Hi-C analysis
We used Juicer55 to extract Hi-C contacts from the K562 cell line at the HBB and MYOD1 loci windows at 25kb resolution, summed them to determine the overall Hi-C contact level for those regions, and divided by the number of bins to get a per-bin average. As length of the region is correlated with average Hi-C contact frequency, we compared the contact frequency within each locus to a background distribution of windows of the same size. To determine the background distribution, we calculated the averaged Hi-C contacts for sliding windows of width 2.575 Mb and 4.35 Mb (sliding step 100kb across the whole genome), corresponding to the approximate width of the HBB and MYOD1 loci, respectively.
SPIN analysis
We used previously calculated SPIN state tracks for the K562 cell line56. Briefly, SPIN states integrate TSA-seq, DamID, and Hi-C in a unified framework based on hidden Markov random fields and provide insight into nuclear spatial and functional compartmentalization.
Comparison of SNP densities at Cas9 PAM sequences in promoters and putative enhancers
For this analysis, promoters were defined as +/− 500 bp from TSS, and putative enhancers were determined as DNase Hypersensitivity Sites (DHSs) excluding promoter sequences described above. NCBI RefSeq version GCF_000001405.25_GRC37.p13 was used for defining TSS, and 83 DHS tracks of different cells and tissues from ENCODE/Roadmap project (https://www.encodeproject.org) were combined for the analysis (Supplementary Table 4). All SNPs from the 1000 Genomes Project phase 3 were used for the analysis (https://www.internationalgenome.org/data). SNP sites were classified into three distinct categories based on their activity on the PAM sites: PAM creation, PAM disruption and Mixed (i.e., creation and disruption at the same time but on different strands). Based on the overlapping counts of SNPs in promoters and putative enhancers, we defined the SNP density as the number of SNPs in each region divided by the length of each regulatory element; enhancer SNP density indicates the number of SNPs in each DHS divided by the peak size of each DHS and promoter SNP density indicates the number of SNPs in each promoter divided by 1000 bp.
Statistical Analysis
Gene expression analyses were conducted using Student’s t-test (two-tailed test assuming equal variance) and comparison of SNP densities between promoter and enhancer using Mann-Whitney U test. The results were considered statistically significant if the p-value was less than 0.05.
Data availability
Data sets from amplicon sequencing have been deposited with the National Center for Biotechnology Information Sequence Read Archive https://www.ncbi.nlm.nih.gov/sra/PRJNA578485. Data sets from ChIP-seq, RNA-seq, and ATAC-seq experiments have been deposited with the Gene Expression Omnibus (GEO) repository with the accession number GSE 139190. GO Ontology database used in this study can be downloaded from https://bioportal.bioontology.org/ontologies/GO.
Extended Data
Extended Data Fig. 1. Chromatin status at IL2RA, CD69, and MYOD1 determined by ATAC-seq and H3K27Ac ChIP-seq.
a,IL2RA promoter was closed and inactive in all cell types, IL2RA enhancer regions were closed and inactive in HEK293 and K562 cells, but open and active in U2OS and HepG2 cells. E1, E2, E3, E4: IL2RA enhancer gRNA target sites, P: IL2RA promoter gRNA target site. The RBM17 locus which was open (transposase accessible chromatin) and active (enriched in H3K27Ac marks) in all cell types is shown for comparison.
b,CD69 promoter was closed and inactive in all cell types, CD69 enhancer regions were closed in all cell types. E1, E2: CD69 enhancer gRNA target sites, P: CD69 promoter gRNA target site.
c, Chromatin at MYOD1 promoter was open in U2OS and HEK293 cells but not in HepG2 and K562 cells. E1, E2, E3, E4: MYOD1 enhancer gRNA target sites, P: MYOD1 promoter gRNA target site.
Extended Data Fig. 2. Chromatin status at the β-globin locus determined by ATAC-seq and H3K27Ac ChIP-seq.
All promoters at the β-globin locus showed closed and inactive chromatin states in all cell types. HS2 enhancer region showed closed and inactive chromatin features in HEK293 cells, but open and active chromatin features U2OS and HepG2 cells. E: HS2 enhancer gRNA target site, PE: HBE promoter gRNA target site, PG: HBG1/2 promoter gRNA target site, PB: HBB promoter gRNA target site.
Extended Data Fig. 3. Total activation of APOA4 and APOC3 and orthogonal confirmation of allele-selective expression via allele-specific RT-qPCR.
a-b, Total expression of APOA4 and APOC3 in HEK293 cells by bi-partite p65 aTF targeting the promoter (P) and various sites on the enhancers including SNP regions (E1 to E6) and non-SNP region (E0) determined by RT-qPCR, normalized to HPRT1 levels, calculated relative to sample with non-targeting gRNA (None). Open circles indicate biological replicates (n=3), bars the mean of replicates and error bars the s.e.m.
c, Schematic of the location of RT-qPCR primers used for APOC3 allele-selective expression. Allele-specific primers detecting a SNP in APOC3 exon 3 have a common forward primer (PF) which spans the exon 2 and exon 3 junction, and two different reverse primers which are specific for allele 1 (T at rs4520, PR_1) or for allele 2 (C at rs4520, PR_2) in exon 3, with a ‘T’ mismatch in the penultimate base at the 3’ for both primers.
d, Allele-selective expression of APOC3 in HEK293 cells by bi-partite p65 aTF targeting the promoter (P) and various sites on the enhancers including SNP regions (E1 to E6) and non-SNP region (E0) determined by RT-qPCR using the primers described in c, normalized to HPRT1 levels, calculated relative to sample with non-targeting gRNA. Open circles indicate biological replicates (n=3), bars the mean of replicates and error bars the s.e.m. The apparent difference in allele-specific expression levels when compared to total expression in b is potentially due to the amplification of a smaller fragment of cDNA in the allele-specific reaction.
e, Validation of the specificity of allele-specific RT-qPCR primers used in d, with U2OS cells in which the variant T nucleotide is absent at rs4520 (only the C nucleotide is present at the same position). APOC3 expression was measured by RT-qPCR using the allele-specific primers used in d, in U2OS cells co-expressing the bi-partite p65 aTF and gRNAs targeting the promoter or non-SNP region of the enhancer (E0). Open circles indicate biological replicates (n=3), bars the mean of replicates and error bars the s.e.m.
Extended Data Fig. 4. Haplotype of potential APOA4 and APOC3 enhancer regions and allele ratios of target SNPs.
a, The potential enhancer region was identified by its open and active chromatin features which are similar to the known enhancer, based on the DNase-seq and H3K27Ac data (UCSC genome browser) from HepG2 cells in which APOC3 is highly expressed. Genomic locations of SNPs in SpCas9 PAMs identified in the potential enhancer are shown. SNPs in exon 2 of APOA4 and exon 3 of APOC3 are shown.
b, Sanger sequencing traces from TOPO cloned amplicons showing the SNPs in the potential enhancer and exonic regions of APOA4 and APOC3 in HEK293 cells. E1 to E6 are gRNA binding sites in the potential enhancer region which has SNPs in the PAM sequence. SNPs are exclusively associated with one another in two unique haplotypes.
c, Allele ratios of target SNPs in the genomic DNA of HEK293 cells were determined by targeted genomic DNA amplicon sequencing and indicate a 1:1 ratio.
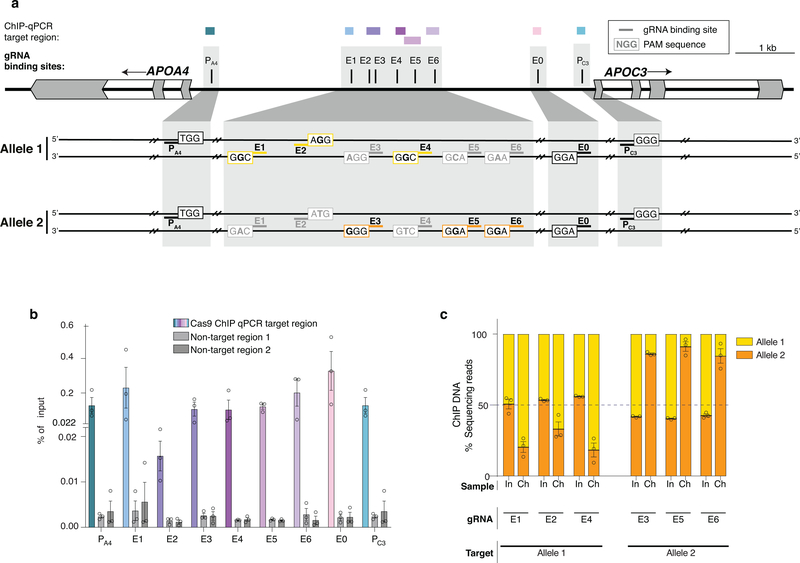
Extended Data Fig. 5. Binding of bi-partite p65 aTF to APOA4 and APOC3 promoter and enhancer target sites in HEK293 cells.
a, Genomic locations of the enhancer gRNAs, APOA4 promoter and APOC3 promoter gRNA. The regions amplified in ChIP-qPCR assays are shown as boxes.
b, Binding activity of bi-partite p65 aTF at each gRNA target region in APOA4 and APOC3 loci determined by Cas9 ChIP-qPCR, expressed as a percentage of input DNA. Two sets of primers designed to amplify the human genome at locations other than the APOC3 and APOA4 loci were used as negative controls. Open circles indicate biological replicates (n=3), bars the mean of replicates and error bars the s.e.m.
c, Binding of the bi-partite p65 aTF to the potential upstream enhancer sequence in the presence of the E1-E6 gRNAs. E1, E2, and E4 are expected to bind selectively to Allele 1 (yellow); E3, E5, and E6 to Allele 2 (orange). Relative quantification (percent next-generation sequencing reads) of the two alleles in the DNA from ChIP experiments performed with an anti-Cas9 antibody are shown. Open circles indicate biological replicates (n=3), bars the mean of replicates and error bars the s.e.m. In, Input DNA; Ch, Cas9 ChIP DNA
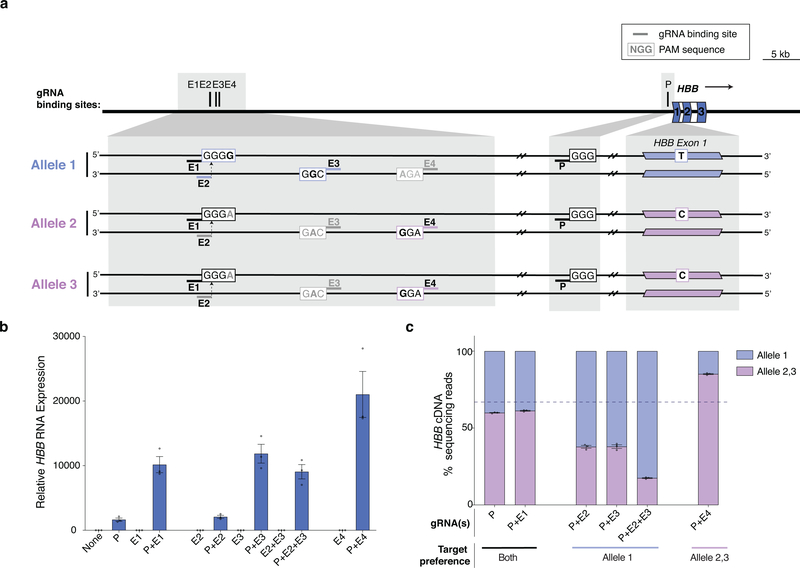
Extended Data Fig. 6. Allele-selective upregulation of HBB genes in U2OS and K562 cells using heterotopic activation of enhancer.
a, Schematic of HBB gene and the three alleles present in U2OS cells. P indicates the binding site for the gRNA targeting the HBB promoter. E1-E4 indicate binding sites for gRNAs in the HS4 putative enhancer region, which are expected to target either all alleles (E1), selectively target one allele (E2, E3) or two alleles (E4) based on the PAM of the target site (black bold indicates a base that maintains an intact PAM site and gray bold indicates a base that is expected to disrupt the PAM). A SNP in exon 1 of HBB distinguishes between allele 1 (light purple) and allele 2/3 (pink).
b, Total expression of HBB in U2OS cells when the bi-partite p65 aTF was co-expressed with a gRNA targeting the promoter (P) and/or with one or more gRNAs targeting the HS4 enhancer region (E1-E4) was determined by RT-qPCR, normalized to HPRT1 levels, and calculated relative to sample with non-targeting gRNA (None). Open circles indicate biological replicates (n=3), bars the mean of replicates and error bars the s.e.m.
c, Relative quantification (percent next-generation sequencing reads of cDNA) of the three alleles of HBB mRNA when the bi-partite p65 aTF was co-expressed with a gRNA targeting the promoter (P) alone or with one or more gRNAs targeting the HS4 enhancer region (E1-E4). Open circles indicate biological replicates (n=3), bars the mean of replicates and error bars the s.e.m.
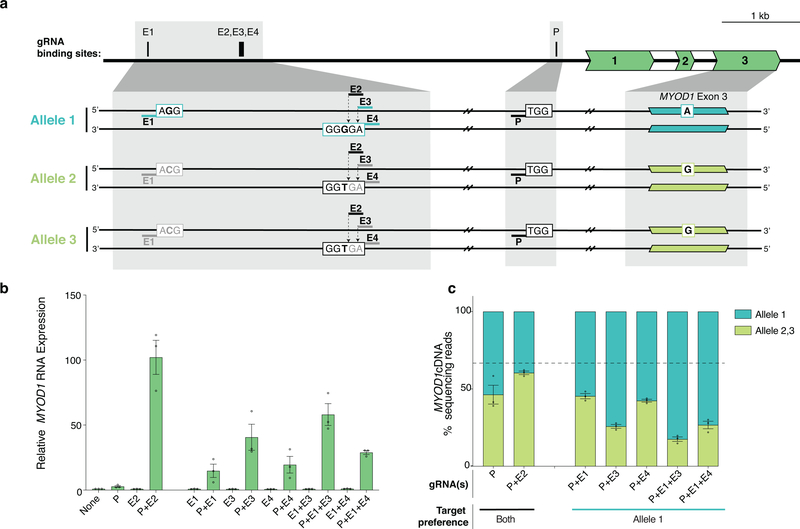
Extended Data Fig. 7. Allele-selective upregulation of MYOD1 genes in U2OS and K562 cells, respectively, using heterotopic activation of enhancer.
a, Schematic of MYOD1 gene and the three alleles present in K562 cells. P indicates the binding site for the gRNA targeting the MYOD1 promoter. E1-E4 indicate binding sites for gRNAs in the known enhancer region termed the distal regulatory region (DRR), which are expected to selectively target allele 1 (E1, E3, E4) or all alleles (E2) based on the PAM of the target site (black bold indicates a base that maintains an intact PAM site and gray bold indicates a base that is expected to disrupt the PAM). A SNP in exon 3 of MYOD1 distinguishes between allele 1 and allele 2/3.
b, Total expression of MYOD1 in K562 cells when the bi-partite p65 aTF was co-expressed with a gRNA targeting the promoter (P) and/or with one or more gRNAs targeting the DRR enhancer region (E1-E4) was determined by RT-qPCR, normalized to HPRT1 levels, and calculated relative to sample with non-targeting gRNA (None). Open circles indicate biological replicates (n=3), bars the mean of replicates and error bars the s.e.m.
c, Relative quantification (percent next-generation sequencing reads of cDNA) of the three alleles of MYOD1 mRNA when the bi-partite p65 aTF was co-expressed with a gRNA targeting the promoter (P) alone or with one or more gRNAs expected to target the DRR enhancer region (E1-E4). Open circles indicate biological replicates (n=3), bars the mean of replicates and error bars the s.e.m.
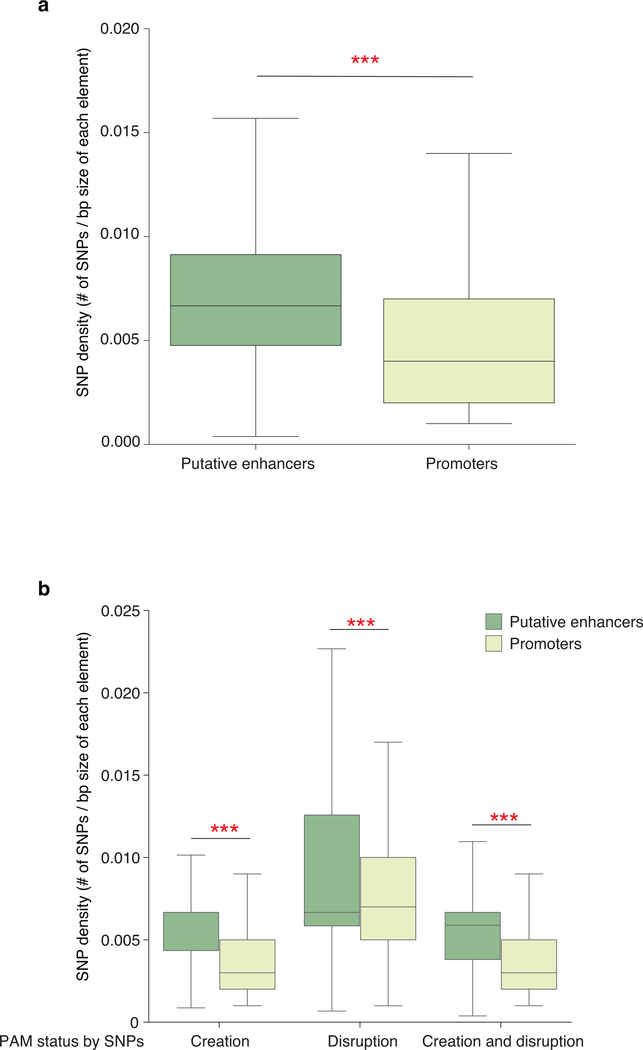
Extended Data Fig. 8. Distribution of SNP densities that create or disrupt NGG PAM sequences at putative enhancers and promoters.
The density of SNPs is the number of SNPs divided by the base pair size of each regulatory element (promoter or enhancer) identified from the 1000 Genomes Project using DHS data from 83 different cell lines from ENCODE/Roadmap project. center line, median; box limits, upper and lower quartiles; whiskers, 1.5x interquartile range. * indicates p<0.001 (Mann-Whitney U test (two-sided) with Bonferroni test for multiple comparison)
Supplementary Material
Acknowledgements
J.K.J. was supported by grants from the National Institutes of Health (R35 GM118158, R01 CA211707, and R01 CA204954), a St. Jude Children’s Research Hospital Collaborative Research Consortium award, a Massachusetts General Hospital (MGH) Collaborative Center for X-Linked Dystonia-Parkinsonism grant, and the Desmond and Ann Heathwood MGH Research Scholar Award. L.P. was supported by grants from the National Institute of Health (R00 HG008399 and R35 HG010717). We thank Ben Kleinstiver (MGH) for providing BPK1179, BPK880, BPK617, BPK1160 plasmids. We thank Matthew Freedman, Ji-Heui Seo, and Caleb Lareau for assistance with important pilot experiments. We thank Peggy Farnham, Miguel Rivera, and Ligi Paul Pottenplackel for comments on the manuscript.
Footnotes
Competing interests
J.K.J. has financial interests in Beam Therapeutics, Chroma Medicine (f/k/a YKY, Inc.), Editas Medicine, Excelsior Genomics, Pairwise Plants, Poseida Therapeutics, SeQure Dx, Inc., Transposagen Biopharmaceuticals, and Verve Therapeutics (f/k/a Endcadia). L.P. has financial interests in Excelsior Genomics, Edilytics, and SeQure Dx, Inc.. M.J.A. has financial interests in Excelsior Genomics and SeQure Dx, Inc.. J.K.J ‘s, L.P.’s, and M.J.A’s interests were reviewed and are managed by Massachusetts General Hospital and Partners HealthCare in accordance with their conflict of interest policies. S.I. is an employee of Verve Therapeutics. Y.E.T. and J.K.J. are inventors on patent applications that cover epigenetic editing technologies. The other authors have no competing interests.
Additional Information
Supplementary Information is available for this paper.
REFERENCES
- 1.Pickar-Oliver A & Gersbach CA The next generation of CRISPR–Cas technologies and applications. Nat. Rev. Mol. Cell Biol. 20, 490–507 (2019). [DOI] [PMC free article] [PubMed] [Google Scholar]
- 2.Thakore PI, Black JB, Hilton IB & Gersbach CA Editing the epigenome: technologies for programmable transcription and epigenetic modulation. Nat. Methods 13, 127–137 (2016). [DOI] [PMC free article] [PubMed] [Google Scholar]
- 3.Wang H, La Russa M & Qi LS CRISPR/Cas9 in Genome Editing and Beyond. Annu. Rev. Biochem. 85, 227–264 (2016). [DOI] [PubMed] [Google Scholar]
- 4.Maurano MT et al. Systematic localization of common disease-associated variation in regulatory DNA. Science 337, 1190–1195 (2012). [DOI] [PMC free article] [PubMed] [Google Scholar]
- 5.Ernst J et al. Mapping and analysis of chromatin state dynamics in nine human cell types. Nature 473, 43–49 (2011). [DOI] [PMC free article] [PubMed] [Google Scholar]
- 6.Nasser J et al. Genome-wide enhancer maps link risk variants to disease genes. Nature 593, 238–243 (2021). [DOI] [PMC free article] [PubMed] [Google Scholar]
- 7.Gilbert LA et al. Genome-Scale CRISPR-Mediated Control of Gene Repression and Activation. Cell 159, 647–661 (2014). [DOI] [PMC free article] [PubMed] [Google Scholar]
- 8.Gao X et al. Comparison of TALE designer transcription factors and the CRISPR/dCas9 in regulation of gene expression by targeting enhancers. Nucleic Acids Res. 42, e155 (2014). [DOI] [PMC free article] [PubMed] [Google Scholar]
- 9.Hilton IB et al. Epigenome editing by a CRISPR-Cas9-based acetyltransferase activates genes from promoters and enhancers. Nat. Biotechnol. 33, 510–517 (2015). [DOI] [PMC free article] [PubMed] [Google Scholar]
- 10.Kuscu C et al. Temporal and Spatial Epigenome Editing Allows Precise Gene Regulation in Mammalian Cells. J. Mol. Biol. 431, 111–121 (2019). [DOI] [PubMed] [Google Scholar]
- 11.Li K et al. Interrogation of enhancer function by enhancer-targeting CRISPR epigenetic editing. Nat. Commun. 11, 485 (2020). [DOI] [PMC free article] [PubMed] [Google Scholar]
- 12.Klann TS et al. CRISPR-Cas9 epigenome editing enables high-throughput screening for functional regulatory elements in the human genome. Nat. Biotechnol. 35, 561–568 (2017). [DOI] [PMC free article] [PubMed] [Google Scholar]
- 13.Mumbach MR et al. Enhancer connectome in primary human cells identifies target genes of disease-associated DNA elements. Nature Genetics vol. 49 1602–1612 (2017). [DOI] [PMC free article] [PubMed] [Google Scholar]
- 14.Simeonov DR et al. Discovery of stimulation-responsive immune enhancers with CRISPR activation. Nature 549, 111–115 (2017). [DOI] [PMC free article] [PubMed] [Google Scholar]
- 15.Tak YE et al. Inducible and multiplex gene regulation using CRISPR-Cpf1-based transcription factors. Nat. Methods 14, 1163–1166 (2017). [DOI] [PMC free article] [PubMed] [Google Scholar]
- 16.Laguna T et al. New insights on the transcriptional regulation of CD69 gene through a potent enhancer located in the conserved non-coding sequence 2. Molecular Immunology vol. 66 171–179 (2015). [DOI] [PubMed] [Google Scholar]
- 17.Chen JCJ & Goldhamer DJ The core enhancer is essential for proper timing of MyoD activation in limb buds and branchial arches. Dev. Biol. 265, 502–512 (2004). [DOI] [PubMed] [Google Scholar]
- 18.Wienert B, Martyn GE, Funnell APW, Quinlan KGR & Crossley M Wake-up Sleepy Gene: Reactivating Fetal Globin for β-Hemoglobinopathies. Trends Genet. 34, 927–940 (2018). [DOI] [PubMed] [Google Scholar]
- 19.Diepstraten ST & Hart AH Modelling human haemoglobin switching. Blood Rev. 33, 11–23 (2019). [DOI] [PubMed] [Google Scholar]
- 20.Sankaran VG & Orkin SH The switch from fetal to adult hemoglobin. Cold Spring Harb. Perspect. Med. 3, a011643 (2013). [DOI] [PMC free article] [PubMed] [Google Scholar]
- 21.Sankaran VG et al. Human fetal hemoglobin expression is regulated by the developmental stage-specific repressor BCL11A. Science 322, 1839–1842 (2008). [DOI] [PubMed] [Google Scholar]
- 22.Li Q, Harju S & Peterson KR Locus control regions: coming of age at a decade plus. Trends Genet. 15, 403–408 (1999). [DOI] [PubMed] [Google Scholar]
- 23.Zannis VI, Kan HY, Kritis A, Zanni EE & Kardassis D Transcriptional regulatory mechanisms of the human apolipoprotein genes in vitro and in vivo. Curr. Opin. Lipidol. 12, 181–207 (2001). [DOI] [PubMed] [Google Scholar]
- 24.Cavalli M et al. Allele-specific transcription factor binding to common and rare variants associated with disease and gene expression. Hum. Genet. 135, 485–497 (2016). [DOI] [PMC free article] [PubMed] [Google Scholar]
- 25.Spisák S et al. CAUSEL: an epigenome- and genome-editing pipeline for establishing function of noncoding GWAS variants. Nature Medicine vol. 21 1357–1363 (2015). [DOI] [PMC free article] [PubMed] [Google Scholar]
- 26.Bailey SD et al. ZNF143 provides sequence specificity to secure chromatin interactions at gene promoters. Nat. Commun. 2, 6186 (2015). [DOI] [PMC free article] [PubMed] [Google Scholar]
- 27.Tapscott SJ, Lassar AB & Weintraub H A novel myoblast enhancer element mediates MyoD transcription. Mol. Cell. Biol. 12, 4994–5003 (1992). [DOI] [PMC free article] [PubMed] [Google Scholar]
- 28.Jost M et al. Titrating gene expression using libraries of systematically attenuated CRISPR guide RNAs. Nat. Biotechnol. 38, 355–364 (2020). [DOI] [PMC free article] [PubMed] [Google Scholar]
- 29.Andersson R et al. An atlas of active enhancers across human cell types and tissues. Nature 507, 455–461 (2014). [DOI] [PMC free article] [PubMed] [Google Scholar]
- 30.ENCODE Project Consortium et al. Expanded encyclopaedias of DNA elements in the human and mouse genomes. Nature 583, 699–710 (2020). [DOI] [PMC free article] [PubMed] [Google Scholar]
- 31.Zhou D, Pawlik KM, Ren J, Sun C-W & Townes TM Differential binding of erythroid Krupple-like factor to embryonic/fetal globin gene promoters during development. J. Biol. Chem. 281, 16052–16057 (2006). [DOI] [PubMed] [Google Scholar]
- 32.Liu N et al. Direct Promoter Repression by BCL11A Controls the Fetal to Adult Hemoglobin Switch. Cell 173, 430–442.e17 (2018). [DOI] [PMC free article] [PubMed] [Google Scholar]
- 33.Liu N et al. Transcription factor competition at the γ-globin promoters controls hemoglobin switching. Nat. Genet. 53, 511–520 (2021). [DOI] [PMC free article] [PubMed] [Google Scholar]
- 34.Lek M et al. Analysis of protein-coding genetic variation in 60,706 humans. Nature 536, 285–291 (2016). [DOI] [PMC free article] [PubMed] [Google Scholar]
- 35.Cooper DN, Krawczak M, Polychronakos C, Tyler-Smith C & Kehrer-Sawatzki H Where genotype is not predictive of phenotype: towards an understanding of the molecular basis of reduced penetrance in human inherited disease. Hum. Genet. 132, 1077–1130 (2013). [DOI] [PMC free article] [PubMed] [Google Scholar]
- 36.Veitia RA, Caburet S & Birchler JA Mechanisms of Mendelian dominance. Clin. Genet. 93, 419–428 (2018). [DOI] [PubMed] [Google Scholar]
- 37.Matharu N et al. CRISPR-mediated activation of a promoter or enhancer rescues obesity caused by haploinsufficiency. Science 363, (2019). [DOI] [PMC free article] [PubMed] [Google Scholar]
- 38.Dang VT, Kassahn KS, Marcos AE & Ragan MA Identification of human haploinsufficient genes and their genomic proximity to segmental duplications. Eur. J. Hum. Genet. 16, 1350–1357 (2008). [DOI] [PubMed] [Google Scholar]
- 39.Inoue K & Fry EA Haploinsufficient tumor suppressor genes. Adv. Med. Biol. 118, 83–122 (2017). [PMC free article] [PubMed] [Google Scholar]
- 40.Pochampally RR, Horwitz EM, DiGirolamo CM, Stokes DS & Prockop DJ Correction of a mineralization defect by overexpression of a wild-type cDNA for COL1A1 in marrow stromal cells (MSCs) from a patient with osteogenesis imperfecta: a strategy for rescuing mutations that produce dominant-negative protein defects. Gene Therapy vol. 12 1119–1125 (2005). [DOI] [PubMed] [Google Scholar]
- 41.Liang JR, Lingeman E, Ahmed S & Corn JE Atlastins remodel the endoplasmic reticulum for selective autophagy. J. Cell Biol. 217, 3354–3367 (2018). [DOI] [PMC free article] [PubMed] [Google Scholar]
- 42.Bernstein BE et al. Genomic maps and comparative analysis of histone modifications in human and mouse. Cell 120, 169–181 (2005). [DOI] [PubMed] [Google Scholar]
- 43.Rohland N & Reich D Cost-effective, high-throughput DNA sequencing libraries for multiplexed target capture. Genome Res. 22, 939–946 (2012). [DOI] [PMC free article] [PubMed] [Google Scholar]
- 44.Li H & Durbin R Fast and accurate short read alignment with Burrows-Wheeler transform. Bioinformatics vol. 25 1754–1760 (2009). [DOI] [PMC free article] [PubMed] [Google Scholar]
- 45.Thorvaldsdóttir H, Robinson JT & Mesirov JP Integrative Genomics Viewer (IGV): high-performance genomics data visualization and exploration. Brief. Bioinform. 14, 178–192 (2013). [DOI] [PMC free article] [PubMed] [Google Scholar]
- 46.Quinlan AR & Hall IM BEDTools: a flexible suite of utilities for comparing genomic features. Bioinformatics 26, 841–842 (2010). [DOI] [PMC free article] [PubMed] [Google Scholar]
- 47.Trapnell C et al. Transcript assembly and quantification by RNA-Seq reveals unannotated transcripts and isoform switching during cell differentiation. Nat. Biotechnol. 28, 511–515 (2010). [DOI] [PMC free article] [PubMed] [Google Scholar]
- 48.Love MI, Huber W & Anders S Moderated estimation of fold change and dispersion for RNA-seq data with DESeq2. Genome Biol. 15, 550 (2014). [DOI] [PMC free article] [PubMed] [Google Scholar]
- 49.Mi H et al. Protocol Update for large-scale genome and gene function analysis with the PANTHER classification system (v.14.0). Nat. Protoc. 14, 703–721 (2019). [DOI] [PMC free article] [PubMed] [Google Scholar]
- 50.Corces MR et al. An improved ATAC-seq protocol reduces background and enables interrogation of frozen tissues. Nat. Methods 14, 959–962 (2017). [DOI] [PMC free article] [PubMed] [Google Scholar]
- 51.Buenrostro JD, Giresi PG, Zaba LC, Chang HY & Greenleaf WJ Transposition of native chromatin for fast and sensitive epigenomic profiling of open chromatin, DNA-binding proteins and nucleosome position. Nature Methods vol. 10 1213–1218 (2013). [DOI] [PMC free article] [PubMed] [Google Scholar]
- 52.Ktistaki E, Lacorte J-M, Katrakili N, Zannis VI & Talianidis I Transcriptional regulation of the apolipoprotein A-IV gene involves synergism between a proximal orphan receptor response element and a distant enhancer located in the upstream promoter region of the apolipoprotein C-III gene. Nucleic Acids Research vol. 22 4689–4696 (1994). [DOI] [PMC free article] [PubMed] [Google Scholar]
- 53.Clement K et al. CRISPResso2 provides accurate and rapid genome editing sequence analysis. Nat. Biotechnol. 37, 224–226 (2019). [DOI] [PMC free article] [PubMed] [Google Scholar]
- 54.Li B, Kadura I, Fu D-J & Watson DE Genotyping with TaqMAMA. Genomics 83, 311–320 (2004). [DOI] [PubMed] [Google Scholar]
- 55.Durand NC et al. Juicer Provides a One-Click System for Analyzing Loop-Resolution Hi-C Experiments. Cell Systems vol. 3 95–98 (2016). [DOI] [PMC free article] [PubMed] [Google Scholar]
- 56.Wang Y et al. SPIN reveals genome-wide landscape of nuclear compartmentalization. Genome Biol. 22, 36 (2021). [DOI] [PMC free article] [PubMed] [Google Scholar]
Associated Data
This section collects any data citations, data availability statements, or supplementary materials included in this article.
Supplementary Materials
Data Availability Statement
Data sets from amplicon sequencing have been deposited with the National Center for Biotechnology Information Sequence Read Archive https://www.ncbi.nlm.nih.gov/sra/PRJNA578485. Data sets from ChIP-seq, RNA-seq, and ATAC-seq experiments have been deposited with the Gene Expression Omnibus (GEO) repository with the accession number GSE 139190. GO Ontology database used in this study can be downloaded from https://bioportal.bioontology.org/ontologies/GO.


