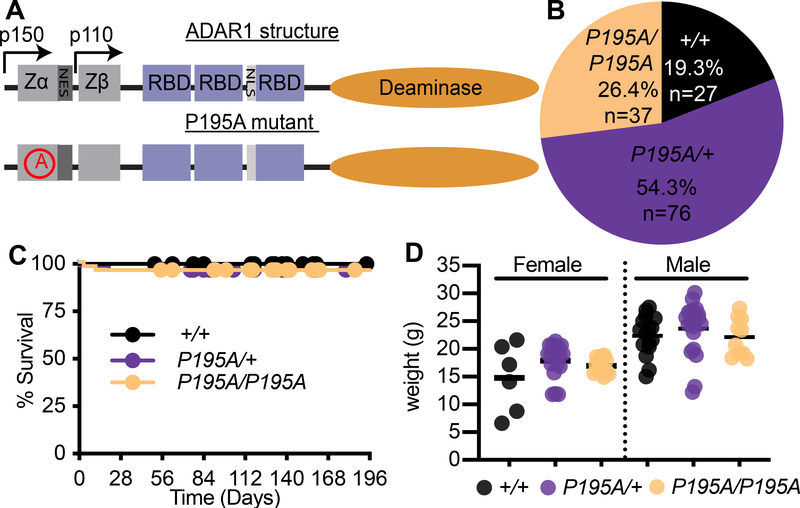
Figure 1. Adar P195A mice model the most common Aicardi-Goutieres Syndrome mutation.
(A) Schematic of the structure of ADAR1 protein, and the location of the P195A mutation. Zα, Zβ, = Z-DNA binding domains, NES = Nuclear export signal, NLS = nuclear localization signal.
(B) Percentage of mice of the indicated genotype from intercrosses of AdarP195A/+ mice. (n=140 pups)
(C) Survival of Adar+/+ (n=23), AdarP195A/+ (n=47), AdarP195A/P195A (n=48) mice.
(D) Weights of mice at 23 days of age. Adar+/+ (n= 6F,12M), AdarP195A/+ (n= 13F,14M), AdarP195A/P195A (n= 8F, 9M). Bar represents the mean. See also Figure S1.

