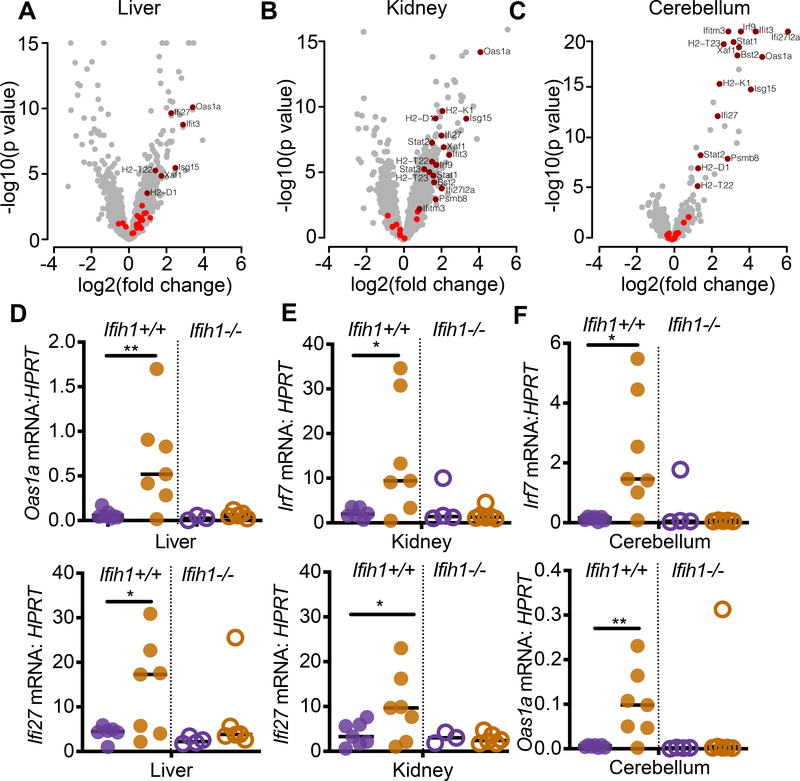
Figure 4. AdarP195A/p150− mice have an MDA5-dependent interferon signature.
(A-C) Expression data for ISGs, defined by the GO term ‘response to type I interferon,’ were evaluated in the liver, kidney, and cerebellum of 23 day old AdarP195A/p150− mice, plotting the log2 fold change over matched AdarP195A/p150+ control mice. ISGs that were not significantly changed are shown in bright red; significant expression changes are shown in dark red.
(D-F) Expression of ISGs identified in A-C, measured by TaqMan qPCR, in 23 day old mice of the indicated genotypes. AdarP195A/p150+ (n=6); AdarP195A/p150− (n=7); AdarP195A/p150+Ifihi1−/− (n=4); Adar P195A/p150− Ifih1−/− (n=6).

