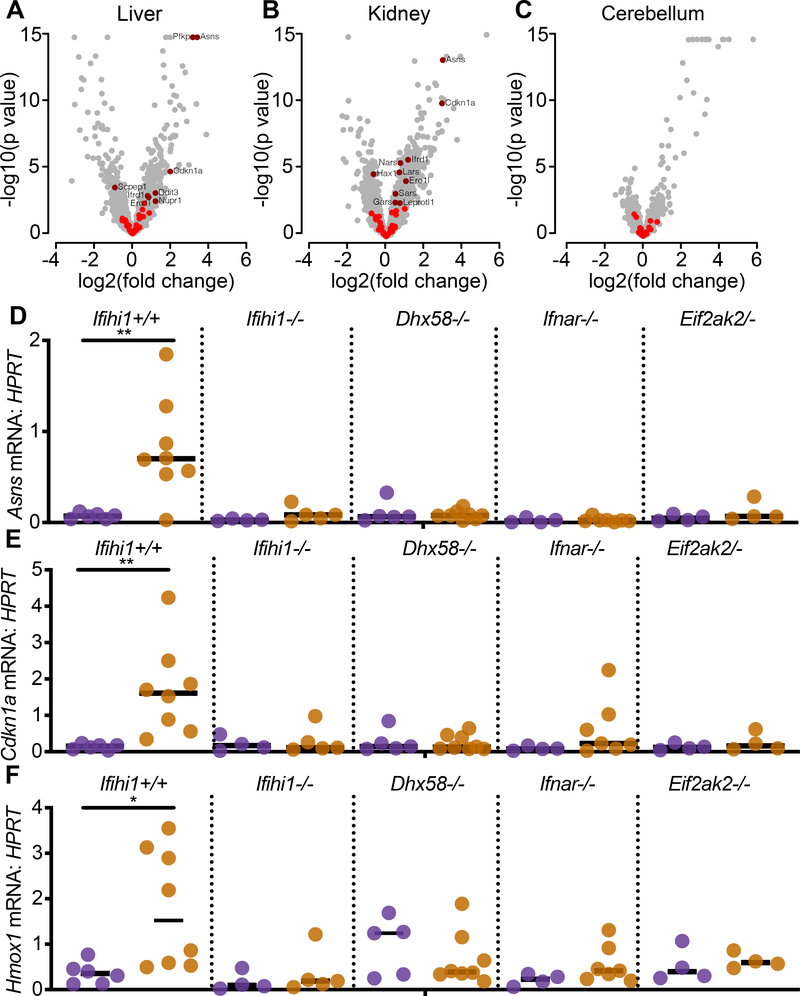
Figure 6. An ISR gene expression signature is evident in AdarP195A/p150− mice.
(A-C) Expression data for ISR gene set genes in the liver, kidney, and cerebellum of 23 day old AdarP195A/p150− mice (n=7), plotting the log2 fold change over control AdarP195A/p150+ (n=5) mice. ISR genes that are not significantly changed are shown in bright red; significant expression changes are shown in dark red.
(D-F) Expression of ISR transcripts identified in the livers of rescued mice, measured by TaqMan qRT-PCR, and compared among the indicated genotypes. Each data point represents an individual mouse. AdarP195A/p150+ (n=6); AdarP195A/p150− (n=7); AdarP195A/p150+Ifihi1−/− (n=4); AdarP195A/p150−Ifih1−/− (n=6); AdarP195A/p150+Dhx58−/− (n=7); AdarP195A/p150−Dhx58−/− (n=8); AdarP195A/p150+Ifnar1−/− (n=4); AdarP195A/p150− Ifnar1−/− (n=7); AdarP195A/p150+Eif2ak2−/− (n=4); AdarP195A/p150−Eif2ak2−/− mice (n=4).

