

Abstract
Nursing home (NH) residents and staff have been severely affected by the COVID‐19 pandemic. The aim of this study was to examine the use of weekly saliva RT‐qPCR testing for SARS‐CoV‐2 detection among NH workers as a strategy to control disease transmission within NHs in Belgium. From 16 November to 27 December 2020, a voluntary and anonymous weekly screening was implemented in a cohort of 50,000 workers across 572 NHs in the Walloon region of Belgium to detect asymptomatic cases of SARS‐CoV‐2 via saliva RT‐qPCR testing and using the Diagenode saliva sample collection device. Positive workers were isolated to avoid subsequent infections in residents and other staff. RT‐qPCR testing was based on pooled saliva sampling techniques from three workers, followed by individual testing of each positive or inconclusive pool. The majority of NHs (85%) and 55% of their workers participated. Pooling did not affect sensitivity as it only induced a very decrease in sensitivity estimated as 0.33%. Significant decreases in the prevalence (34.4–13.4%) and incidence of NHs with either single (13.8–2%) or multiple positive workers (3.7–0%) were observed over time. In addition, deaths among NH residents and NH worker absences decreased significantly over time. Weekly saliva RT‐qPCR testing for SARS‐CoV‐2 demonstrated large‐scale feasibility and efficacy in disrupting the chain of transmission. Implementation of this testing strategy in NHs could also be extended to other settings with the aim to control viral transmission for maintaining essential activities.
Keywords: Belgium, COVID‐19, nursing home, RT‐qPCR, saliva test, SARS‐CoV‐2, worker
1. INTRODUCTION
Infection with Severe Acute Respiratory Syndrome Coronavirus 2 (SARS‐CoV‐2) induces coronavirus infectious disease 19 (COVID‐19) (Coronaviridae Study Group of the International Committee on Taxonomy of Viruses, 2020). Since the first report on 31 December 2019, COVID‐19 has resulted in high morbidity with around 132 million confirmed cases worldwide (World Health Organization, 2021) and 0.99 million in Belgium (as of early May 2021). By the end of April 2021, there were around 24,250 deaths in Belgium with close to 53% of these occurring in nursing home (NH) residents (Sciensano, 2021a).
In the early second wave of the pandemic (late August 2020), Belgian NHs requested additional support to protect their vulnerable residents due to the severity of clinical symptoms in some patients (severe acute respiratory syndrome) and because the elderly are more severely affected by COVID‐19 (Saegerman et al., 2021). Mitigation measures were implemented and consisted of limiting external contacts, respecting physical distancing, room ventilation and using personal protective equipment. In addition, the Government of Wallonia in Belgium performed a voluntary and anonymous longitudinal screening study to examine the benefits of saliva testing for detecting the presence of SARS‐CoV‐2 among a large cohort of NH workers. Saliva collection is considered a potential alternative to nasopharyngeal sampling because of its technical simplicity. Additionally, it is non‐invasive and does not require the procedure to be performed by health care professionals. Thus, saliva testing is of interest for weekly repeated sampling strategies (Czumbel et al., 2020), such as those proposed for use in Belgian NHs to monitor and control the spread of SARS‐CoV‐2.
Recently, a meta‐analysis of saliva testing for SARS‐CoV‐2 detection reported a sensitivity of 91% (95% CI: 80–99) by quantitative reverse‐transcriptase polymerase chain reaction (RT‐qPCR), compared with 98% (95% CI: 89–100) when using nasopharyngeal swabs (NPS) (Czumbel et al., 2020). Moreover, another review reported a non‐significant difference in viral loads between nasopharyngeal or sputum and saliva samples (Fakheran et al., 2020). However, greater variation of viral loads has been observed with NPS compared with those from saliva specimens (Wyllie et al., 2020). In a cohort study of asymptomatic health care workers (n = 493), 13 tested positive for SARS‐CoV‐2 through saliva testing. Nine of these were also tested through NPS sampling, of which seven were negative. All 13 health care workers who tested positive through saliva testing were re‐confirmed to be infected (Wyllie et al., 2020). Finally, the pooling of samples (i.e., testing a few samples at once) may allow for the detection of SARS‐Cov‐2 with sufficient diagnostic accuracy (Lohse et al., 2020; Li et al., 2020; Eberhardt et al., 2020).
The primary aim of this study was to investigate the effectiveness and sensitivity of saliva testing in the detection of SARS‐CoV‐2 in a cohort of 50,000 workers across 572 Belgian NHs in Wallonia. In addition, this study examined the impact of a weekly saliva testing control strategy on SARS‐CoV‐2 prevalence and incidence among NH workers.
2. MATERIALS AND METHODS
2.1. Study population and timeline
Based on specific governmental measures implemented in Belgium during the pandemic, we identified three periods of interest: the first wave (starting from the discovery of the first case on 2 March until 21 June 2020), the inter‐wave period (22 June until 30 August 2020) and the second wave (from 31 August, ongoing). This study was performed in the second wave, from weeks 47 to 52 of 2020 (16 November to 27 December 2020).
The population of employees among 572 NHs was estimated to be 49,816, including trainees, volunteers and freelancers, but excluding people on leave, working part‐time, dismissed due to illness or unavailable at the time of testing. A maximum of 32,900 tests per week was set, corresponding to the estimated maximum at‐risk population at the time.
2.2. Organization of screening tests for NH workers
The logistical and organizational system, which aimed to guarantee a short sample delivery time, was based on 13 relay points. This system ensured a smooth interface between NHs, suppliers, logistics operators and the University of Liège COVID‐19 laboratory (Appendix S1).
2.3. Saliva auto‐sampling kit
Fresh saliva was collected using a sampling device designed by the University of Liège and commercialized by Diagenode (Seraing, Belgium). Instructions for using the sampling kit are found in Appendix S2. The device does not require the intervention of medical personnel and contains an integrated process for viral inactivation. In brief, the saliva device consists in a tube fitted with a funnel that doses the volume of saliva that enters the tube. In the tube, the saliva is mixed with a reagent that permits the inactivation of the SARS‐CoV‐2. This procedure ensures the safe shipment of the sample and safe manipulation by the laboratory workers subsequently.
2.4. Laboratory analysis
2.4.1. RNA extraction from saliva and pooling
In the collection device, saliva was diluted to a 1:1 ratio with an extraction buffer containing 1 M guanidine thiocyanate (GITC). Samples were incubated at 80°C for 40 min. For pooled RNA extractions, 60 μl of saliva per sample (pools of three) was added to 180 μl of a lysis buffer containing GITC 4 M. For individual RNA extractions, 100 μl of saliva per sample was added to 300 μl of a lysis buffer containing GITC 4 M. All samples were spiked with a purified MS2 bacteriophage according to the manufacturer's protocol (Thermo Fisher A47817). RNA extraction was performed using the CoRNA Isolation Kit (Diagenode, Seraing, Belgium) and 50 μl of magnetic beads. Extracted RNA was eluted from magnetic beads in 50 μl of UltraPure DNase/RNasefree distilled water.
2.4.2. RT‐qPCR assay
We performed a multiplex RT‐qPCR assay using the TaqPath RT‐PCR COVID‐19 kit (ThermoFisher A47817) together with the TaqPath one‐step master mix – No ROX (ThermoFisher CN A28523). This RT‐qPCR assay targets three viral genes, ORF1ab, N and S genes. All reactions were performed using a 384w format (final volume of 20 μl) in a QS5 thermocycler (Applied Biosciences, Waltham, MA, USA). RT‐qPCR reactions were prepared as follows: 5 μl of 4× TaqPath Multiplex MasterMix, 1 μl of COVID‐19 Real‐Time PCR assay, 6 μl of water and 8 μl of RNA (samples or controls). TaqPath™ COVID‐19 positive Control (ThermoFisher A48003; ThermoFisher) at 25 genomic copies/μl was used. The RT‐qPCR was run in standard mode, consisting of a hold stage at 25°C for 2 min, 53°C for 10 min and 95°C for 2 min, followed by 40 cycles of a PCR stage at 95°C for 3 s, then 60°C for 30 s with a 1.6°C/s ramp up and down rate. Results were analyzed using FastFinder software (Ugentec, Hasselt, Belgium) and expressed as quantification cycles (Ct value, i.e., number of cycles required for the quantification of a fluorescent signal to be considered positive) with a positivity limit fixed at a Ct < 37.
2.4.3. Interpretation of results
Samples were considered negative when no viral genes could be detected below a Ct value of 37 and when the MS2 internal control was under a Ct value of 30. All individual samples were pooled in threes. If a pool was negative, the status of all associated individual samples was considered negative. If a pool was positive or inconclusive, each associated sample was retested individually.
2.5. Impact of pooling
In order to determine the impact of pooling (i.e., pools of three individual samples) on final individual results, a random selection of 501 negative pools were de‐pooled and individually tested (n = 1503 samples).
2.6. Statistical analysis
Exact binomial distributions were used to derive 95% confidence intervals (95% CI) of prevalence and incidence rates (Petrie & Watson, 2013). Chi‐square and Fisher's exact tests were used to compare frequencies between groups (Petrie & Watson, 2013).
Representativeness was checked by comparing characteristics (region, size or type of NH, i.e., with mono or multi‐sites) of participating versus non‐participating NHs using binary or Firth's logistic regression models (Heinze & Schemper, 2002). Multivariate models were applied using variables with p values < .20 at the univariate stage. Collinearity was checked through backwards elimination of variables (Preux et al., 2005) and Hosmer–Lemeshow goodness of fit testing (Petrie & Watson, 2013).
The relationship between prevalence rate (arcsine transformation) and the odds of a NH presenting with at least one positive test result (herein, referred to as a ‘positive NH’) per week was assessed using a linear regression and Chi‐square test for linear and non‐linear trends (Petrie & Watson, 2013).
Incidence was analyzed using negative binomial regressions.
Differences in the number of absent workers and deaths over time in Belgian NHs between the regions of Wallonia (in the south) and Flanders (in the north) were analyzed through a time series regression using generalized least squares, allowing for possible autocorrelations (Fox & Weisberg, 2018).
All analyses were performed using Stata SE 14.2 (StataCorp, 2015) and R (R Core Team, 2013). The alpha level was set to .05. In addition, Quantum GIS (Geographic Information System) version 3.16.2 was used to edit specific maps (QGIS Development Team, 2020).
3. RESULTS
3.1. Participation rate of NHs and its workers
NH participation rates reached 85% during the last 4 weeks of the study period. Most NHs participated in the saliva screening for SARS‐CoV‐2 detection at least five (N = 256) or six times (N = 145) (Table 1), with participation rates reaching 26% in the first week (W) and 51–57% in the following weeks. Thus, there was a cumulative 530 participating NHs with an estimated maximum 32,900 active workers.
TABLE 1.
Number of NHs participating in the saliva COVID‐19 testing by number of weeks of participation
| Number of week(s) of participation | Number of NHs (%) |
|---|---|
| 0 | 42 (7.3) |
| 1 | 11 (1.9) |
| 2 | 17 (3.0) |
| 3 | 37 (6.5) |
| 4 | 64 (11.2) |
| 5 | 256 (44.8) |
| 6 | 145 (25.3) |
| Total | 572 |
3.2. Representativeness
No significant difference was found between participating (N = 530) and non‐participating (N = 42) NHs in the saliva screening by region (Firth logit regression; p value > .05), NH worker population size (Logistic regression; p value > .05), or the combination of the two (Firth logit regression; p value > .05) (Figure 1). The chi‐square of the Hosmer–Lemeshow goodness‐of‐fit test (8 df; α = .05) was 5 (p value = .76), and thus, NH representativeness was considered acceptable.
FIGURE 1.
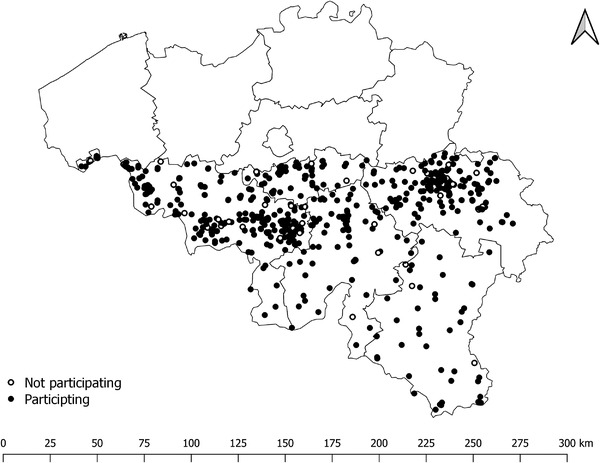
Participating (N = 530) and non‐participating (N = 42) NHs in the study; map of Belgium, with Wallonia located in the south
3.3. Availability and reliability of results
Saliva testing results were delivered in a timely manner by the University of Liège COVID‐19 platform with 51% being delivered within 6 h, 98.3% within 12 h, 99.75% within 24 h and 100% within 36 h. The proportion of uninterpretable test results was 2.3% in week 47, decreasing to 0.2% in week 52.
3.4. Impact of pooling on test sensitivity
Of the 1503 samples from 501 negative pools selected randomly, only five samples (0.33%) were positive when retested individually. All were from different pools and monogenic, three were detected with the N protein gene (Ct values of 31.27, 34.26 and 36.25) and two with the S protein gene (Ct values of 35.14 and 30.78).
3.5. Prevalence trends in NHs and their workers
There was a significant linear decrease in the prevalence rates of NHs with at least one positive worker or with at least two positive workers from week 47 (34.4%) to 52 (13.4%) (Chi‐square linear trend(5 df; α = .05) = 651 and 169, respectively; p value < .0001). In the same period, the prevalence rate of positive workers per NH increased significantly between weeks 47 and 51 (Chi‐square for linear trend(4 df; α = .05) = 41; p value < .0001), but decreased in week 52. There was also a significant non‐linear decrease in the prevalence rate of positive workers among all NHs between weeks 47 and 52 (Chi‐square for non‐linear trend(4 df; α = .05) = 164; p value = .0025).
3.6. Regional trends in odds of NHs with positive RT‐qPCR results
The odds of a positive RT‐qPCR result decreased each week at the NH level (Table 2). Cumulative odds were calculated for the whole period (weeks 47–52) and mapped for Wallonia (Figure 2).
TABLE 2.
Trends in the odds of positive RT‐qPCR results by week in Wallonia
| Week | Mean | Standard deviation |
|---|---|---|
| 47 | .014 | .031 |
| 48 | .013 | .030 |
| 49 | .011 | .031 |
| 50 | .011 | .039 |
| 51 | .010 | .032 |
| 52 | .007 | .027 |
FIGURE 2.
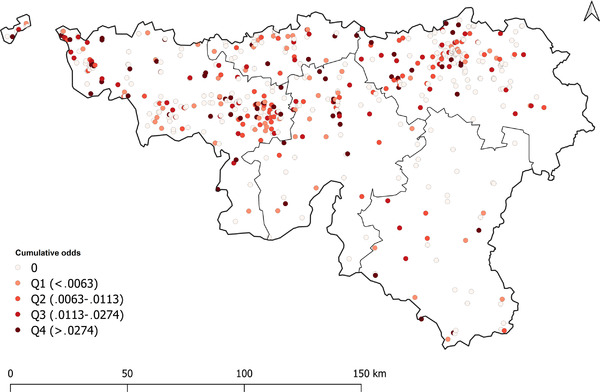
Map of Wallonia; cumulative odds of positive RT‐qPCR results by nursing home and quartile.
Legend: Q1, Q2, Q3 and Q4 are the quartiles
The odds ratio linear regression indicates that no particular NH characteristics were responsible for this decrease in either univariate or multivariate models (p value > .05).
3.7. Incidence trends of positive NHs over time
The SARS‐CoV‐2 incidence rate was determined based on the follow‐up of 361 NHs that participated in five consecutive screenings (W48 until W52), where 68.1% (n = 246) of NHs were negative at week 48. Among these 246 NHs, 72.8% remained negative over the whole period (n = 179), whereas 27.2% became positive over the remainder of the study period (n = 67) (Table 3). There was a significant decrease in incidence over time for NHs presenting with either single (p value = .02 at W50, .001 at W51 and <.001 at W52) or multiple positive workers (W51‐52; p value = .037).
TABLE 3.
Weekly incidence of NHs presenting with positive SARS‐CoV‐2 tests (N = 246)
| Incidence (%) in NHs | ||
|---|---|---|
| Week | ≥1 positive worker | ≥2 positive workers a |
| 49 | 34 (13.8) | 9 (3.7) |
| 50 | 17 (6.9) | 4 (1.6) |
| 51 | 11 (4.5) | 1 (.4) |
| 52 | 5 (2.0) | 0 (.0) |
| Total | 67 (27.2) | 14 (5.7) |
Considered as a cluster according to Belgian federal guidelines (Sciensano, 2020).
The ongoing trends in newly detected positive NHs was dependent on the number of positive workers in the initial screening. There was a significantly different pattern over time depending on whether single or multiple workers tested positive in the first screening (p value < .001). When a single positive worker was discovered, in most cases, no worker (26 out of 48) or only one additional worker (16 out of 48) tested positive afterwards. When at least two workers tested positive after the first screening (i.e., a cluster), in most cases, multiple additional positive workers were subsequently detected (10 out of 14).
3.8. Association between weekly saliva testing in NHs and decreases in the number of deaths and worker absences over time
To examine if there was a decrease in the number of absent NH workers (Figure 3(a)) and deaths in NH residents (Figure 3(b)) per region as a function of time, we compared our data with that from available public reports (Sciensano, 2021b) using time series regressions. An Autoregressive Moving Average Model – ARMA (0,1) was selected based on an examination of residual deaths. At first, there were significantly more deaths in Wallonia (beta = .267, p < .001) than in Flanders, which reversed over time (beta = −.002, p = .027). The decrease was more significant in Wallonia (beta = −.011, p < .001).
FIGURE 3.
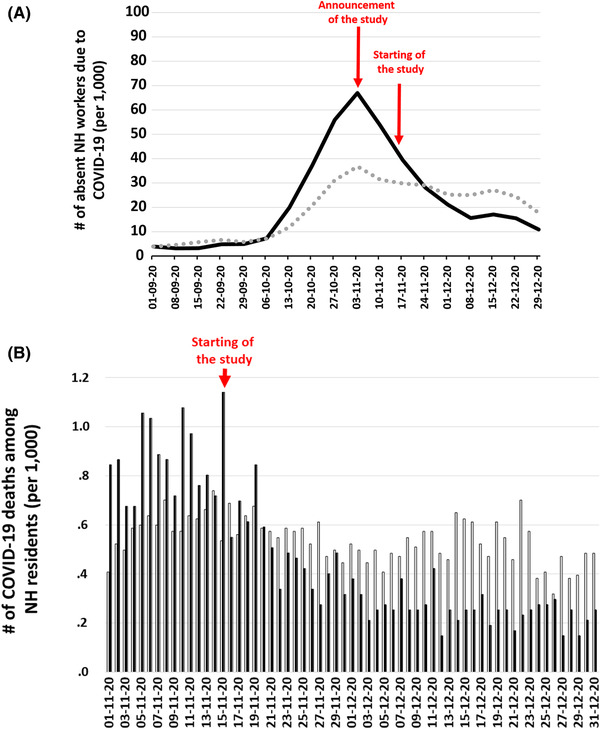
Regional trends during second wave in (a) the number of possible or confirmed COVID‐19 cases per 1000 absent NH workers, and (b) number of COVID‐19 deaths per 1000 NH residents (derived from Sciensano, 2021b). NH, Nursing home; (a) black line represents Wallonia; grey dash represents Flanders; (b) black bars represent Wallonia, grey bars represent Flanders
The number of absent workers did not correlate with the autoregressive or moving average patterns in the residuals. There were significantly more absent workers in Wallonia (beta = 70.055, p < .001) than in Flanders, with a significant decrease over time in the number of absent workers in both regions (beta = −1.778, p = .033). However, this trend was more pronounced in Wallonia (beta = −4.831, p < .001) than in Flanders (Table 4).
TABLE 4.
Time series regression modelling the difference in the number of absent NH workers and deaths in NH residents due to COVID‐19, per region over time, and region by time effect
| Number of absences per 1000 NH workers | Number of deaths per 1000 NH residents | |||||
|---|---|---|---|---|---|---|
| Independent variables | Coefficient | SE | p value | Coefficient | SE | p value |
| Intercept | 52.340 | 10.692 | <.001 | .610 | .036 | <.001 |
| Region – Wallonia a | 70.055 | 15.121 | <.001 | .267 | .051 | <.001 |
| Day | −1.778 | .751 | .033 | −.002 | .001 | .027 |
| Region – Day | −4.831 | 1.062 | <.001 | −.011 | .001 | <.001 |
The reference region is Flanders.
4. DISCUSSION
To our knowledge, the present study is the first large‐scale longitudinal study assessing the efficiency of a SARS‐CoV‐2 control strategy using saliva testing with RT‐qPCR and pooled sampling methods. The main principle of the strategy was based on the early detection of SARS‐CoV‐2 asymptomatic workers and isolation of RT‐qPCR positive workers at home for 7 days, followed by an additional seven days of caution. These periods were defined based on previous studies (Sciensano, 2021b).
The feasibility of this study was evidenced by indicators such as the availability of results within half a day in 98.3% of cases and a constant decrease in invalid results (0.2% in the last week of the study). This may be explained by the ease of sampling procedures, which did not require any medical assistance.
Participation rates were around 85% among NHs and 55% among NH workers during a majority of the study. During the SARS‐CoV‐2 saliva screening, the prevalence rate of positive NHs decreased from 34.4% in week 47 to 13.4% in week 52. In the same period, the prevalence rate of positive workers in NHs increased significantly, and then decreased in week 52. Moreover, during the same period, the mortality rate of NH residents decreased, suggesting the efficacy of a weekly saliva testing strategy in workers for reducing SARS‐CoV‐2 transmission. This global decreasing trend in NH prevalence rates was related to the progressively significant decrease in incidence, both for single (13.8% in week 47, falling to 2% in week 52) and multiples positive workers (3.7% in week 47, falling to 0% in week 52). In addition, we observed a significant difference in the trends of newly positive NHs, which may have an important effect on the transmission rate of the virus. When a single worker tested positive at first screening, in most cases, there was none or only one additional worker that tested positive. Conversely, when at least two workers tested positive at first screening, multiple positive workers were discovered afterwards. This finding suggests the prevention of future transmission events when a single positive worker is detected and isolated, and hence, a decrease in infections among NH residents due to infected asymptomatic workers. On the other hand, this finding highlights the need for proactive actions when at least two positive workers are discovered in a NH, that is, mandatory screening of all associated workers and residents to disrupt the SARS‐CoV‐2 transmission chain. The present results suggest that health authorities should support the assessment of any clusters of at least two positive workers.
The follow‐up of a first newly positive NH by the discovery of other positive workers(s) in the same NH over time was a raw surrogate estimation of the positive predictive value (i.e., the confidence in a positive result) of the testing procedure in place (36 out of 62). Indeed, the lower limit of the 95% CI of this positive predictive value was 58%. It is the minimum because of possible termination of the transmission chain of SARS‐CoV‐2 when a single positive worker is detected and isolated. This hypothesis is highly probable given the low Ct values observed for some screened workers who tested positive.
During the saliva screening period, there was evidence of a progressive linear decrease in the odds of positive NHs over time. No particular risk factors, based on NH characteristics, were observed. Thus, the observed decrease might be related to the positive effect of the saliva screening strategy.
Finally, available information (Sciensano, 2021b) at the national level was used to explore the benefit of a saliva screening strategy. The main difference in mitigation strategies between Flanders and Wallonia was the weekly SARS‐CoV‐2 saliva testing, which was only being implemented at a large scale in Wallonia. After the first announcement of the saliva screening study for SARS‐CoV‐2 and its implementation, the decreasing trend of absent workers due to COVID‐19 was more pronounced in Wallonia than in Flanders. One hypothesis for this may be an improvement in confidence towards crisis management among NH workers.
In addition, the decrease (slope) in deaths among NH residents was more significant over time in Wallonia than in Flanders. The follow‐up of these two parameters — one directly related to the number of NH workers affected by COVID‐19, and the other related to the number of NH residents that could be infected by these workers — indicated a strong benefit in a SARS‐CoV‐2 saliva testing strategy. In addition, mortality statistics on NH residents was available for the first COVID‐19 wave (but not for NH worker absences). During the first wave, no difference was observed in the number of deaths per 1000 NH residents between the two regions, as the ratio of this number between Wallonia and Flanders was normally distributed around 1 (p value = .16) (Figure 4). These observations indicate a beneficial effect of the SARS‐CoV‐2 saliva testing strategy implemented in Wallonia during the second SARS‐CoV‐2 wave. In addition, the saliva RT‐qPCR testing of workers for SARS‐CoV‐2 should be also valuable in view of possible further contamination of residents by workers that can be infected by new variants of SARS‐CoV‐2, as these variants appear to induce disease even in vaccinated elderly people (e.g., Garcia‐Beltran et al., 2021; Harvey et al., 2021).
FIGURE 4.
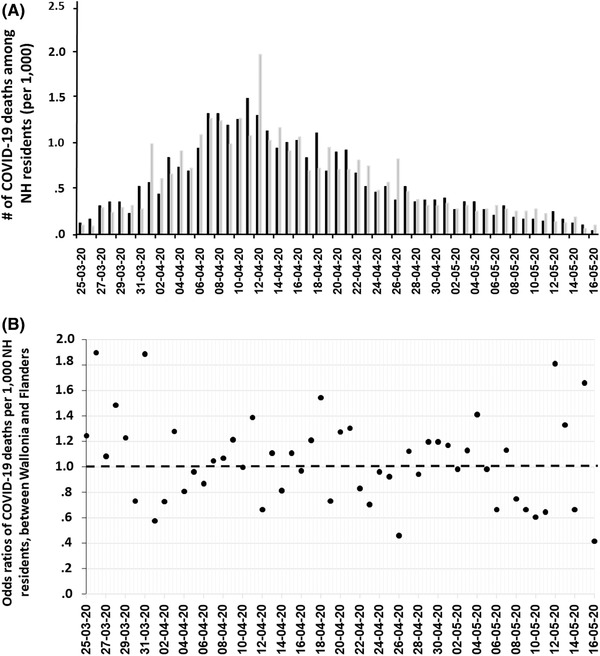
During the first wave, (a) regional trends in the number of deaths due to COVID‐19 per 1000 NH residents, and (b) the ratio between deaths in Wallonia/Flanders over time (Derived from Sciensano, 2021b). NH, Nursing home; (a) bars in black represent Wallonia, while bars in grey represent Flanders
There are limitations to this study. Due to the voluntary nature of the study, insufficient participation rates may have impacted the efficacy of the testing strategy. However, a secure web‐based platform allowing for access to test results in real‐time may have enhanced confidence in the strategy and increased participation. Both future statistical and social modelling studies should consider estimating the minimal level of participation and the respective optimal determinants. Another limitation includes the accurate estimation of the number of at‐risk workers per week (i.e., a maximum estimated at 32,900). With this maximum number, the participation rate of workers was estimated at 55% in the last 4 out of 5 weeks of the study. However, this rate was probably higher as it was calculated based on the maximum number of workers present each week. More real‐time information on the number of at‐risk workers per week should be tracked to allow for a more accurate future estimation. Finally, deaths in NH residents due to COVID‐19 included both possible (person whose symptoms of acute lower or upper respiratory tract infection appeared or worsened when the patient had chronic respiratory symptoms) and laboratory‐confirmed COVID‐19 cases. Complete and clear cause of death descriptions for all NH residents were not feasible at the time. Nevertheless, as Belgium is a small country, the implementation of a weekly saliva screening strategy in Wallonia was postulated as the primary reason for differences among NHs between the two regions during the studied period.
5. CONCLUSION
The proposed COVID‐19 weekly saliva RT‐qPCR screening strategy among NH workers, coupled with a secure web‐based user interface for receiving test results, demonstrated large‐scale feasibility in a minimal amount of time. The strategy may have resulted in the disruption of SARS‐CoV‐2 circulation in NHs, with a significant decrease in the number of absent workers and deaths among residents. This proof‐of‐concept strategy in a real‐world setting may allow for its extension to workers from other fields or industries, where prevention of SARS‐CoV‐2 transmission can contribute to breaking the COVID‐19 pandemic cycle while maintaining essential activities. It also permits the extension of this methodology to other virus‐related outbreaks in the future. At a policy level, the trends in SARS‐CoV‐2 infections among two or more positive workers suggest the importance of proactive strategies by health authorities in terms of further testing and assessment to effectively manage viral transmission in NHs.
AUTHOR CONTRIBUTIONS
C. S., W. C., L. G., A. F. D., M. D., F. M. and C. B. verified the underlying data. M. D., O. E., C. G., J. S., E. G., F. Min., W. C., L. G. and F. B. conducted the laboratory analyses. C. S., A. F. D., A. N. D., N. S. and V. R. conducted the statistical analyses. C. B. and L. S. collected the data, for which C. S. is guarantor. C. S., A. F. D., N. S., A. N. D. and N. S. drafted the manuscript, while A. W. reviewed and edited it for clarity. C. S., A. F. D., C. B., L. G. and F. B. contributed to the study design. All authors approved the final version of the manuscript. L. G. and F. B. contributed equally to this work.
CONFLICT OF INTEREST
The two last authors are the inventors of the device used in the saliva collection kit. This device was patented (EP20186086.3) and produced by Diagenode (Seraing, Belgium) under a commercial agreement with the University of Liège. This does not alter the adherence to all journal policies on sharing data and materials, as detailed online in the Author Guide.
ETHICAL APPROVAL
The study was commissioned by the Government of Wallonia within the framework of a public contract initiated by AViQ, as well as the University of Liège. The study was approved by the Ethical Committee of the University of Liège (reference number: 2021–100).
The authorization to publish was obtained after assessment by AViQ. This autonomous public interest organization (OIP) manages the competencies of health, welfare, support for the elderly, disability and family allowances (https://www.aviq.be/).
Supporting information
Supporting information.
Appendix S1. General organisation of saliva screening procedures for the detection of SARS‐CoV‐2 in NH workers
Supporting information.
Appendix S2. SARS‐CoV‐2 screening test ‐ Instructions for use
ACKNOWLEDGEMENTS
We gratefully acknowledge the Government of Wallonia for their financial support within the framework of a public contract initiated by the Walloon Agency for a Quality Life (AViQ), as well as Liège University for their collaboration in the project. This work would not have been accomplished without the engagement of participating NHs and people involved in the University of Liège Covid‐19 Platform, in particular E. Baudri, W. Berriche, B. Boniver, J. Fonzé, H. Gillet, S. Guilliams, J. Noël, T. Nothomb, M. Pathammavong, J. Patiny, L. Robaye, J. Smeets, D. Tonneau, Z. Truffaut, T. Weigert. Therefore, we thank them for their dedicated time and trust. Raw data used to generate Figure 3 were provided by Sciensano, the Belgian Institute for Health.
Saegerman, C. , Donneau, A‐F. , Speybroeck, N. , Diep, A. N. , Williams, A. , Stamatakis, L. , Coppieters, W. , Michel, F. , Breuer, C. , Dandoy, M. , Ek, O. , Gourzones, C. , Schyns, J. , Goffin, E. , Minner, F. , Renault, V. , Gillet, L. , & Bureau, F. (2022). Repetitive saliva‐based mass screening as a tool for controlling SARS‐CoV‐2 transmission in nursing homes. Transboundary and Emerging Diseases, 69, e194–e203. 10.1111/tbed.14280
DATA AVAILABILITY STATEMENT
The data that support the findings of this study are available from the corresponding author upon request.
REFERENCES
- Coronaviridae Study Group of the International Committee on Taxonomy of Viruses . The species severe acute respiratory syndrome‐related coronavirus: Classifying 2019‐nCoV and naming it SARS‐CoV‐2. (2020). Nature Microbiology, 5, 536–544. 10.1038/s41564-020-0695-z [DOI] [PMC free article] [PubMed] [Google Scholar]
- Czumbel, L. M. , Kiss, S. , Farkas, N. , Mandel, I. , Hegyi, A. , Nagy, Á. , Lohinai, Z. , Szakács, Z. , Hegyi, P. , Steward, M. C. , & Varga, G. (2020). Saliva as a candidate for COVID‐19 diagnostic testing: a meta‐analysis. Frontiers in Medicine, 7, 465. 10.3389/fmed.2020.00465 [DOI] [PMC free article] [PubMed] [Google Scholar]
- Eberhardt, J. N. , Breuckmann, N. P. , & Eberhardt, C. S. (2020). Challenges and issues of SARS‐CoV‐2 pool testing. The Lancet Infectious Diseases, 20(11), 1233–1234. 10.1016/S1473-3099(20)30467-9 [DOI] [PMC free article] [PubMed] [Google Scholar]
- Fakheran, O. , Dehghannejad, M. , & Khademi, A. (2020). Saliva as a diagnostic specimen for detection of SARS‐CoV‐2 in suspected patients: a scoping review. Infectious Diseases of Poverty, 9(1), 100. 10.1186/s40249-020-00728-w [DOI] [PMC free article] [PubMed] [Google Scholar]
- Fox, J. , & Weisberg, S. (2018). An R Companion to Applied Regression. third edition. Sage, Thousand Oaks, CA: [Google Scholar]
- Garcia‐Beltran, W. F. , Lam, E. C. , St Denis, K. , Nitido, A. D. , Garcia, Z. H. , Hauser, B. M. , Feldman, J. , Pavlovic, M. N. , Gregory, D. J. , Poznansky, M. C. , Sigal, A. , Schmidt, A. G. , Iafrate, A. J. , Naranbhai, V. , & Balazs, A. B. (2021). Multiple SARS‐CoV‐2 variants escape neutralization by vaccine‐induced humoral immunity. Cell, 184(9), 2372–2383.e9. 10.1016/j.cell.2021.03.013 [DOI] [PMC free article] [PubMed] [Google Scholar]
- Harvey, W. T. , Carabelli, A. M. , Jackson, B. , Gupta, R. K. , Thomson, E. C. , Harrison, E. M. , Ludden, C. , Reeve, R. , Rambaut, A. , COVID‐19 Genomics UK (COG‐UK) Consortium , Peacock, S. J. , & Robertson, D. L. (2021). SARS‐CoV‐2 variants, spike mutations and immune escape. Nature Reviews Microbiology, 1–16. 10.1038/s41579-021-00573-0 [DOI] [PMC free article] [PubMed] [Google Scholar]
- Heinze, G. , & Schemper, M. (2002). A solution to the problem of separation in logistic regression. Statistics in Medicine, 21, 2409–2419. [DOI] [PubMed] [Google Scholar]
- Li, Y. , Li, K. , Xiong, W. , Wang, X. , Liu, C. , Liu, C. , Tan, W. , Luo, B. , Zhu, Y. , Wu, Y. , Yin, H. , Li, X. , & Li, Z. (2020). Clinical characteristics and viral shedding kinetics of 38 asymptomatic patients with coronavirus disease 2019: A retrospective observational study. Medicine, 99(51), e23547. 10.1097/MD.0000000000023547 [DOI] [PMC free article] [PubMed] [Google Scholar]
- Lohse, S. , Pfuhl, T. , Berkó‐Göttel, B. , Rissland, J. , Geißler, T. , Gärtner, B. , Becker, S. L. , Schneitler, S. , & Smola, S. (2020). Pooling of samples for testing for SARS‐CoV‐2 in asymptomatic people. The Lancet Infectious Diseases, 20(11), 1231–1232. 10.1016/S1473-3099(20)30362-5 [DOI] [PMC free article] [PubMed] [Google Scholar]
- Petrie, A. , & Watson, P. (2013). Statistics for veterinary and animal science. This edition, John Wiley & Sons, Ltd, West Sussex, UK, 391. [Google Scholar]
- Preux, P. M. , Odermatt, P. , Perna, A. , Marin, B. , & Vergnenégre, A. (2005). Qu'est‐ce qu'une régression logistique ? Revue Des Maladies Respiratoires, 22, 159–162. [DOI] [PMC free article] [PubMed] [Google Scholar]
- QGIS Development Team . (2020). QGIS Geographic Information System. Open‐Source Geospatial Foundation, URL http://qgis.org
- R Core Team . (2013). R: A language and environment for statistical computer. R Foundation for Statistical Computing, Vienna, Austria, https://www.r‐project.org [Google Scholar]
- Saegerman, C. , Gilbert, A. , Donneau, A. ‐. F. , Gangolf, M. , Nguvet Diep, A. , Meix, C. , Bontems, S. , Hayette, M. ‐. P. , D'Orio, V. , & Ghuysen, A. (2021). Clinical decision support tool for diagnosis of COVID‐19 in hospitals. PLoS One, 6(3), e0247773. 10.1371/journal.pone.0247773 [DOI] [PMC free article] [PubMed] [Google Scholar]
- Sciensano . (2021a) Belgium COVID‐19 Epidemiological Situation. Epistat. https://epistat.wiv‐isp.be/covid/covid‐19.html (accessed May 2, 2021).
- Sciensano . (2020) Définition de cas, indications de demande d'un test et déclaration obligatoire de cas COVID‐19. Version du 31 décembre 2020. Sciensano, Bruxelles, Belgium, https://covid‐19.sciensano.be/sites/default/files/Covid19/COVID‐19_Case%20definition_Testing_FR.pdf
- Sciensano . (2021b) Surveillance en maisons de repos et maisons de repos et de soins. Rapport de la semaine 52 (données jusqu'au 5 janvier 2021 inclus). Sciensano, Bruxelles, Belgique. https://covid‐19.sciensano.be/sites/default/files/Covid19/COVID‐19_Surveillance_MR_MRS.pdf
- StataCorp . (2015). Stata Statistical Software: Release 14. College Station, TX: StataCorp LP, USA.
- World Health Organization . (2021) WHO Coronavirus (COVID‐19) Dashboard. https://covid19.who.int/ (accessed May 2, 2021).
- Wyllie, A. L. , Fournier, J. , Casanovas‐Massana, A. , Campbell, M. , Tokuyama, M. , Vijayakumar, P. , Warren, J. L. , Geng, B. , Muenker, M. C. , Moore, A. J. , Vogels, C. B. F. , Petrone, A. E. , Ott, I. M. , Lu, P. , Venkataraman, A. , Lu‐Culligan, A. , Klein, J. , Earnest, R. , Simonov, M. , … Ko, A. I. (2020). Saliva or Nasopharyngeal Swab Specimens for Detection of SARS‐CoV‐2. New England Journal of Medicine, 383(13):1283–1286. 10.1056/NEJMc2016359 [DOI] [PMC free article] [PubMed] [Google Scholar]
Associated Data
This section collects any data citations, data availability statements, or supplementary materials included in this article.
Supplementary Materials
Supporting information.
Appendix S1. General organisation of saliva screening procedures for the detection of SARS‐CoV‐2 in NH workers
Supporting information.
Appendix S2. SARS‐CoV‐2 screening test ‐ Instructions for use
Data Availability Statement
The data that support the findings of this study are available from the corresponding author upon request.