Abstract
Sustained pain is a major characteristic of clinical pain disorders, but it is difficult to assess in isolation from co-occurring cognitive and emotional features in patients. In this study, we developed a functional magnetic resonance imaging signature based on whole-brain functional connectivity that tracks experimentally induced tonic pain intensity and tested its sensitivity, specificity and generalizability to clinical pain across six studies (total n = 334). The signature displayed high sensitivity and specificity to tonic pain across three independent studies of orofacial tonic pain and aversive taste. It also predicted clinical pain severity and classified patients versus controls in two independent studies of clinical low back pain. Tonic and clinical pain showed similar network-level representations, particularly in somatomotor, frontoparietal and dorsal attention networks. These patterns were distinct from representations of experimental phasic pain. This study identified a brain biomarker for sustained pain with high potential for clinical translation.
Pain is a major clinical and social problem. In the United States, one in five adults (20.4%) currently suffers from clinical pain1, with an annual economic cost of hundreds of billions of dollars2. One important characteristic of clinical pain is its sustained nature3, which may involve brain regions related to top-down cognitive and affective coping responses in addition to sensory-discriminative processes. However, it remains difficult to objectively assess sustained pain in patients because clinical pain is usually affected by multiple factors, such as learning and appraisal4, mood and emotions5,6 and attention and self-referential processes7,8.
Tonic experimental pain, which has long been used as an experimental model of clinical pain9, shares similar characteristics with clinical pain. Both tonic and clinical pain unfold over protracted time scales, are more unpleasant than experimental phasic pain (EPP)10,11 and are more likely to elicit spontaneous coping responses12,13. EPP, in contrast, lasts for a short time and is known to be qualitatively and neurobiologically distinct from clinical pain14,15 and tonic pain12,16,17. These raise the possibility that tonic pain might be neurobiologically closer to ongoing clinical pain. However, to our knowledge, no previous human neuroimaging studies have directly examined how the neural representations are similar or distinct among tonic experimental pain, phasic experimental pain and clinical pain.
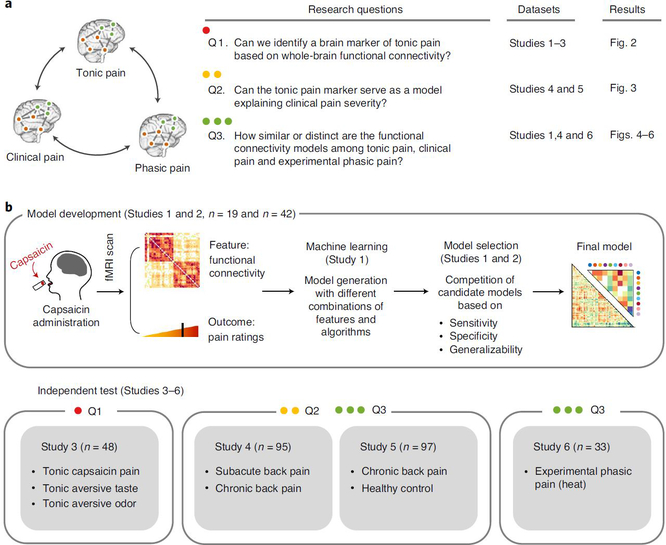
In this study, we addressed this question by identifying a neuroimaging-based signature for tonic pain and comparing it with clinical pain and EPP. More specifically, we addressed the following three research questions (Fig. 1a): 1) Can we identify a functional magnetic resonance imaging (fMRI)-based signature for experimental tonic pain based on whole-brain functional connectivity? 2) Can this tonic pain signature explain individual differences in clinical pain? 3) How similar or distinct are the functional connectivity models in capturing experimental tonic pain, clinical pain and EPP?
Fig. 1 |. Overview of research questions and main analyses.
a, This study aims to answer the three research questions (Q1–3) using six independent datasets and the predictive modeling approach. b, Overview of the experiment and data analyses to answer the research questions. We acquired fMRI data while participants experienced tonic orofacial pain and generated many candidate models predictive of pain ratings based on the functional connectivity patterns during tonic pain experience (Study 1). The final model was selected through a model competition using a set of predefined criteria across training and validation datasets (Studies 1 and 2). We further validated the final model on prospective independent datasets (Studies 3–6). Different studies were used for answering different main research questions (for example, Study 3 for Q1, Studies 4 and 5 for Q2 and Study 6 for Q3).
To answer these questions, we collected three fMRI datasets (Studies 1–3, n = 109) while participants were experiencing tonic pain. To induce tonic pain, we applied capsaicin-rich hot sauce on participants’ tongues using a filter paper before fMRI scanning. We also tested other non-painful aversive stimuli in separate scanning runs. We used these data to develop a machine learning model predictive of ongoing pain ratings based on whole-brain functional connectivity patterns. The Tonic Pain Signature (ToPS) was highly predictive of dynamic changes in pain ratings across three independent datasets (within-individual prediction r = 0.47–0.64). In addition, the ToPS correctly discriminated tonic pain from other non-painful aversive conditions, including bitter taste and aversive odor (76–85% accuracy), providing evidence for its specificity. We then tested the ToPS on two clinical back pain datasets (Studies 4 and 5, n = 192). The ToPS predicted overall pain severity in two different clinical pain conditions—that is, subacute back pain (SBP) and chronic back pain (CBP) (r = 0.56–0.57 depending on the task types)—and accurately discriminated patients with CBP from healthy controls (71–73% accuracy). When we compared predictive brain connectivity patterns across tonic, clinical and phasic pain (Study 6, n = 33), tonic experimental and clinical pain models were similar, particularly in somatomotor, frontoparietal and dorsal attention networks. These patterns were distinct from EPP. Overall, this study revealed a unique functional brain architecture for sustained, ongoing pain and provides a brain-based biomarker predictive of tonic pain intensity. This biomarker has the potential to be used in clinical settings to characterize pain experience-related brain activity in patients and treatment response.
Results
Developing a functional connectivity signature for tonic pain.
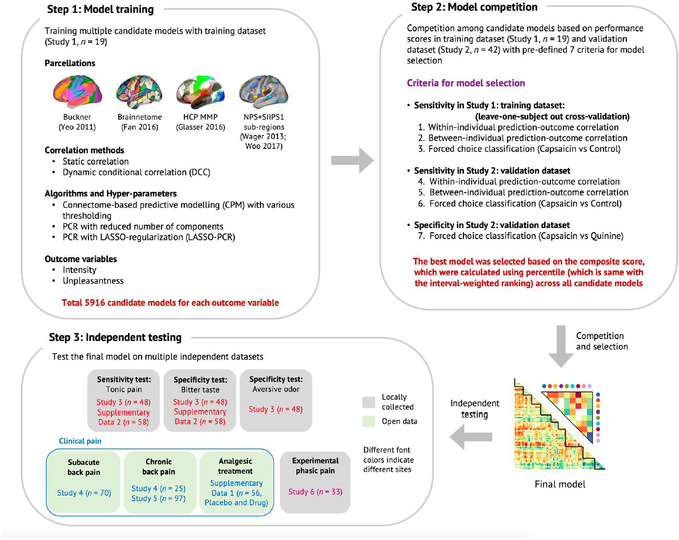
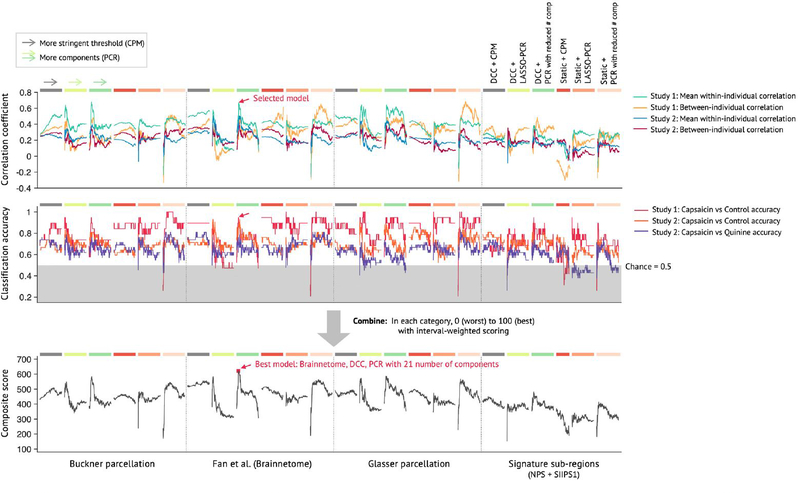
Using Study 1 as a training dataset (n = 19), we modeled the relationship between functional connectivity and pain ratings across the ‘capsaicin’ and ‘control’ conditions across all participants (Q1 in Fig. 1a; for its behavioral and physiological results, see Extended Data Fig. 1 and Supplementary Results). We trained multiple candidate models (a total of 5,916 models for each of pain intensity and unpleasantness) using combinations of input features and algorithms (see Extended Data Fig. 2 for details of modeling). Then, we evaluated these models using cross-validation (Study 1) and prospective validation (Study 2, n = 42; see Supplementary Fig. 1a for the behavioral results of Study 2). We selected the best models for pain intensity and pain unpleasantness based on a composite score across multiple objectives, including sensitivity in predicting pain ratings, specificity to pain versus aversive taste and generalizability in the validation dataset18 (see Extended Data Figs. 2 and 3 for the details of evaluation criteria and the results).
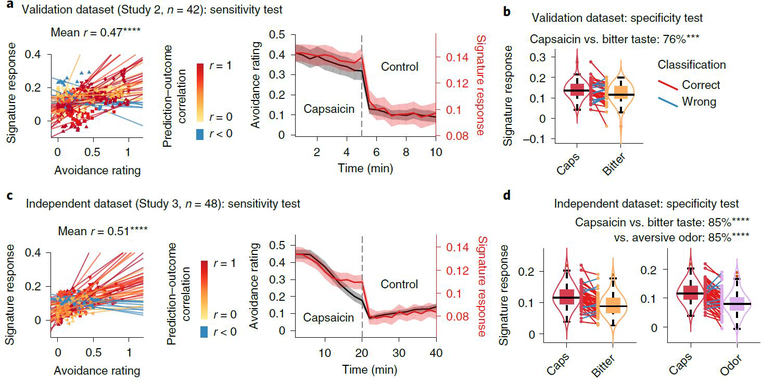
The best-performing intensity and unpleasantness models both used dynamic conditional correlation (DCC)19 with a modified 279-region version of the Brainnetome parcellation20 that included additional midbrain, brainstem and cerebellar regions (Methods). The selected modeling algorithm was principal component regression (PCR)21 with a reduced number of principal components (PCs) (21 components for the pain intensity model and 26 for the pain unpleasantness model; Supplementary Fig. 2). Because the performance of the pain intensity model was slightly better than the pain unpleasantness model (Supplementary Tables 1 and 2), we focused on the pain intensity model in the following analyses. We named this final model the ToPS; naming a model allows the same model (with fixed parameters) to be referred to and validated across studies22,23. In the validation dataset (Study 2), the ToPS model predicted within-individual variation in avoidance ratings for tonic pain stimuli with the mean correlation between actual and predicted ratings of r = 0.47, P = 3.24 × 10⁻¹⁰, bootstrap test (Fig. 2a), and also discriminated the capsaicin condition from the bitter taste condition with 76% classification accuracy, P = 0.0009, binomial test (Fig. 2b).
Fig. 2 |. Sensitivity and specificity test results.
We show the sensitivity and specificity of the ToPS on the validation dataset (Study 2, n = 42) and on an independent dataset (Study 3, n = 48). Note that the results based on the validation dataset in a and b are somewhat biased because the hyperparameters were optimized using this dataset, whereas the results in c and d are unbiased given that this dataset was held out for testing until the model was developed. To obtain rating scores on a same scale across different stimulus modalities, we used an avoidance rating scale (question: ‘How much do you want to avoid this experience in the future?’). a, Left: actual versus predicted ratings (that is, signature response) are shown in the plot. Signature response was calculated using the dot product of the model with the data and using an arbitrary unit. Each colored line (or symbol) represents individual participant’s data for across the capsaicin and control runs (red, higher r; yellow, lower r; blue, r < 0). P = 3.24 × 10⁻¹⁰, two-tailed, bootstrap test, n = 42. Right: mean avoidance rating (black) and signature response (red) across the capsaicin and control runs. Shading represents within-subject s.e.m. The capsaicin run is shown before the control run for the display purpose, regardless of the actual order of the two runs. Note that the left and right plots were based on averaging within five and ten time bins, respectively. b, We conducted a forced two-choice test to classify the mean signature response during the capsaicin run versus the bitter taste (quinine) run. We used the violin and box plots to show the distributions of the signature response. The box was bounded by the first and third quartiles, and the whiskers stretched to the greatest and lowest values within median ±1.5 interquartile range. The data points outside of the whiskers were marked as outliers. Each colored line between dots represents each individual participant’s paired data (red line, correct classification; blue line, incorrect classification). P = 0.0009, two-tailed, binomial test, n = 42. c, Left: actual versus predicted ratings. P = 3.20 × 10⁻¹⁴, two-tailed, bootstrap test, n = 48. Right: mean avoidance rating (black) and signature response (red) across the capsaicin and control runs. Shading represents within-subject s.e.m. d, A forced two-choice test results with two different test conditions, bitter taste and aversive odor conditions. P = 6.24 × 10⁻⁷ for both tests, two-tailed, binomial tests, n = 48. ***P < 0.001 and ****P < 0.0001, two tailed.
Predictive performance of the ToPS.
To obtain an unbiased estimate of the predictive performance of the ToPS, we tested the model on an additional independent test dataset (Study 3, n = 48), which was based on a similar experimental design as Studies 1 and 2, but was conducted at a different site on a different study population (in South Korea) and had a longer scan duration (20 min) than Studies 1 and 2 (see Supplementary Fig. 1b for the behavioral results of Study 3).
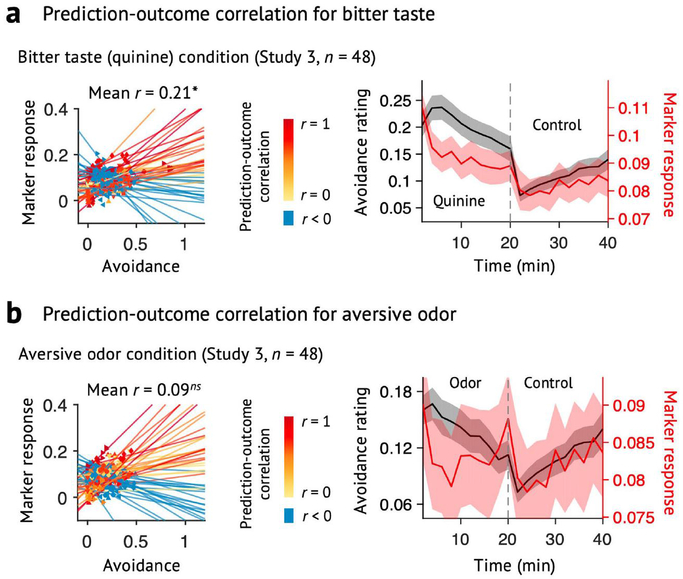
The ToPS showed good performance in tracking within-individual variation in avoidance ratings for tonic pain stimuli (correlations between time-binned actual and predicted ratings (five bins per run): mean r = 0.51 and P = 3.20 × 10⁻¹⁴ across the capsaicin and control runs; mean r = 0.38 and P = 6.51 × 10⁻⁶ within the capsaicin run; bootstrap tests) (Fig. 2c and Supplementary Fig. 3). The ToPS discriminated the capsaicin condition both from the bitter taste and aversive odor conditions with high accuracy (85% and P = 6.24 × 10⁻⁷ for both contrasts; binomial tests; Fig. 2d), and its prediction performance for bitter taste and aversive odor ratings was significantly worse than the prediction for the tonic pain ratings (t47 = 3.85–4.88, all P < 0.001, paired t-test; Extended Data Fig. 4), suggesting specificity of the ToPS to tonic pain compared to non-painful, tonic aversive experiences.
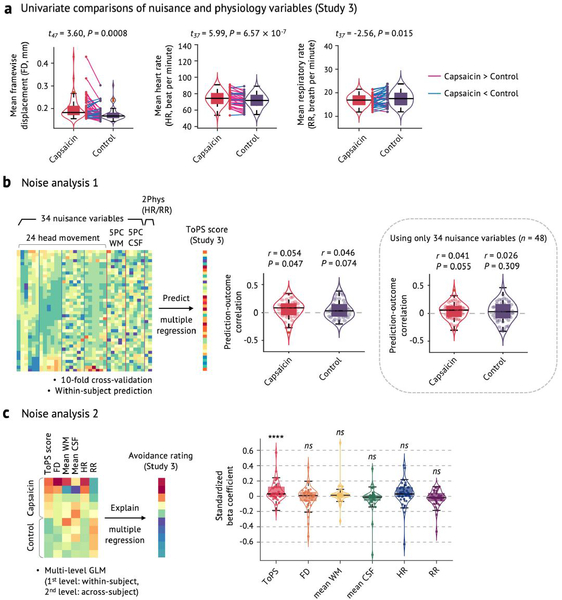
In addition to predicting within-individual variation, ToPS responses also predicted individual differences in average pain ratings (r = 0.51 and P = 8.23 × 10⁻⁸ when using both capsaicin and control runs; r = 0.40 and P = 0.004 when using the capsaicin run only; bootstrap tests) and accurately discriminated the capsaicin condition from the control condition in the forced-choice test (88% accuracy, P = 1.01 × 10⁻⁷, binomial test). Supplementary Table 1 summarizes the test results across three independent tonic pain studies (Studies 1–3). Furthermore, the prediction performance was not driven by movement or physiological noise and generalized to different preprocessing pipelines (Extended Data Fig. 5 and Supplementary Results).
The ToPS predicts clinical back pain.
To determine whether the ToPS can explain individual differences in clinical pain (Q2 in Fig. 1a), we tested the ToPS on a publicly available clinical pain dataset (Study 4, n = 95) obtained from the OpenPain Project (http://www.openpain.org/). This dataset is from a longitudinal fMRI study of clinical back pain including patients with SBP (n = 70) and CBP (n = 25)5,24,25. Both clinical conditions are characterized by the presence of sustained back pain. This dataset had two types of experimental tasks: one was a ‘spontaneous pain rating’ task, in which the participants were asked to report their spontaneous pain continuously during scanning; the other was the ‘resting state’ task, in which the participants rested without performing any other task. We evaluated how well the ToPS explained individual differences in overall pain severity, averaged over multiple sessions (2–5 visits depending on individual patients, during a 1–3-year follow-up period). We tested the ToPS on both pain conditions (SBP and CBP) and task types (that is, ‘spontaneous pain rating’ and ‘resting state’ conditions). In this analysis, we included the patients who had data from both task types (testing n = 53 and n = 20 for SBP and CBP patients, respectively).
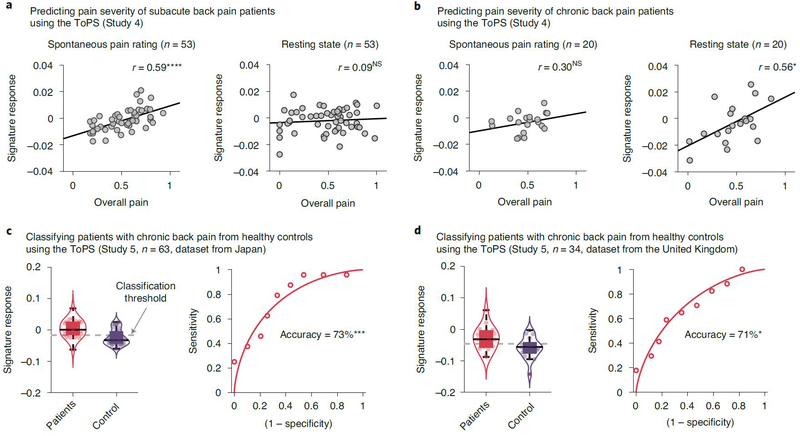
The ToPS response predicted individual differences in the overall pain severity of patients with clinical pain but in a task-dependent fashion (Supplementary Table 3). For the patients with SBP (Fig. 3a), the ToPS model showed significant prediction only for the spontaneous pain rating data (r = 0.59 and P = 3.91 × 10⁻⁶), not for the resting state data (r = 0.09 and P = 0.528). In contrast, for the patients with CBP (Fig. 3b), the model showed significant prediction for the resting state data (r = 0.56, P = 0.011) and non-significant but medium effect size prediction for the spontaneous pain rating data (r = 0.30 and P = 0.197). For the patients with CBP, differences in the correlation coefficients between the task types were not significant (z = 0.93 and P = 0.353), indicating that the task-dependent difference in prediction was minimal in patients with CBP. These task-dependent results suggest that, for the patients with SBP, paying attention to their ongoing pain experience is needed to produce functional connectivity patterns similar to our tonic pain model, but, for the patients with CBP, even resting state can produce the functional connectivity patterns. Intriguingly, the ToPS performed better in predicting clinical back pain severity than the models trained on the clinical pain datasets themselves (Supplementary Results and Extended Data Fig. 6). Note that caution is needed in interpreting the results for CBP given the small sample size.
Fig. 3 |. Testing the ToPS on the clinical pain data.
a, b, We tested the ToPS on a publicly available clinical pain dataset5,24–26 (Study 4) to evaluate how much the model can explain clinical pain severity of (a) patients with subacute back pain (SBP; n = 53) and (b) patients with chronic back pain (CBP; n = 20). The plots show the relationships between the actual pain scores (visual analog scale) versus signature response (arbitrary unit). Each dot represents an individual participant, and the line represents the regression line. The exact P values and degrees of freedom (d.f.) were (a) P = 3.91 × 10⁻⁶ (left) and 0.528 (right), d.f. = 51; (b) P = 0.197 (left) and 0.011 (right), d.f. = 18; two-tailed, one-sample t-test. c, d, We further tested the ToPS on two publicly available datasets26 to evaluate how well the model can classify the patients with CBP from healthy control participants. One dataset (c) was obtained from Japan (n = 63), which included 24 patients and 39 healthy participants. The other dataset (d) was obtained from the United Kingdom (n = 34), which included 17 patients and 17 healthy participants. The exact P values were P = 0.0003 for c and P = 0.024 for d, two-tailed, binomial tests. *P < 0.05, ***P < 0.001 and ****P < 0.0001. NS, not significant.
We further tested the ToPS on two more CBP datasets (Study 5, n = 63 and n = 34 from Japan and the United Kingdom, respectively; also available at http://openpain.org) (Fig. 3c,d). In a previous study26, these datasets were used to develop a diagnostic classifier that discriminated patients with CBP from healthy controls. In the current study, we also tested the ToPS as a classifier of patients with CBP versus controls. The ToPS discriminated the patients with CBP (n = 24 and n = 17 for the Japan and United Kingdom datasets, respectively) from the matched healthy controls (n = 39 and n = 17, respectively) with high accuracy. For the Japanese sample, the classification accuracy with an optimal threshold was 73% (P = 0.0003, binomial test), with 79% sensitivity, 69% specificity and area under the curve (AUC) = 0.79; for the United Kingdom dataset, maximum accuracy with the optimal threshold was 71% (P = 0.024, binomial test), with 65% sensitivity, 76% specificity and AUC = 0.74.
Overall, the ToPS model 1) predicted variation in tonic pain over time within individuals; 2) was specific to tonic pain compared to other conditions tested; 3) predicted individual differences in clinical pain severity ratings; and 4) was higher in patients than matched controls. These results suggest that experimental tonic pain produces similar patterns of brain connectivity to clinical pain.
Network-level characterization of the ToPS.
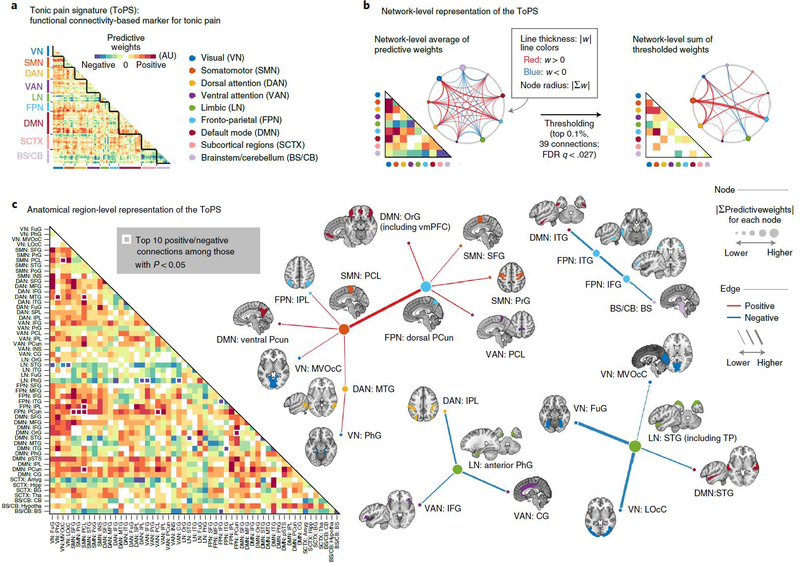
To understand how and why the ToPS model works and to examine its neurobiological validity, it is crucial to investigate which brain connectivity changes were the main drivers of the ToPS prediction performance. To help interpret the model, we used nine large-scale functional brain networks27 to visualize the model predictive weights (Fig. 4 and Supplementary Fig. 4). We conducted bootstrap tests to identify the connectivity features that most reliably contribute to the prediction. Then we selected the top 0.1% (39 connections, P < 0.000028, false discovery rate (FDR)-corrected q < 0.027; Supplementary Table 4) for visualization and interpretation.
Fig. 4 |. ToPS: a functional connectivity marker for tonic pain.
a, The raw predictive weights of the model. We sorted the brain regions according to their functional network membership. b, Left: we averaged the ToPS predictive weights for each network and displayed them with a lower triangular matrix and a circular plot. Right: we summed the top 0.1% thresholded weights based on bootstrap test with 10,000 iterations (P < 0.000028, FDR-corrected q < 0.027, two tailed) at the network level. c, We grouped the parcels into gross anatomical regions within each functional network and averaged the predictive weights within each anatomical region. The top ten positive and negative connections and the corresponding brain regions that survived at a threshold of uncorrected P < 0.05 with bootstrap tests (two tailed, white boxes on the left panel) were shown with force-directed graph layout. AU: arbitrary unit; Amyg, amygdala; BS, brainstem; BG, basal ganglia; CB, cerebellum; CG, cingulate gyrus; FuG, fusiform gyrus; Hipp, hippocampus; Hypotha, hypothalamus; IFG, inferior frontal gyrus; INS, insular gyrus; IPL, inferior parietal lobule; ITG, inferior temporal gyrus; LOcC, lateral occipital cortex; MFG, middle frontal gyrus; MTG, middle temporal gyrus; MVOcC, medioventral occipital cortex; OrG, orbital gyrus; PCL, paracentral lobule; PCun, precuneus; PhG, parahippocampal gyrus; PoG, postcentral gyrus; PrG, precentral gyrus; pSTS, posterior superior temporal sulcus; SFG, superior frontal gyrus; SPL, superior parietal lobule; STG, superior temporal gyrus; Tha, thalamus.
As shown in Fig. 4b, the most reliable positive weights (that is, higher pain with increasing connectivity) were found in the connections among the somatomotor network (SMN), the frontoparietal network (FPN), the visual network (VN) and the dorsal attention network (DAN), which seems to suggest the importance of multisensory integration28 and top-down attention processes29,30 in tonic pain. The most reliable negative weights (that is, lower pain with increasing connectivity) were found in the limbic and paralimbic cortical regions (limbic network (LN)) and brainstem (BS) regions, suggesting the importance of context processing31,32 and the involvement of descending pain modulation33,34 in reducing tonic pain intensity. Similar results were found when we grouped the parcels into gross anatomical brain regions and examined the top ten positive and bottom ten negative features (Fig. 4c). For example, the connections between the paracentral lobule (in the SMN) and the dorsal part of precuneus (in the FPN) had strong positive weights, whereas the connections with the LN, such as the parahippocampal gyrus near amygdala and the superior temporal gyrus including medial temporal pole had strong negative weights. For more detailed information about the node-level connectivity patterns, see Extended Data Fig. 7. Additional network-level characterization of raw functional connectivity data and the pain unpleasantness model are displayed in Supplementary Figs. 5 and 6, respectively.
Regions of interest analysis within the ToPS.
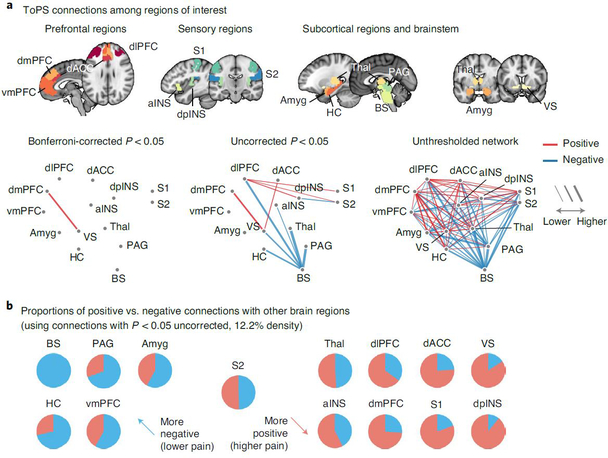
We further examined the patterns of predictive weights across some selected regions of interest (ROIs) that are commonly studied and received attention in the context of the pain neuroimaging studies35–37. The ROIs include pain processing and modulatory brain regions (Fig. 5a). Because the ToPS was developed based on whole-brain functional connectivity, this analysis allows us to better understand the relative contributions of the ROIs while controlling for other regions and connections.
Fig. 5 |. ToPS connections among ROis.
a, We examined the ToPS predictive weights among the ROIs that have been often studied in the field of pain neuroimaging, including prefrontal (vmPFC, dmPFC, dlPFC and dACC), sensory (S1, S2, aINS and dpINS), subcortical (thalamus, ventral striatum, amygdala and hippocampus) and brainstem (PAG and brainstem) regions. We displayed these connections with three different levels of threshold. Left: Bonferroni correction P < 0.05; middle: uncorrected P < 0.05; right: no threshold. P values were obtained from bootstrap tests with 10,000 iterations (two tailed). b, For each pain-related brain region, we show proportions of positive versus negative connections with other brain regions with pie charts (red. positive; blue, negative). We used only the connections that survived at a threshold of uncorrected P < 0.05 (bootstrap tests, two tailed) for calculating proportions. Brain regions with a higher proportion of negative connections are shown on the left side (meaning lower pain with increasing connectivity), and those with a higher proportion of positive connections are shown on the right side (meaning higher pain with increasing connectivity).
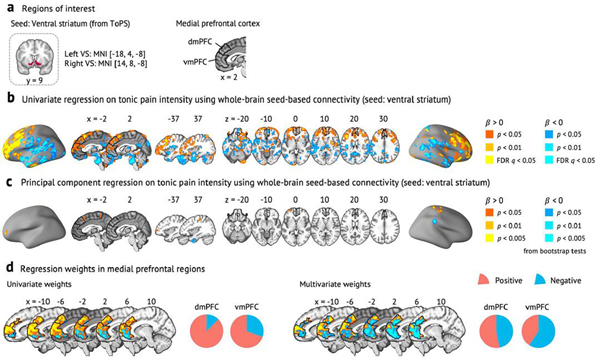
With a Bonferroni-corrected threshold P < 0.05, the connection between the dorsomedial prefrontal cortex (dmPFC) and ventral striatum survived, and its predictive weight was positive. A supplementary seed-based connectivity analysis using the ventral striatum as a seed region also showed a similar pattern of results—that is, positive pain-predictive weights in the dmPFC (Extended Data Fig. 8 and Supplementary Results). At a more liberal threshold (uncorrected P < 0.05), dorsolateral prefrontal cortex (dlPFC) connectivity with classical pain processing regions predicted increased pain, including primary/secondary somatosensory cortices (S1/S2) and dorsal posterior insula (dpINS), whereas connectivity with the brainstem predicted lower pain, suggesting that the dlPFC might play a dual role in processing tonic pain38–40. With this threshold, most of the negative weight connections came from the brainstem, and the regions that are connected to the brainstem included key brain regions for descending pain modulation33,34, such as the periaqueductal gray (PAG). When we calculated the proportions of positive versus negative weight connections with the rest of the brain with this threshold (Fig. 5b), the brainstem, hippocampus, PAG, ventromedial prefrontal cortex (vmPFC) and amygdala had more negative connectivity weights than positive ones. Conversely, the dpINS, ventral striatum, S1, dorsal anterior cingulate cortex (dACC), dmPFC, dlPFC and anterior insula (aINS) had more positive than negative connectivity weights. This pattern reveals potential brain regions for facilitatory and inhibitory roles in tonic pain, respectively.
Comparing the ToPS with the predictive models of clinical pain and EPP.
To examine how similar or distinct the functional connectivity models are among tonic pain, clinical pain and EPP (Q3 in Fig. 1a), we compared the ToPS model with the SBP model, which was trained using the SBP dataset (Study 5, n = 70; Extended Data Fig. 6a), and with the EPP model, which was trained using an experimental heat pain dataset (Study 6, n = 33, 12.5-s heat stimulation)41,42. We trained the EPP model using the same modeling options used in the tonic pain and SBP models, and it showed good cross-validated prediction performance (mean within-individual r = 0.63, P = 1.53 × 10⁻¹⁹, bootstrap test). Here, the CBP model was not used for comparison, because the model showed poor cross-validated performance.
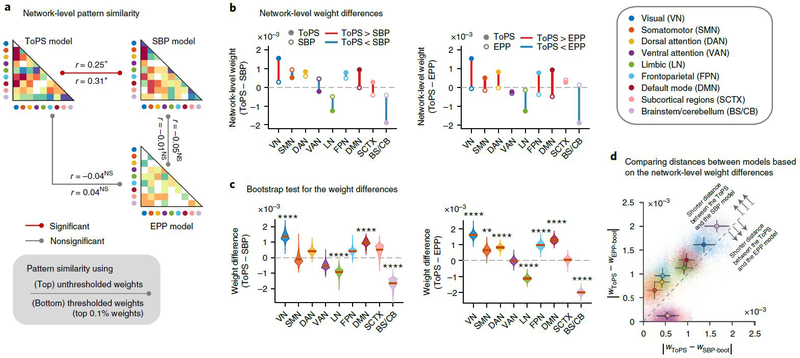
When we calculated the pattern similarity among the network-level averages of different pain models (Fig. 6a), the ToPS appeared to be more similar to the SBP model than the EPP model: rToPS-SBP= 0.25, P = 0.095 and rToPS-EPP = −0.04, P = 0.795. This result also held after thresholding to retain the top 0.1% of predictive weights (Supplementary Fig. 7): rToPS-SBP = 0.31, P = 0.036 and rToPS-EPP = 0.04, P = 0.817. The pattern similarity between the SBP model and the EPP model was low, rSBP-EPP = −0.05, P = 0.747, and with thresholding, rSBP-EPP = −0.01, P = 0.940. The prediction performances of the SBP and EPP models on the tonic pain data also provided a similar conclusion: the SBP model predicted tonic pain better than the EPP model (SBP model, mean r = 0.35 and P = 1.20 × 10⁻⁶; EPP model: mean r = 0.19 and P = 0.008), although both models showed worse performance than the ToPS.
Fig. 6 |. Comparing the ToPS with the SBP and ePP models.
The predictive weights of the ToPS were compared to functional connectivity-based models of SBP and EPP. a, Pattern similarity among three different pain models, calculated by taking Pearson’s correlation between the network-level average of unthresholded (UT; statistics above the line) or thresholded (T; statistics below the line) predictive weights. For thresholding, the top 0.1% stable connections based on bootstrap tests were selected. The exact P values between ToPS and SBP were P = 0.095 (UT) and 0.036 (T); between ToPS and EPP, P = 0.795 (UT) and 0.817 (T); between SBP and EPP, P = 0.747 (UT) and 0.940 (T), two-tailed, one-sample t-test, d.f. = 43. b, Network-level differences of predictive weights between different pain models; the closed circles indicate the mean network-level weights of the ToPS, and the open circles are for the SBP model (left) or the EPP model (right). Color represents different functional networks. c, Bootstrap test results (10,000 iterations) of the network-level weight differences between the ToPS versus SBP model (left) or EPP model (right). The exact P values for ToPS-SBP were (from left to right): 1.95 × 10⁻⁸ (VN), 0.728 (SMN), 0.021 (DAN), 0.009 (VAN), 1.05 × 10⁻⁵ (LN), 0.019 (FPN), 6.04 × 10⁻⁸ (DMN), 0.084 (SCTX) and 4.91 × 10⁻⁹ (BS/CB). For ToPS-EPP, P = 1.66 × 10⁻²² (VN), 0.0005 (SMN), 3.72 × 10⁻¹² (DAN), 0.904 (VAN), 2.77 × 10⁻¹⁷ (LN), 6.28 × 10⁻⁹ (FPN), 1.72 × 10⁻¹⁹ (DMN), 0.709 (SCTX) and 3.66 × 10−53 (BS/CB), two-tailed, bootstrap tests. d, Comparison of the network-level distance (absolute difference) between pain models. Each colored dot indicates the absolute network-level weight difference between the ToPS (wToPS) and bootstrapped SBP models (wSBP-boot; x axis) and bootstrapped EPP model (wEPP-boot; y axis). The error bars from the center dots represent the s.d. from the mean of the sampling distribution with bootstrap tests. The dashed line indicates y = x (that is, same distance from the ToPS). Seven of the nine functional networks were located above the dashed line, which indicates that the weight distance between the ToPS and the SBP model was shorter than the weight distance between the ToPS and the EPP model for these networks. +P < 0.05, one tailed; *P < 0.05, **P < 0.01, and ****P < 0.0001, two tailed. NS, not significant (for the significance in c, Bonferroni correction was used).
Lastly, to examine which connections showed similar predictive weights between the ToPS and other models, we compared the magnitude of network-level weight averages using bootstrap tests (with 10,000 iterations; Fig. 6b,c). The results further provided a similar conclusion that the differences in network-level weight magnitude between the ToPS and the SBP model were smaller than the differences between the ToPS and the EPP model in seven of the nine networks (Fig. 6d). In particular, the SMN, DAN and FPN showed significant differences for the ToPS versus the EPP model—SMN: z = 3.49 and P = 0.0005; DAN: z = 6.95 and P < 0.0001; and FPN: z = 5.81 and P < 0.0001—whereas these networks showed much smaller differences for the ToPS versus the SBP model—SMN: z = −0.35 and P = 0.728; DAN, z = 2.31 and P = 0.021; and FPN, z = 2.35 and P = 0.019. The differences in the SMN, DAN and FPN between the ToPS/SBP models versus the EPP model suggest that multi-functional brain systems involved in ‘top-down’ prediction and regulation of attention and cognition are important for understanding sustained pain, and that tonic and clinical pain share common connectivity patterns within these networks.
Discussion
In this study, we developed a predictive model for tonic pain based on the whole-brain functional connectivity. The ToPS was sensitive to within-individual variation in tonic pain intensity over time, whereas it did not respond to other tonic non-painful aversive stimuli. The ToPS also predicted inter-individual differences in pain severity of patients with clinical back pain, and its prediction accuracy was higher than models trained on the clinical pain datasets themselves. Direct comparisons among predictive models for different kinds of pain provided evidence that clinical pain shares common brain representations with experimental tonic pain. These commonalities appear to be substantial enough that the ToPS can predict clinical pain severity. Therefore, this study provides a promising neuroimaging biomarker for tonic pain with potential for clinical translation43.
The ToPS showed good generalizability across multiple fMRI datasets. Particularly, we used three independent datasets (Studies 1–3) for training, validation and independent testing of the model, respectively. These datasets were heterogeneous in terms of acquisition sites, scanners, participant ethnicity and the details of the experimental design. This heterogeneity of the samples might reduce predictive accuracy during training and validation, but it helps develop a model with better robustness and generalizability18. To fully exploit this feature, we conducted a broad exploration by developing thousands of candidate models from the training data and selected the optimal hyperparameters using a model competition based on the validation dataset (Extended Data Fig. 2). This two-step model development framework allows us to find a robust and generalizable predictive model without appreciable overfitting.
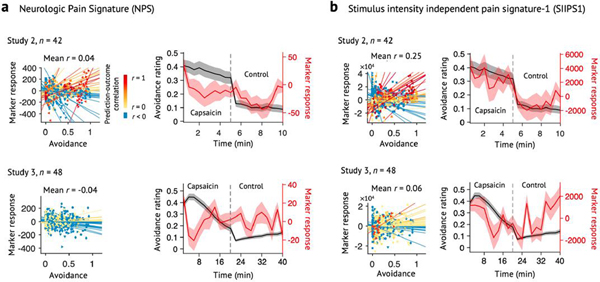
A few studies developed generalizable signatures for pain using multiple datasets with prospective testing41,44, but most were designed to predict experimentally induced phasic heat pain, which is qualitatively different from tonic and clinical pain10. We showed that a functional connectivity model for EPP could not explain tonic pain experience, and its pattern of predictive weights was different from the tonic and clinical pain models. When we additionally tested a priori predictive models for EPP on Studies 2 and 3 datasets, including the Neurologic Pain Signature (NPS)41 and Stimulus Intensity Independent Pain Signature-1 (SIIPS1)44, both models showed poor performance (Extended Data Fig. 9), indicating that the ToPS captures unique features of brain representations for pain that could not be captured by EPP models.
Our tonic pain model provides evidence that tonic pain experience involves a highly distributed, global neural process45. For example, most of the connections that survived thresholding (top 0.1%) were between-network connections (35 of 39 connections), suggesting that the interactions among different functional networks are crucial to the tonic pain experience. Particularly, we found that the connections between the SMN and FPN networks were among the most important predictors of tonic pain. Compared to the SMN, which includes many well-known classical pain-processing regions, the FPN’s role in tonic pain is less well understood46. It could reflect the heightened consciousness induced by tonic pain as suggested in the global workspace theory47, and recent neuroimaging studies have also suggested its role in attention- or expectancy-based pain modulation29,30,48. Supplementary analyses using an additional clinical pain dataset49 (Supplementary Data 1, n = 56; also available at http://openpain.org) suggest that our tonic pain model can predict the future placebo-induced analgesic responses largely based on the FPN connections in our model (r = 0.67 in the placebo-responder group, n = 18; for details, see Supplementary Fig. 8 and Supplementary Results). Furthermore, a recent study demonstrated that the spontaneous coping behaviors become more important for sustained pain12. Taken together, these results suggest that the FPN may play a crucial role in attentional or contextual modulation of pain-related signal in our tonic pain model29, although this hypothesis needs to be tested more thoroughly in the future.
The examination of the ToPS weights among several selected ROIs36 revealed that the ToPS weight patterns were largely consistent with previous literature24,31,34,36,38,41,44,50–55, but the model also identified some connections that have not been well documented in pain literature, such as the positive weight between the dmPFC and the ventral striatum. Previous studies mainly focused on the functional roles of the vmPFC–ventral striatum connectivity in pain perception, modulation, prediction error and transition to chronic pain24,42,56,57. Thus, an interesting future direction would be to examine the different functional roles of the dmPFC–versus vmPFC–ventral striatum connections in tonic pain processing and modulation (for more discussion, see Supplementary Results).
Notably, this study provides evidence that a neuroimaging-based marker for experimental tonic pain has the potential to diagnose and evaluate clinical pain conditions. It has been an unresolved question as to what degree experimentally evoked pain models apply to clinical pain and how much the brain representations of experimental and clinical pain overlap15,58. In this study, we found that our tonic pain model could predict clinical back pain severity and classify patients with chronic pain from healthy controls with reasonable levels of accuracy, and the patterns of the tonic pain model weights shared some features with a clinical back pain model. Furthermore, our findings provide supporting evidence that tonic pain is a better approximation to chronic pain than EPP13. Note that we used orofacial pain, which is emotionally more draining than other body pain59, and, more specifically, intraoral taste stimuli are known to activate the visceral defense system for the body’s internal milieu60. Therefore, our results may suggest that taste-induced orofacial tonic pain can be a good target for translational research on clinical pain.
It was quite counterintuitive that our tonic pain model was able to predict clinical pain scores better than a model trained on the data from patients with clinical back pain. Although there could be multiple explanations for this, one main reason could be that clinical data tend to be more heterogeneous and noisier than experimental data collected from healthy participants. For example, chronic pain is highly heterogeneous even within the same disease category and co-occurs with multiple psychiatric conditions, such as depression. Moreover, chronic pain experience is spontaneous by nature, and the uncontrolled characteristics of spontaneous pain could lower the statistical power and increase the possibility of confounds. This heterogeneous and noisy nature of clinical pain data could make model training vulnerable to confounds and overfitting if a large amount of data are unavailable. Therefore, data from tens of patients might not be enough to capture generalizable brain representations of clinical pain.
Our tonic pain model, in contrast, capitalized on data from a well-specified experimental procedure that produced a similar temporal profile of pain experience across participants. It also used data from healthy volunteers free of co-occurring conditions and medications. Models predicting within-person variation, where each participant ‘serves as their own control’, can further reduce confounds and noise due to individual differences in brain vasculature and morphometry. Therefore, experimental pain data from healthy participants could be well suited to capture generalizable brain representations of sustained pain. Although the tonic pain model is biased in the sense that it does not capture all features of chronic pain, biased models often generalize well to new data because of robustness to sampling variance21. However, further investigation will be needed to fully understand why the tonic pain model worked well for clinical back pain data. In addition, the predictive performance of the ToPS for clinical back pain was dependent on the type of task patients performed. Although we speculate that the different task types might better reflect the different clinical pain conditions—for example, whether the attention to pain is required for the brain representations of ongoing pain to fully emerge—this needs further investigation.
There are some caveats in the current study, which are addressed and discussed in further detail in the Supplementary Results, including additional test results on Supplementary Data 2 (n = 58). We also included an in-depth discussion on the potential clinical scenarios and challenges for the ToPS in Supplementary Results.
Overall, we developed a functional connectivity-based signature for tonic pain with potential for clinical translation. Although further validation and independent tests on data from different populations and different laboratories will be required to provide more definitive evidence for the robustness and generalizability of the ToPS, our results on generalizability across eight unique study cohorts (including two Supplementary Datasets) provide a meaningful step toward a neuroimaging pain biomarker that can quantitatively assess sustained pain and serve as a target for interventions.
Online content
Any methods, additional references, Nature Research reporting summaries, source data, extended data, supplementary information, acknowledgements, peer review information; details of author contributions and competing interests; and statements of data and code availability are available at https://doi.org/10.1038/s41591-020-1142-7.
Methods
Overview.
This study included eight independent fMRI studies (total n = 448) to develop, validate and prospectively test a functional connectivity-based predictive model of tonic pain. Sample sizes ranged from n = 19 to n = 97 per study. Studies 1–3, 6 and Supplementary Data 2 were locally collected datasets; Studies 4 and 5 and Supplementary Data 1 were publicly available (OpenPain Project; available at http://www.openpain.org/). Study 1 served as a ‘training dataset’ and was used for developing and evaluating multiple candidate models. Study 2 was a ‘validation dataset’ used only for the evaluation of the candidate models. Studies 3–6 and Supplementary Data 1 and 2 were ‘independent test datasets’ for testing and characterizing the final model in an unbiased way. These independent datasets provide strong tests of the model’s generalizability, as they were not used in model training and validation and differed from Studies 1 and 2 in study site, scanning parameters and participant ethnicity. Furthermore, considering that we applied a pre-trained model (as trained in Studies 1 and 2), these involved no multiple comparisons or model degrees of freedom in the test beyond those involved in calculating the correlation. Studies 1–3 (n = 109) and Supplementary Data 2 (n = 58) were from healthy participants with a capsaicin-induced tonic pain task. Studies 4 and 5 (n = 192) and Supplementary Data 1 (n = 56) were collected from patients with subacute and chronic pain. Study 6 (n = 33) was from healthy participants with a heat-induced phasic pain task. For details of methods for each study, see Supplementary Methods.
Brain parcellations.
Four types of brain parcellations were tested in this study (Extended Data Fig. 2). First, the Buckner group parcellation, which included cerebral cortex27, cerebellum61 and basal ganglia62, was combined with additional thalamic and brainstem regions from the SPM anatomy toolbox63. We divided the contiguous sub-regions within each network into separate regions, resulting in a total of 475 regions. Second, the Brainnetome atlas20, combined with additional cerebellum regions from a probabilistic atlas64 and brainstem regions63, resulted in a total of 279 regions. Third, the Human Connectome Project multi-modal parcellation (HCP-MMP)65, combined with additional subcortical regions from the Brainnetome atlas20, cerebellum regions64 and brainstem regions63, resulted in a total of 249 regions. For these three parcellations, we spatially averaged the blood oxygen level-dependent (BOLD) signal time-series within each region for further functional connectivity processing. Lastly, we also tested the contiguous sub-regions from the NPS41 and the SIIPS1 (ref. 44), resulting in a total of 59 regions. For the NPS and SIIPS1 sub-regions, we used pattern expression values for each region by calculating the dot product between the data and the regional predictive weight patterns. All the parcellations were used as volumetric atlas with re-sampling to 3×3×3-mm3 voxel size.
Functional connectivity processing.
We tested both static and dynamic functional connectivity features for the prediction (Extended Data Fig. 2). For static connectivity, we used Pearson’s correlation between pairs of the BOLD time series, which yielded one connectivity value per one pair of parcels. For dynamic connectivity, we used the DCC19, which was based on generalized autoregressive conditional heteroscedastic (GARCH) and exponential weighted moving average (EWMA) models (codes are available at https://github.com/canlab/Lindquist_Dynamic_Correlation). The DCC model has been shown to have better sensitivity and specificity in capturing dynamical changes in correlation as compared to the conventional sliding window dynamic correlation method66. For computational efficiency, we estimated parameters of the DCC model from the whole pairs of BOLD time series (using DCCsimple.m from the DCC toolbox) with the assumption that EWMA model parameters are consistent across whole connections. With these two different methods, we created two types of features for the prediction of between- and within-individual variations in pain: the first was the ‘overall’ functional connectivity for between-individual prediction; the second was the ‘binned’ functional connectivity for within-individual prediction. Details of functional connectivity analysis for different groups of datasets (capsaicin tonic pain datasets (Studies 1–3 and Supplementary Data 2), clinical pain datasets (Studies 4 and 5 and Supplementary Data 1) and heat-induced phasic pain datasets (Study 6)) can be found in Supplementary Methods.
Developing tonic pain models.
Using the training data (Study 1, n = 19), we generated many different candidate models based on different modeling options as described below. Overall, we created features using different parcellations (Option 1) and correlation methods (Option 2) and predicted intermittent pain ratings (intensity or unpleasantness ratings, Option 4) with different algorithms and hyperparameters (Option 3). We concatenated all participants’ data across the capsaicin and control runs, each of which has seven time bins. Therefore, the number of observations (rows) of the training data was 266 (7 bins × 2 runs × 19 participants). The number of features (the columns of the training data) varied depending on the modeling options. A total of 5,916 models per each outcome variable were generated; the graphical illustration of this model building process is provided in Fig. 1b and Extended Data Fig. 2.
Option 1: parcellations.
We used four different types of brain parcellation: 1) the Buckner atlas, 2) the Brainnetome atlas, 3) the HCP-MMP and 4) the NPS and SIIPS1 sub-regions.
Option 2: correlation methods.
We used two different types of correlation methods for calculating functional connectivity: 1) static correlation using Pearson’s correlation and 2) DCC.
Option 3: algorithms and hyperparameters.
We mainly used three different modeling approaches with multiple hyperparameters for model training. The first modeling method was the connectome-based predictive modeling (CPM)67 with multiple levels of thresholding on P values of correlations (a total of 250 logarithmically spaced thresholds from P = 0.000001 to P = 0.1). Some of the thresholds were excluded when there was no survived feature. The numbers of features varied depending on the datasets and other options. The second algorithm was the PCR21 with reduced numbers of PCs based on the amount of explained variance. The number of PCs ranged from 1 (using only PC1) to 251 (using PC1, PC2, … and PC251). The third algorithm was the PCR with least absolute shrinkage and selection operator (LASSO) regularization21. The number of PCs ranged from 1 to 251, each of which consisted of the PCs that survived from LASSO regularization with different weight of penalty parameter λ.
Option 4: outcome variables.
We used two different outcome variables: 1) pain intensity and 2) pain unpleasantness.
Calculating signature responses.
To test the performance of connectivity-based predictive models, we calculated signature response scores (the intensity of pattern expression) using a dot product of each vectorized functional connectivity data with model weights.
where n is the number of connections within the connectivity-based predictive models, w is the connection-level predictive weights and x is the test data.
Forced two-choice classification test for specificity tests.
For specificity tests, we used two-alternative forced choice tests, which compared two paired values of averaged signature responses for each individual. This approach does not need the assumption that all participants’ brain responses are on the same scale41. More specifically, we first calculated signature responses across time by obtaining the dot product of a signature model with time-varying connectivity matrices and averaged the time series of signature responses within each participant. Then, we compared the averaged signature responses of different experimental conditions within individual. For example, if the averaged signature response of the capsaicin condition was higher than that of the bitter taste (or aversive odor) condition within a participant, the model did a ‘correct’ classification for the participant. Classification accuracy was calculated with the probability of correct comparison across individuals.
Model competition.
To choose the best final model, we held a competition among the candidate models based on their prediction and classification performances across training and validation datasets. The seven a priori criteria included the performance scores related to model sensitivity in Study 1 (Criteria 1–3) and Study 2 (Criteria 4–6) and specificity in Study 2 (Criterion 7).
Criterion 1 (Sensitivity): within-individual prediction in Study 1.
The first criterion was the cross-validated performance in predicting within-individual variation in pain ratings in Study 1 (n = 19). We calculated Pearson’s correlation values between the actual pain ratings and the predicted ratings (that is, pain ratings and signature response values from 14 time bins: seven from the capsaicin run and seven from the control run) for each participant and then averaged the correlation values to obtain one value per model. We used leave-one-participant-out cross-validation to obtain unbiased (or less biased) test results.
Criterion 2 (Sensitivity): between-individual prediction in Study 1.
The second criterion examined the cross-validated performance in predicting between-individual variation in pain ratings in Study 1 (n = 19). We calculated Pearson’s correlation values between the averaged actual pain ratings and predicted ratings for each condition and across participants (that is, 1 overall rating or prediction per condition per person × 2 conditions (capsaicin and control) × 19 subjects = a total of 38 actual ratings and 38 predicted ratings). We used leave-one-participant-out cross-validation.
Criterion 3 (Sensitivity): classification of capsaicin versus control in Study 1.
The third criterion examined the cross-validated classification performance between the capsaicin versus control conditions using Study 1 data (n = 19). We used two-alternative forced choice classification, which compared two paired values (one for capsaicin and the other for control) for each individual. Similarly to Criteria 1 and 2, leave-one-participant-out cross-validation was used.
Criterion 4 (Sensitivity): within-individual prediction in Study 2.
The fourth criterion was the model performance in predicting within-individual variation in pain ratings using Study 2 data (validation dataset, n = 42). Analysis details were the same as Criterion 1 except that Study 2 had ten time bins for each run and that we did not use cross-validation because Study 2 was not included in the training of candidate models.
Criterion 5 (Sensitivity): between-individual prediction in Study 2.
The fifth criterion measured model performance in predicting between-individual variation in pain ratings in Study 2. Analysis details were the same as Criterion 2 except that we did not use cross-validation because Study 2 was not included in the training of candidate models.
Criterion 6 (Sensitivity): classification of capsaicin versus control in Study 2.
The sixth criterion examined the classification performance between the capsaicin versus control conditions using Study 2 data. Analysis details were the same as Criterion 3 except that we did not use cross-validation because Study 2 data were not included in the training of candidate models.
Criterion 7 (Specificity): classification of capsaicin versus quinine in Study 2.
The last criterion examined the model specificity with the model performance in discriminating the capsaicin (painful) condition from the quinine (non-painful, aversive) condition using Study 2 data. In the context of the current study, model specificity refers to whether the model responds only to the tonic pain condition and not to other confusable conditions, such as non-painful but salient and aversive stimuli. The analysis details were almost the same as Criterion 6 using forced two-choice classification test, except that the two conditions to be compared were the capsaicin and quinine conditions, not the capsaicin and control conditions.
Final model selection.
To combine results from the seven preset criteria, which consisted of four correlation coefficients (Criteria 1, 2, 4 and 5) and three classification accuracy (Criteria 3, 6 and 7), we used a percentile-based scoring method (ranged from 0 to 100 for each criterion). The method can be expressed using the following equation:
where Si,j represents the raw performance scores of i-th model for the j-th criterion; Vj represents the vectorized performance scores Si,j across models (n = the total number of candidate models); and Pi,j represents the percentile-based normalized score of i-th model for the j-th criterion. This equation assigns 100 to the model with the highest performance score and 0 to the model with the lowest performance score for each criterion. Then, the normalized percentile scores of the seven criteria were summed to one composite score value (possible range: 0–700), and we selected the model that had the highest composite score as the final model. We selected one best model per each outcome variable (that is, pain intensity and unpleasantness), and, therefore, there were two best models (one for pain intensity (Fig. 4) and the other for pain unpleasantness (Supplementary Fig. 6)). However, because the performance of the pain intensity model was slightly better than the pain unpleasantness model (Supplementary Tables 1 and 2), we focused on the pain intensity model in the current study, although the pain unpleasantness model is also available for further tests. For the graphical illustration of the model selection procedure, see Fig. 1b and Extended Data Figs. 2 and 3.
Independent testing of the ToPS.
We tested the ToPS on Study 3 data (n = 48) that were not included in the model training or validation at all. The Study 3 data, therefore, could provide a good test for the model generalizability and also allow us to obtain unbiased estimates of the model sensitivity and specificity. The tests included (a) within-individual tonic pain prediction; (b) between-individual tonic pain prediction; (c) classification between pain (capsaicin) versus control; (d) classification between pain versus bitter taste (quinine); (e) classification between pain versus aversive odor (fermented skate); (f) within-individual prediction of bitter taste; and (g) within-individual prediction of aversive odor. Tests (a) to (c) concerned model sensitivity, whereas tests (d) to (g) concerned model specificity. Most of the analysis details of tests (a) to (d) were same as Criteria 4–7 above (the ‘Model competition’ section), except that we divided the BOLD time series and continuous pain ratings into predefined numbers of time bins (five or ten bins) as described in the ‘Functional connectivity processing details for each study’ section (Supplementary Methods) for further analyses because the continuous pain rating was used in Study 3. Test (e) was the same as (d), except that an aversive odor condition was used for additional specificity testing. Tests (f) and (g) were the same as test (a), except that the avoidance ratings for bitter taste (f) and ratings for aversive odor (g) were the outcome variables, instead of the ratings for tonic pain as in (a).
Functional resting-state network assignment.
To facilitate the functional interpretation of the tonic pain model, we assigned the final brain parcellations (279 brain regions) to nine functional groups, which included seven cortical functional networks from the Buckner group27, subcortical regions and brainstem/cerebellum. The graphical illustration of the Brainnetome parcellation and its nine functional groups are provided in Supplementary Fig. 4.
Thresholding of the predictive weights using bootstrap tests.
To facilitate the feature-level interpretation of the predictive model, we conducted bootstrap tests. We iteratively generated bootstrap samples from training data (random sampling of participants with replacement; 10,000 iterations), trained predictive models using each bootstrap sample (with the same hyperparameters) and tested which features consistently contributed to the prediction using one-sample t-tests. Because too many features survived with the FDR-corrected q < 0.05, we decided to visualize the top 0.1% connections (39 connections), which corresponded to q < 0.027, FDR corrected (Fig. 4b). For the anatomical region-level connectivity patterns shown in Fig. 4c or Fig. 5a, we grouped bootstrapped weights into gross anatomical brain regions and calculated the statistical significance of each region-level predictive weights.
Developing and evaluating an SBP model.
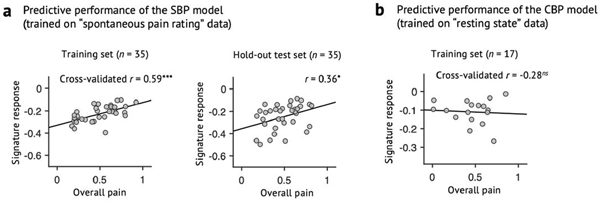
To compare the tonic pain model with other pain predictive models, we trained an fMRI connectivity-based predictive model of SBP using Study 4 data. For the SBP model, we used the ‘spontaneous pain rating’ task data only for the model development and validation (n = 70) because the ToPS showed its best performance with the task-type data. We divided the dataset into training and testing data, each of which included 35 patients, to obtain an unbiased estimate of the model performance. The grouping was stratified on the overall pain score—sorting the patients based on their overall pain scores in a descending order, grouping every two patients from the top to the bottom ranks (a total of 35 groups) and randomly sampling one patient from each group (total of 35 patients). This stratification method68 allowed us to keep the training and test samples similar on the outcome variable and avoid spurious extrapolation in prediction. Using the training dataset (n = 35), we trained models to predict overall pain severity based on the patterns of whole-brain functional connectivity averaged over longitudinal visits. We keep the modeling options the same with the ToPS—Brainnetome parcellations, DCC and PCR with reduced number of PCs— except for the hyperparameter, that is, the number of PCs, which was determined based on the leave-one-participant-out cross-validation. Because the best SBP model showed reasonable levels of cross-validated performance in the training sample, we continued to test the model onto the remaining independent testing dataset (n = 35).
Developing and evaluating a CBP model.
Similarly to the SBP model, we trained an fMRI connectivity-based predictive model of CBP using Study 4 data. For the CBP model, we used the ‘resting state’ data for only the model development and validation (n = 20) because the ToPS showed its best performance with the task-type data. Among 20 patients with CBP, three were excluded in the model development because their fMRI scans did not cover the whole brain. Using the data of the remaining 17 patients with CBP, we trained models to predict overall pain severity scores based on the patterns of whole-brain functional connectivity averaged over longitudinal visits. Other modeling procedures were the same as the development of the SBP model above. Because the best CBP model from the model training did not show good predictive performance in leave-one-participant-out cross-validation (r = −0.28), we did not proceed to further test the model.
Developing and evaluating an EPP model.
We also trained an fMRI connectivity-based predictive model of heat-induced phasic pain using Study 6 data. Using the same modeling options (that is, Brainnetome, DCC and PCR with reduced number of PCs) as other models, we trained models to predict trial-by-trial pain ratings. Similarly to the SBP models, we determined the optimal hyperparameter (that is, the number of PCs) based on the model performance from the leave-one-participant-out cross-validation.
Network-level comparisons of weight patterns among different predictive models.
To compare weight patterns among different models, we first used Pearson’s correlation between network-level averages of predictive weights (a total of 45 network-level weight averages for each model: nine within-network connections (diagonal) and 36 between-network connections (upper or lower triangle; 9C2 = 36)). To compare the mean predictive weights between predictive models (tonic versus phasic and tonic versus SBP), we conducted bootstrap tests, in which we 1) randomly sampled data with replacement 10,000 times; 2) trained the model for each iteration and applied L2 normalization to the bootstrapped model weights (to make them comparable); and 3) subtracted the network-level mean predictive weights of the EPP or SBP models from the tonic pain model. Based on the bootstrapped distribution of the difference, we 4) calculated the statistical significance for each comparison.
Statistical analysis.
In Fig. 2a,c, we used bootstrap tests (with 10,000 iterations) to test whether the distributions of within-individual prediction–outcome correlations (n = 42 and n = 48 for Fig. 2a,c, respectively) were significantly higher than zero. Before the bootstrap tests, the correlation coefficients were r to z transformed. In Fig. 2b,d, the binomial tests were used to test whether the forced two-choice classification accuracies were significantly higher than the distribution of expected classification results with the chance-level probability (that is, 50%). Here, n = 42 and n = 48 for Fig. 2b,d, respectively. In Fig. 3a,b, t-statistics calculated from Pearson’s correlation coefficients were used to test whether the between-individual prediction–outcome correlations (n = 53 and n = 20 for Fig. 3a,b, respectively) were significantly higher than zero (one-sample t-test). In Fig. 3c,d, binomial tests were used to test whether the classification accuracies were higher than the chance level, which was 63% for the test in Fig. 3c because of its unbalanced samples (patients n = 24 and healthy controls n = 39) and 50% for the test in Fig. 3d (patients n = 17 and healthy controls n = 17). In Figs. 4b,c and 5, we used bootstrap tests (with 10,000 iterations) to threshold the parcel-level, anatomical region-level or ROI-level predictive weights of the ToPS. In Fig. 6a, t-statistics calculated from Pearson’s correlation coefficient r were used to test whether the correlations between network-level predictive weights of different models (45 weights per model) were significantly higher than zero (one-sample t-test). In Fig. 6c, bootstrap tests (with 10,000 iterations) were used to test whether there was a significant difference between network-level predictive weights of different predictive models. Further details of the statistical methods are specified in each relevant description.
Extended Data
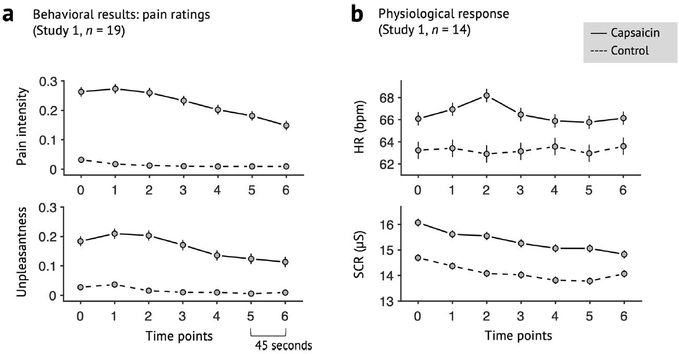
Extended Data Fig. 1 |. Behavioral data of Study 1.
a, Pain intensity and unpleasantness ratings of Study 1 (n = 19). b, Heart rate (HR; beat-per-minute) and skin conductance response (SCR; μS) of Study 1 (n = 14). Note that physiological data of five participants were discarded, because they were not recorded during scan or the data quality was too bad. Error bars represent within-subject standard errors of the mean (s.e.m.).
Extended Data Fig. 2 |. Overview of the signature development and test procedure.
Step 1: Model training. Using Study 1 data, we trained a large number of candidate models for each outcome variable (pain intensity and unpleasantness) with multiple combinations of different parcellation solutions (features), connectivity estimation methods (feature engineering), algorithms, and hyperparameters. We generated a total of 5916 candidate models for each outcome variable. Step 2: Model competition. To select the best model, we conducted a competition among the candidate models based on the pre-defined criteria including sensitivity, specificity, and generalizability based on cross-validated performance in Study 1 and also using Study 2 data as a validation dataset. For the full description of the competition procedure, please see Methods, and for the full report of the competition results, please see Extended Data Fig. 3. Step 3: Independent testing. To further characterize the final model in multiple test contexts, we tested the final model on multiple independent datasets, including two additional tonic pain dataset (Study 3 and Supplementary Data 2), three clinical pain datasets (Studies 4–5 and Supplementary Data 1), and one experimental phasic pain dataset (Study 6). Gray boxes represent locally collected datasets, and green boxes represent publicly available datasets. Different font colors indicate different scan sites.
Extended Data Fig. 3 |. Model competition results of pain intensity models.
Using multiple candidate models generated from the model development step (see Extended Data Fig. 2 and Methods for details), we conducted a model competition using 7 predefined criteria. The criteria consist of 4 correlation coefficients (within- and between-individual prediction-outcome correlations of Studies 1 and 2; shown in the top panel), and 3 classification accuracy values (for Capsaicin vs. Control in Studies 1 and 2, and for Capsaicin vs Quinine in Study 2; shown in the middle panel). Dotted lines separate different parcellations, and colored bars on the top of the plots (gray, light green, green, red, orange, and pink) represent different options of connectivity calculation methods and algorithms (see the top right for detailed description for each color bar). For CPM-based models (gray and red color bars), thresholds become more stringent from the left to the right. For PCR-based models (light green, green, orange, and pink), more PCs were used from the left to the right. To combine the 7 different performance metrics, we used a percentile-based scoring method (ranging from 0 to 100 for each criterion). The combined score (possible range: 0 to 700) was shown in the bottom panel, and the selected best model was indicated with the red arrow on the plots. Here we show the competition results only for the predictive model for pain intensity.
Extended Data Fig. 4 |. Specificity tests using a prediction approach (Study 3).
We used the ToPS to predict the avoidance ratings while participants were given a, bitter taste (quinine) or b, aversive odor. Left: Actual versus predicted ratings (that is, signature response) are shown in the plot. Signature response was calculated using the dot product of the model with the data. Signature response is using an arbitrary unit. Each colored line (or symbol) represents an individual participant’s data for across the treatment (quinine or aversive odor) and control runs (red: higher r, yellow: lower r, blue: r < 0). The exact P-values were P = 0.014 for bitter taste and P = 0.372 for aversive odor, two-tailed, bootstrap tests, n = 48. Right: Mean avoidance rating (black) and signature response (red) across the treatment and control runs. Shading represents within-subject s.e.m. Note that the left and right plots were based on averaging within five and ten time bins, respectively. ns = non-significant, *P < 0.05.
Extended Data Fig. 5 |. Noise analysis.
a, Univariate comparisons of head motion (framewise displacement, FD) and physiological measures (heart rate, HR, and respiratory rate, RR) between the capsaicin versus control conditions with the independent test dataset (Study 3, n = 48). We used the violin and box plots to show the distributions of the values. The box was bounded by the first and third quartiles, and the whiskers stretched to the greatest and lowest values within median ±1.5 interquartile range. The data points outside of the whiskers were marked as outliers. Note that 10 participants’ physiological data were excluded due to technical issues with acquisition (remaining n = 38). For statistical testing, paired t-tests (two-tailed) were conducted. b, Noise analysis 1. To examine whether the nuisance and physiology variables explain the Tonic Pain Signature (ToPS) response, we trained a model to predict the ToPS scores based on 34 nuisance variables + 2 additional physiology variables with Study 3 data. The 34 nuisance variables included 24 head motion parameters (6 movement parameters including x, y, z, roll, pitch, and yaw, their mean-centered squares, their derivatives, and squared derivative), 5 principal component scores derived from white matter (WM), and 5 principal component scores derived from cerebrospinal fluid (CSF). The 2 physiological variables were heart rate and respiratory rate. Because the effects of these confounding variables can be different across individuals and conditions, we trained predictive models for each condition and for each individual. To achieve more stable and unbiased predictive performance, we divided the data into 40 time-bins (each bin was 30 seconds) and conducted 10-fold cross-validation. Prediction-outcome correlation coefficients are visualized with violin and box plots. For statistical testing, we used one-sample t-test, two-tailed. c, Noise analysis 2. To test whether the ToPS responses can explain tonic pain ratings above and beyond the nuisance and physiology variables, we conducted multi-level general linear model (GLM) analysis (n = 38) using data averaged within 10 time bins for each individual across capsaicin and control condition (5 bins per condition), which is the same binning scheme as our main prediction results (Fig. 2c). To obtain standardized beta coefficients, all the features were z-scored. The exact P-values were (from left to right) 1.86 × 10⁻⁸ (ToPS), 0.231 (FD), 0.145 (mean WM), 0.270 (mean CSF), 0.270 (HR), and 0.272 (RR), two-tailed, multi-level GLM with bootstrap tests, 10,000 iterations. Overall, participants moved more and showed heart-rate acceleration during capsaicin (a), but the ToPS model was independent of movement and physiological variables (b). ToPS predicted pain avoidance ratings controlling for movement and physiological nuisance variables, but the nuisance variables themselves did not predict avoidance ratings. ns = not significant; ****P < 0.0001.
Extended Data Fig. 6 |. Predictive performance of the clinical pain models.
a, Predictive performance of the SBP model, which was derived using a half of SBP patients’ spontaneous pain rating task data (n = 35, training set). The SBP model was then tested on the remaining half of the SBP data (n = 35, hold-out test set) to obtain an unbiased estimate of the predictive performance. Leave-one-subject-out cross-validation was used for predicting pain scores within the training dataset. The exact P-values for the prediction performance was 0.0002 for the training set (left) and 0.032 for the hold-out test set (right), two-tailed, one-sample t-test. b, Cross-validated performance of the CBP model, which was derived using the whole CBP patients’ resting state data (n = 17, after excluding data with insufficient brain coverages). Because the CBP model showed poor predictive performance even within the training dataset, further testing of the CBP model was discontinued. The exact P-value of the prediction performance was P = 0.269, two-tailed, one-sample t-test). ns = not significant, *P < 0.05, ***P < 0.001.
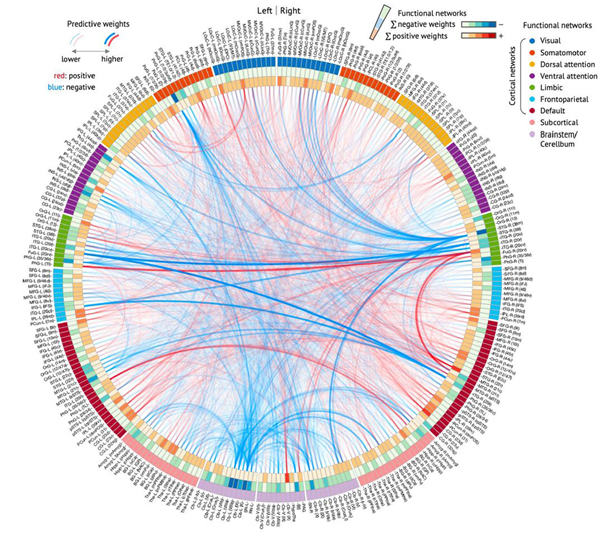
Extended Data Fig. 7 |. Circular plot representation of the ToPS.
From outermost to innermost, the first layer of the circle represents different functional groups, and the second and third layers each represent the sum of positive and negative predictive weights coming from each brain region.
Extended Data Fig. 8 |. Ventral striatum seed-based connectivity analysis.
a, We used the bilateral ventral striatum (VS) ROIs from the ToPS model as a seed to construct whole-brain seed-based connectivity maps for each time-bin of Study 1 data (n = 19). We had a particular interest in the weight patterns within the two medial prefrontal regions, dorsomedial and ventromedial prefrontal cortices (dmPFC and vmPFC). With the whole-brain connectivity maps, b, we first conducted the univariate GLM analysis. For each individual, we regressed the VS seed-based functional connectivity (Y) on pain intensity ratings (X) across capsaicin and control runs and performed second-level t-tests on the beta maps, treating participant as a random effect. Here we show the results for FDR-corrected q < 0.05 (corresponding to uncorrected P = 0.001), pruned with uncorrected P < 0.01 and 0.05 (two-tailed). c, We also conducted a multivariate analysis, in which we used the principal component regression (PCR) with reduced number of PCs to predict pain intensity ratings based on VS seed-based connectivity across capsaicin and control condition. The number of PCs was selected based on cross-validated within-individual predictive performance (#PC = 45; mean prediction-outcome r = 0.25, P = 0.002, two-tailed, bootstrap test). To identify important brain regions, we conducted the bootstrap test for the PCR with 10,000 iterations. Here we show the results for P < 0.005 uncorrected, pruned with P < 0.01 and 0.05, two-tailed. d, Regression weights in the medial prefrontal regions, focusing on the dorsomedial and ventromedial prefrontal cortices (that is, dmPFC and vmPFC). The left panel shows the unthresholded univariate map from b, and the right panel shows the unthresholded multivariate regression map from c. The pie chart represents the proportion of positive (red) and negative (blue) weights in each of the medial prefrontal regions. Across both univariate and multivariate maps, a dorsal-ventral gradient (dorsal: more positive, ventral: more negative) was found in the medial prefrontal cortex. Black lines show the contours of dmPFC and vmPFC regions.
Extended Data Fig. 9 |. Predicting tonic pain ratings with fMRi activation-based signatures for EPP.
To examine whether the fMRI activation-based pain markers could achieve similar levels of predictive performance, we tested existing fMRI activation-based models, including a, the Neurologic Pain Signature (NPS) and b, the Stimulus Intensity Independent Pain Signature-1 (SIIPS1). The top panel shows the predictive performances on the validation dataset (Study 2), and the bottom panel shows the predictive performances on the independent dataset (Study 3). In the plots on the left-side, the color of dots and lines represented the levels of correlation (r) for each participant’s pain prediction (red: higher r; yellow: lower r, blue: r < 0). The plots on the right-side show mean values of the actual avoidance ratings (black) and signature responses (red). The capsaicin run was shown before the control run for the display purpose, and in the real experiment, the order of the runs was counterbalanced across participants. Shading represents the standard errors of the mean (s.e.m.). Note that the left and right plots were based on averaging within five and ten time bins, respectively.
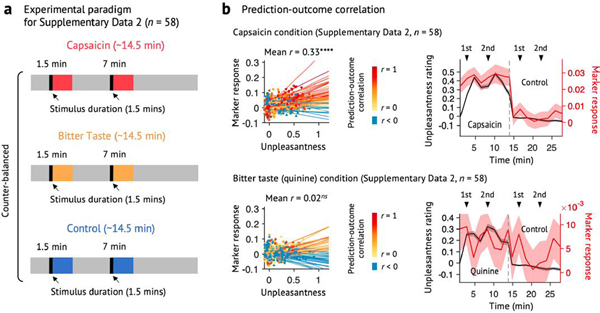
Extended Data Fig. 10 |. Testing the ToPS on an independent dataset with a different time-course of tonic pain and bitter taste (Supplementary Data 2).
We used the ToPS to predict the unpleasantness ratings while participants were given capsaicin, quinine (bitter taste), or saline (‘Control’). Here, the capsaicin and quinine stimuli were delivered to participants’ mouths using an MR-compatible gustometer system. This experimental setup allowed us to evoke capsaicin-induced orofacial tonic pain or quinine-induced bitter taste during two separate epochs within one run. a, Experimental paradigm for Supplementary Data 2 (n = 58). Each run lasts for around 14.5 minutes, and each stimulus (capsaicin for ‘Capsaicin’, quinine for ‘Bitter Taste’, and saline for ‘Control’ condition) was delivered two times within each run (1.5–3 min, and 7–8.5 min). The order of all conditions was counterbalanced across participants. b, Left: Actual versus predicted ratings (that is, signature responses) are shown in the plot. Signature response was calculated using the dot product of the model with imaging data. Each colored line (or symbol) represents an individual participant’s data across the capsaicin and control runs (red: higher r, yellow: lower r, blue: r < 0). Right: Mean avoidance rating (black) and signature response (red) across the capsaicin and control runs. Black arrows indicate when taste stimuli were delivered to participants. Shading represents within-subject s.e.m. The capsaicin and quinine runs are shown before the control run for the display purpose, regardless of the actual order of the two runs. Note that the left and right plots were based on averaging within five and ten time bins, respectively. The exact P-values were P = 3.32 × 10⁻⁹ for the capsaicin condition (top) and 0.710 for the bitter taste condition (bottom), two-tailed, bootstrap tests. ****P < 0.0001.
Supplementary Material
Acknowledgements
We thank M. C. Reddan for help with conducting experiments; the OpenPain Project (principal investigator: A. V. Apkarian) for data sharing; and M. A. Lindquist for helpful comments on using dynamic connectivity analysis tools. This work was supported by IBS-R015-D1 (Institute for Basic Science; to C.-W.W.), 2019R1C1C1004512 (National Research Foundation of Korea; to C.-W.W.), 18-BR-03 and 2019-0-01367-BabyMind (Ministry of Science and ICT, Korea; to C.-W.W.); by R01DA035484 and R01MH076136 (National Institutes of Health; to T.D.W.); and by 2018H1A2A1059844 (National Research Foundation of Korea; to J.-J.L.).
Footnotes
Reporting Summary.
Further information on research design is available in the Nature Research Reporting Summary linked to this article.
Code availability
Code for generating the main figures is available at https://github.com/cocoanlab/tops. In-house MATLAB codes for fMRI data analyses (for example, preprocessing and predictive modeling) are available at https://github.com/canlab/CanlabCore and https://github.com/cocoanlab/cocoanCORE.
Competing interests
The authors declare no competing interests.
Additional information
Extended data is available for this paper at https://doi.org/10.1038/s41591-020-1142-7.
Supplementary information is available for this paper at https://doi.org/10.1038/s41591-020-1142-7.
Peer review information Jerome Staal and Kate Gao were the primary editors on this article and managed its editorial process and peer review in collaboration with the rest of the editorial team.
Reprints and permissions information is available at www.nature.com/reprints.
Data availability
The dynamic functional connectivity data of Studies 3–5 are available at https://cocoanlab.github.io/tops and https://github.com/cocoanlab/tops as a part of the tutorial. In addition, all the data to generate main figures are available at the same GitHub repository. The data that were not used in the main figures will be shared upon reasonable request. The raw data of Studies 4 and 5 and Supplementary Data 1 are publicly available at http://www.openpain.org/. The tonic pain signature can also be shared through https://cocoanlab.github.io/tops.
References
- 1.Dahlhamer J et al. Prevalence of chronic pain and high-impact chronic pain among adults - United States, 2016. MMWR Morb. Mortal. Wkly. Rep 67, 1001–1006 (2018). [DOI] [PMC free article] [PubMed] [Google Scholar]
- 2.Gaskin DJ & Richard P The economic costs of pain in the United States. J. Pain 13, 715–724 (2012). [DOI] [PubMed] [Google Scholar]
- 3.Chapman CR & Gavrin J Suffering: the contributions of persistent pain. Lancet 353, 2233–2237 (1999). [DOI] [PubMed] [Google Scholar]
- 4.Apkarian AV Pain perception in relation to emotional learning. Curr. Opin. Neurobiol 18, 464–468 (2008). [DOI] [PMC free article] [PubMed] [Google Scholar]
- 5.Hashmi JA et al. Shape shifting pain: chronification of back pain shifts brain representation from nociceptive to emotional circuits. Brain 136, 2751–2768 (2013). [DOI] [PMC free article] [PubMed] [Google Scholar]
- 6.Baliki MN & Apkarian AV Nociception, pain, negative moods, and behavior selection. Neuron 87, 474–491 (2015). [DOI] [PMC free article] [PubMed] [Google Scholar]
- 7.Loggia ML et al. Default mode network connectivity encodes clinical pain: an arterial spin labeling study. Pain 154, 24–33 (2013). [DOI] [PMC free article] [PubMed] [Google Scholar]
- 8.Kucyi A et al. Enhanced medial prefrontal-default mode network functional connectivity in chronic pain and its association with pain rumination. J. Neurosci 34, 3969–3975 (2014). [DOI] [PMC free article] [PubMed] [Google Scholar]
- 9.Dubuisson D & Dennis SG The formalin test: a quantitative study of the analgesic effects of morphine, meperidine, and brain stem stimulation in rats and cats. Pain 4, 161–174 (1977). [DOI] [PubMed] [Google Scholar]
- 10.Stohler CS & Kowalski CJ Spatial and temporal summation of sensory and affective dimensions of deep somatic pain. Pain 79, 165–173 (1999). [DOI] [PubMed] [Google Scholar]
- 11.Rainville P, Feine JS, Bushnell MC & Duncan GH A psychophysical comparison of sensory and affective responses to four modalities of experimental pain. Somatosens. Mot. Res 9, 265–277 (1992). [DOI] [PubMed] [Google Scholar]
- 12.Huang T et al. Identifying the pathways required for coping behaviours associated with sustained pain. Nature 565, 86–90 (2019). [DOI] [PMC free article] [PubMed] [Google Scholar]
- 13.Wiech K et al. Modulation of pain processing in hyperalgesia by cognitive demand. Neuroimage 27, 59–69 (2005). [DOI] [PubMed] [Google Scholar]
- 14.Reckziegel D et al. Deconstructing biomarkers for chronic pain: context- and hypothesis-dependent biomarker types in relation to chronic pain. Pain 160, S37–S48 (2019). [DOI] [PMC free article] [PubMed] [Google Scholar]
- 15.Davis KD et al. Brain imaging tests for chronic pain: medical, legal and ethical issues and recommendations. Nat. Rev. Neurol 13, 624–638 (2017). [DOI] [PubMed] [Google Scholar]
- 16.Khoutorsky A & Price TJ Translational control mechanisms in persistent pain. Trends Neurosci. 41, 100–114 (2018). [DOI] [PMC free article] [PubMed] [Google Scholar]
- 17.Basbaum AI Distinct neurochemical features of acute and persistent pain. Proc. Natl Acad. Sci. USA 96, 7739–7743 (1999). [DOI] [PMC free article] [PubMed] [Google Scholar]
- 18.Woo CW, Chang LJ, Lindquist MA & Wager TD Building better biomarkers: brain models in translational neuroimaging. Nat. Neurosci 20, 365–377 (2017). [DOI] [PMC free article] [PubMed] [Google Scholar]
- 19.Lindquist MA, Xu Y, Nebel MB & Caffo BS Evaluating dynamic bivariate correlations in resting-state fMRI: a comparison study and a new approach. Neuroimage 101, 531–546 (2014). [DOI] [PMC free article] [PubMed] [Google Scholar]
- 20.Fan L et al. The human brainnetome atlas: a new brain atlas based on connectional architecture. Cereb. Cortex 26, 3508–3526 (2016). [DOI] [PMC free article] [PubMed] [Google Scholar]
- 21.Hastie T, Tibshirani R & Friedman JH The Elements of Statistical Learning: Data Mining, Inference, and Prediction (Springer, 2009). [Google Scholar]
- 22.Rosenberg MD, Finn ES, Scheinost D, Constable RT & Chun MM Characterizing attention with predictive network models. Trends Cogn. Sci 21, 290–302 (2017). [DOI] [PMC free article] [PubMed] [Google Scholar]
- 23.Scheinost D et al. Ten simple rules for predictive modeling of individual differences in neuroimaging. Neuroimage 193, 35–45 (2019). [DOI] [PMC free article] [PubMed] [Google Scholar]
- 24.Baliki MN et al. Corticostriatal functional connectivity predicts transition to chronic back pain. Nat. Neurosci 15, 1117–1119 (2012). [DOI] [PMC free article] [PubMed] [Google Scholar]
- 25.Vachon-Presseau E et al. Corticolimbic anatomical characteristics predetermine risk for chronic pain. Brain 139, 1958–1970 (2016). [DOI] [PMC free article] [PubMed] [Google Scholar]
- 26.Mano H et al. Classification and characterisation of brain network changes in chronic back pain: a multicenter study. Wellcome Open Res. 3, 19 (2018). [DOI] [PMC free article] [PubMed] [Google Scholar]
- 27.Yeo BT et al. The organization of the human cerebral cortex estimated by intrinsic functional connectivity. J. Neurophysiol 106, 1125–1165 (2011). [DOI] [PMC free article] [PubMed] [Google Scholar]
- 28.Senkowski D, Hofle M & Engel AK Crossmodal shaping of pain: a multisensory approach to nociception. Trends Cogn. Sci 18, 319–327 (2014). [DOI] [PubMed] [Google Scholar]
- 29.Ploner M, Lee MC, Wiech K, Bingel U & Tracey I Flexible cerebral connectivity patterns subserve contextual modulations of pain. Cereb. Cortex 21, 719–726 (2011). [DOI] [PubMed] [Google Scholar]
- 30.Kong J et al. Functional connectivity of the frontoparietal network predicts cognitive modulation of pain. Pain 154, 459–467 (2013). [DOI] [PMC free article] [PubMed] [Google Scholar]
- 31.Roy M, Piche M, Chen JI, Peretz I & Rainville P Cerebral and spinal modulation of pain by emotions. Proc. Natl Acad. Sci. USA 106, 20900–20905 (2009). [DOI] [PMC free article] [PubMed] [Google Scholar]
- 32.Ploghaus A et al. Exacerbation of pain by anxiety is associated with activity in a hippocampal network. J. Neurosci 21, 9896–9903 (2001). [DOI] [PMC free article] [PubMed] [Google Scholar]
- 33.Ossipov MH, Dussor GO & Porreca F Central modulation of pain. J. Clin. Invest 120, 3779–3787 (2010). [DOI] [PMC free article] [PubMed] [Google Scholar]
- 34.Basbaum AI & Fields HL Endogenous pain control systems: brainstem spinal pathways and endorphin circuitry. Annu. Rev. Neurosci 7, 309–338 (1984). [DOI] [PubMed] [Google Scholar]
- 35.Bushnell MC, Ceko M & Low LA Cognitive and emotional control of pain and its disruption in chronic pain. Nat. Rev. Neurosci 14, 502–511 (2013). [DOI] [PMC free article] [PubMed] [Google Scholar]
- 36.Apkarian AV, Bushnell MC, Treede RD & Zubieta JK Human brain mechanisms of pain perception and regulation in health and disease. Eur. J. Pain 9, 463–484 (2005). [DOI] [PubMed] [Google Scholar]
- 37.Ayoub LJ, Seminowicz DA & Moayedi M A meta-analytic study of experimental and chronic orofacial pain excluding headache disorders. Neuroimage Clin. 20, 901–912 (2018). [DOI] [PMC free article] [PubMed] [Google Scholar]
- 38.Lorenz J, Minoshima S & Casey KL Keeping pain out of mind: the role of the dorsolateral prefrontal cortex in pain modulation. Brain 126, 1079–1091 (2003). [DOI] [PubMed] [Google Scholar]
- 39.Wiech K, Ploner M & Tracey I Neurocognitive aspects of pain perception. Trends Cogn. Sci 12, 306–313 (2008). [DOI] [PubMed] [Google Scholar]
- 40.Seminowicz DA & Davis KD Pain enhances functional connectivity of a brain network evoked by performance of a cognitive task. J. Neurophysiol 97, 3651–3659 (2007). [DOI] [PubMed] [Google Scholar]
- 41.Wager TD et al. An fMRI-based neurologic signature of physical pain. N. Engl. J. Med 368, 1388–1397 (2013). [DOI] [PMC free article] [PubMed] [Google Scholar]
- 42.Woo CW, Roy M, Buhle JT & Wager TD Distinct brain systems mediate the effects of nociceptive input and self-regulation on pain. PLoS Biol. 13, e1002036 (2015). [DOI] [PMC free article] [PubMed] [Google Scholar]
- 43.Gabrieli JDE, Ghosh SS & Whitfield-Gabrieli S Prediction as a humanitarian and pragmatic contribution from human cognitive neuroscience. Neuron 85, 11–26 (2015). [DOI] [PMC free article] [PubMed] [Google Scholar]
- 44.Woo CW et al. Quantifying cerebral contributions to pain beyond nociception. Nat. Commun 8, 14211 (2017). [DOI] [PMC free article] [PubMed] [Google Scholar]
- 45.Coghill RC, Sang CN, Maisog JM & Iadarola MJ Pain intensity processing within the human brain: a bilateral, distributed mechanism. J. Neurophysiol 82, 1934–1943 (1999). [DOI] [PubMed] [Google Scholar]
- 46.Seminowicz DA & Moayedi M The dorsolateral prefrontal cortex in acute and chronic pain. J. Pain 18, 1027–1035 (2017). [DOI] [PMC free article] [PubMed] [Google Scholar]
- 47.Baars BJ Global workspace theory of consciousness: toward a cognitive neuroscience of human experience. Prog. Brain Res 150, 45–53 (2005). [DOI] [PubMed] [Google Scholar]
- 48.Wager TD, Atlas LY, Leotti LA & Rilling JK Predicting individual differences in placebo analgesia: contributions of brain activity during anticipation and pain experience. J. Neurosci 31, 439–452 (2011). [DOI] [PMC free article] [PubMed] [Google Scholar]
- 49.Tetreault P et al. Brain connectivity predicts placebo response across chronic pain clinical trials. PLoS Biol. 14, e1002570 (2016). [DOI] [PMC free article] [PubMed] [Google Scholar]
- 50.Segerdahl AR, Mezue M, Okell TW, Farrar JT & Tracey I The dorsal posterior insula subserves a fundamental role in human pain. Nat. Neurosci 18, 499–500 (2015). [DOI] [PMC free article] [PubMed] [Google Scholar]
- 51.Mazzola L, Isnard J, Peyron R & Mauguiere F Stimulation of the human cortex and the experience of pain: Wilder Penfield’s observations revisited. Brain 135, 631–640 (2012). [DOI] [PubMed] [Google Scholar]
- 52.Bushnell MC et al. Pain perception: is there a role for primary somatosensory cortex? Proc. Natl Acad. Sci. USA 96, 7705–7709 (1999). [DOI] [PMC free article] [PubMed] [Google Scholar]
- 53.Rainville P, Duncan GH, Price DD, Carrier B & Bushnell MC Pain affect encoded in human anterior cingulate but not somatosensory cortex. Science 277, 968–971 (1997). [DOI] [PubMed] [Google Scholar]
- 54.Atlas LY, Bolger N, Lindquist MA & Wager TD Brain mediators of predictive cue effects on perceived pain. J. Neurosci 30, 12964–12977 (2010). [DOI] [PMC free article] [PubMed] [Google Scholar]
- 55.Horing B, Sprenger C & Buchel C The parietal operculum preferentially encodes heat pain and not salience. PLoS Biol. 17, e3000205 (2019). [DOI] [PMC free article] [PubMed] [Google Scholar]
- 56.Zhang S et al. The control of tonic pain by active relief learning. eLife 7, e31949 (2018). [DOI] [PMC free article] [PubMed] [Google Scholar]
- 57.Seymour B et al. Opponent appetitive-aversive neural processes underlie predictive learning of pain relief. Nat. Neurosci 8, 1234–1240 (2005). [DOI] [PubMed] [Google Scholar]
- 58.Baliki MN et al. Chronic pain and the emotional brain: specific brain activity associated with spontaneous fluctuations of intensity of chronic back pain. J. Neurosci 26, 12165–12173 (2006). [DOI] [PMC free article] [PubMed] [Google Scholar]
- 59.Rodriguez E et al. A craniofacial-specific monosynaptic circuit enables heightened affective pain. Nat. Neurosci 20, 1734–1743 (2017). [DOI] [PMC free article] [PubMed] [Google Scholar]
- 60.Garcia J, Hankins WG & Rusiniak KW Behavioral regulation of the milieu interne in man and rat. Science 185, 824–831 (1974). [DOI] [PubMed] [Google Scholar]
- 61.Buckner RL, Krienen FM, Castellanos A, Diaz JC & Yeo BT The organization of the human cerebellum estimated by intrinsic functional connectivity. J. Neurophysiol 106, 2322–2345 (2011). [DOI] [PMC free article] [PubMed] [Google Scholar]
- 62.Choi EY, Yeo BT & Buckner RL The organization of the human striatum estimated by intrinsic functional connectivity. J. Neurophysiol 108, 2242–2263 (2012). [DOI] [PMC free article] [PubMed] [Google Scholar]
- 63.Eickhoff SB et al. A new SPM toolbox for combining probabilistic cytoarchitectonic maps and functional imaging data. Neuroimage 25, 1325–1335 (2005). [DOI] [PubMed] [Google Scholar]
- 64.Diedrichsen J et al. Imaging the deep cerebellar nuclei: a probabilistic atlas and normalization procedure. Neuroimage 54, 1786–1794 (2011). [DOI] [PubMed] [Google Scholar]
- 65.Glasser MF et al. A multi-modal parcellation of human cerebral cortex. Nature 536, 171–178 (2016). [DOI] [PMC free article] [PubMed] [Google Scholar]
- 66.Allen EA et al. Tracking whole-brain connectivity dynamics in the resting state. Cereb. Cortex 24, 663–676 (2014). [DOI] [PMC free article] [PubMed] [Google Scholar]
- 67.Shen X et al. Using connectome-based predictive modeling to predict individual behavior from brain connectivity. Nat. Protoc 12, 506–518 (2017). [DOI] [PMC free article] [PubMed] [Google Scholar]
- 68.Cochran WG Sampling Techniques (Wiley, 1977). [Google Scholar]
Associated Data
This section collects any data citations, data availability statements, or supplementary materials included in this article.
Supplementary Materials
Data Availability Statement
The dynamic functional connectivity data of Studies 3–5 are available at https://cocoanlab.github.io/tops and https://github.com/cocoanlab/tops as a part of the tutorial. In addition, all the data to generate main figures are available at the same GitHub repository. The data that were not used in the main figures will be shared upon reasonable request. The raw data of Studies 4 and 5 and Supplementary Data 1 are publicly available at http://www.openpain.org/. The tonic pain signature can also be shared through https://cocoanlab.github.io/tops.


