

Abstract
Background:
Hepatocellular carcinoma (HCC) is a leading causes of cancer mortality worldwide. Improved tools are needed for detecting HCC so that treatment can begin as early as possible. Current diagnostic approaches and existing biomarkers, such as alpha-fetoprotein (AFP) lack sensitivity, resulting in too many false negative diagnoses. Machine-learning may be able to identify combinations of biomarkers that provide more robust predictions and improve sensitivity for detecting HCC. We sought to evaluate whether metabolites in patient saliva could distinguish those with HCC, cirrhosis, and those with no documented liver disease.
Methods and Results:
We tested 125 salivary metabolites from 110 individuals (43 healthy, 37 HCC, 30 cirrhosis) and identified 4 metabolites that displayed significantly different abundance between groups (FDR P <.2). We also developed four tree-based, machine-learning models, optimized to include different numbers of metabolites, that were trained using cross-validation on 99 patients and validated on a withheld test set of 11 patients. A model using 12 metabolites –octadecanol, acetophenone, lauric acid, 1-monopalmitin, dodecanol, salicylaldehyde, glycyl-proline, 1-monostearin, creatinine, glutamine, serine and 4-hydroxybutyric acid— had a cross-validated sensitivity of 84.8%, specificity of 92.4% and correctly classified 90% of the HCC patients in the test cohort. This model outperformed previously reported sensitivities and specificities for AFP (20–100ng/ml) (61%, 86%) and AFP plus ultrasound (62%, 88%).
Conclusions and Impact:
Metabolites detectable in saliva may represent products of disease pathology or a breakdown in liver function. Notably, combinations of salivary metabolites derived from machine-learning may serve as promising non-invasive biomarkers for the detection of HCC.
Keywords: Metabolomics, machine learnings, cirrhosis, liver cancer, risk factor
Lay Summary
Changes in the presence and quantity of small molecules in saliva, such as metabolites, can indicate disease in the body. We measured the abundance of 125 metabolites in the saliva of individuals who have liver cancer compared with individuals who have cirrhosis or no documented liver disease. We found that the amount of acetophenone was significantly different among all three groups and seven other metabolites were significantly different in at least one comparison. We then used machine learning to determine if combinations of metabolites could predict if a person has liver cancer as opposed to cirrhosis or a healthy liver. We found that by measuring 12 metabolites in patient saliva, we could correctly classify 90% of patients as having liver cancer, cirrhosis, or no liver disease.
Introduction
In the year 2020, it is estimated that 42,810 individuals will have been diagnosed with liver and intrahepatic bile duct cancers in the United States, resulting in 30,160 deaths (1). These cancers are the 5th and 7th leading cause of cancer deaths in males and females, respectively (1). Hepatocellular carcinoma (HCC) comprises 80% of all diagnosed liver cancers (2). A majority of patients that develop HCC have preexisting cirrhosis, and HCC is leading cause of death among individuals with cirrhosis (3). Cirrhosis can develop after infection with hepatitis B or hepatitis C, heavy alcohol consumption, or in individuals with chronic liver diseases such as nonalcoholic fatty liver disease (NAFLD) and nonalcoholic steatohepatitis (NASH) (4)(5)(6). The prevalence of liver cancers has been steadily rising since the 1970s (1) due to hepatitis C infections and increases in obesity resulting in chronic liver diseases (4)(6)(7).
The five-year survival rate of HCC is drastically different depending on the stage at diagnosis because curative therapies are often only available if HCC is detected early (8). Patients with early stage HCC (Barcelona-Clinic Liver Cancer staging (BCLC) 0/A) have a prognosis of >4 years because the cancer can sometimes be eradicated by therapies such as resection or liver transplantation (3). However, patients with advanced stage HCC (BCLC C), who are often ineligible for resection, are treated with chemotherapeutics and have a prognosis of <1 year (3). Treatments are rarely effective for patients with terminal stage HCC (BCLC D) and these individuals have a prognosis of only 3 months (3).
Since early HCC detection improves survival (9), surveillance using ultrasound of the liver, with or without monitoring alpha-fetoprotein (AFP) levels, is recommended every six months for those with cirrhosis (8). Surveillance using AFP alone identifies HCC with a sensitivity of 61% and specificity of 86%, and using AFP in addition to ultrasound marginally increases the sensitivity and specificity to 62% and 88%, respectively (10). Therefore, additional informative biomarkers that could be incorporated into the surveillance of these patients could help to prevent false negative diagnoses and enable curative treatment options prior to the onset of advanced disease.
Metabolomics aims to characterize the metabolites present in a particular biospecimen and is demonstrating promise for precision medicine with its ability to distinguishing a variety of disease states (11)(12). To date, metabolite biomarkers for HCC have been identified in blood, breath and urine (13)(14). Saliva is an attractive biofluid for biomarker discovery because it can be collected non-invasively and requires limited training for collection and storage. At present, 44 studies have highlighted potential metabolite biomarkers in saliva for identifying patients with Alzheimer’s disease, breast cancer, prostate cancer, oral cancer, and other diseases(15). However, to our knowledge this is the first study to identify salivary metabolite biomarkers that can distinguish patients with HCC from healthy individuals and patients with cirrhosis.
Methods
Subject Recruitment
Saliva samples were collected from a real-world clinical cohort of 110 adult patients (>18 years of age) seen at the Cleveland Clinic (Cleveland, OH) between 2018–2020 with cirrhosis (N=30) or HCC (N=37) that underwent liver transplantation for HCC or cirrhosis, surgical resection for HCC, or liver biopsy with confirmed cirrhosis and/or HCC. In addition, patients attending treatment for hernia with no history of liver disease or liver cancer were used as healthy control subjects (N=43). Clinical characteristics of study participants and diagnostic criteria including cirrhosis etiology, Child-Pugh class, and BCLC stage, can be found in Table 1 and Supplementary Tables 1,2. In addition to an initial assessment from imaging and clinical presentation, a histopathological assessment was performed to confirm HCC and cirrhosis diagnoses as part of the patient’s standard of care. Written informed consent was provided by all participants, the study conformed to the ethical guidelines of the 1975 Declaration of Helsinki, and was approved by the Cleveland Clinic IRB (IRB #10–347).
Table 1:
Summary statistics for study cohort
| Characteristic | Healthy | Cirrhosis | HCC |
|---|---|---|---|
| Total (n) | 43 | 30 | 37 |
| Mean age (min-max) | 57.6 (36–77) | 58 (33–80) | 67.3 (44–94) |
| Sex | |||
| Male (%) | 27 (63%) | 12 (40%) | 30 (81%) |
| Female (%) | 16 (37%) | 18 (60%) | 7 (19%) |
| Diabetes mellitus type 2 | 11(26%) | 14(47%) | 21(57%) |
| Hypertension | 19(44%) | 13(43%) | 23(62%) |
| Coronary artery disease | 4(9%) | 6(20%) | 11(30%) |
| Hyperlipidemia | 14(33%) | 7(23%) | 12(32%) |
| Psychiatric disorder | 12(28%) | 7(23%) | 6(16%) |
| COPD/Asthma/OSA | 15(35%) | 6(20%) | 9(24%) |
| Other cancer history | 6(14%) | 6(20%) | 10(27%) |
| Thyroid | 7(16%) | 8(27%) | 2(5%) |
| Other PMH | 30(70%) | 29(97%) | 32(86%) |
| Ascites | 0(0%) | 21(70%) | 9(24%) |
| Encephalopathy | 0(0%) | 20(67%) | 7(19%) |
| Mean Hemoglobin (g/dl) (SEM) | 13.3 (0.3) | 11.2 (0.6) | 13.5 (0.4) |
| Mean Platelets (k/uL) (SEM) | 274.6 (12.2) | 116.4 (12.2) | 190.4 (13.8) |
| Mean AST (U/L) (SEM) | 24.1 (1.4) | 55.6 (7) | 73.5 (12.6) |
| Mean ALT (U/L) (SEM) | 24.3 (2.2) | 41.9 (9.7) | 58.2 (10.2) |
| Mean ALP (U/L) (SEM) | 79.1 (5.3) | 208.8 (35.5) | 128.4 (14) |
| Mean Bilirubin, Total (mg/dL) (SEM) | 0.5 (0.1) | 1.8 (0.3) | 1 (0.2) |
| Mean Albumin (g/dL) (SEM) | 4.2 (0.1) | 3.5 (0.1) | 3.8 (0.1) |
| Mean PT-INR (SEM) | 0.9 (0) | 1.3 (0.1) | 1.2 (0) |
| Mean Glucose (mg/dL) (SEM) | 114.2 (7.7) | 132.5 (14.8) | 138.3 (10.1) |
| Mean Creatinine (mg/dL) (SEM) | 1.1 (0.1) | 1 (0.1) | 1 (0.1) |
Saliva collection and Gas Chromatography Mass Spectrometry
A saliva sample was collected, after a standard mouth rinse, from each subject using the DNA Genotek OMNIgene ORAL OM-505 (Ottawa, Ontario) at the time of their scheduled visit with their physician. Samples were subjected to untargeted gas chromatography time of flight mass spectrometry (GC-TOF MS) at the West Coast Metabolomics Center (Davis, CA). A Leco Pegasus IV mass spectrometer was used with unit mass resolution at 17 spectra s-1 from 80–500 Da at −70 eV ionization energy and 1800 V detector voltage with a 230°C transfer line and a 250°C ion source. The analytical GC column was protected by a 10 m long empty guard column which is cut by 20 cm intervals whenever the reference mixture QC samples indicate problems caused by column contaminations. This chromatography method is designed to yield high quality retention and separation of primary metabolite classes (amino acids, hydroxyl acids, carbohydrates, sugar acids, sterols, aromatics, nucleosides, amines and other compounds) with narrow peak widths of 2–3 s and high quality within-series retention time reproducibility of better than 0.2 s absolute deviation of retention times. An automatic liner exchange was used after each set of 10 injections to reduce sample carryover for highly lipophilic compounds such as free fatty acids. Samples were run in two batches, resulting in 181 and 163 identified metabolites detected in each batch, respectively, and the relative abundance levels, quantified by peak height, were reported. 125 metabolites were identified in both batches and represented lipids, amino acids, peptides and sugars involved in pathways such as glycolysis, citric acid cycle, the urea cycle, fatty acid metabolism, phospholipid biosynthesis and ethanol degradation among others.
Data Processing and Quality Control
Missing values (two metabolites in three subjects) were imputed with half the minimum relative abundance across the cohort. Metabolite relative abundance levels were right skewed and log transformation was effective at normalizing the data. Six technical duplicate samples were included in each of the two experimental batches for quality control purposes. Principal component analysis (PCA) revealed variation in the metabolite relative abundance due to experimental batch as evidenced by the separation of these technical replicates. Mean centering and scaling by the metabolite standard deviations were effectively corrected for differences due to batch (Supplemental Figure 1).
Metabolite Associations
Metabolite associations with disease group were performed using the open source, statistical analysis software, R (16). The relative abundance levels of the 125 identified metabolites were individually tested for associations with disease status (i.e., healthy, cirrhosis, HCC) using pair-wise logistic regression models. Age, sex, and smoking status were tested for association using logistic regression models with each disease outcome and were included as model covariates when significantly associated with disease status (P < .05) (Supplementary Tables 1,2). All metabolite P values were adjusted for multiple testing using the Benjamini-Hochberg false discovery rate (FDR) approach and an FDR P < 0.2 was used as the threshold for statistical significance.
Predictive Model Development
First, 10% of the subjects in each disease group were randomly partitioned into a test set that was excluded from model training and used to evaluate model performance. The remaining subjects (N=99) were assigned to the model training set. We evaluated four tree-based machine learning approaches to determine whether combinations of salivary metabolites could be used as a biomarker signature for detecting HCC and cirrhosis. To prevent model overfitting, each model was trained using a leave-one-out cross-validation (LOOCV) approach, where a single subject was iteratively removed from model training and then the model was used to make a prediction on the withheld subject. Model training performance was then evaluated on the withheld subjects from the LOOCV procedure and on the withheld test subjects. Three variations of Random Forest™ (RF) (17) were investigated: 1) A random forest model (RF125) including all detected metabolites was used to classify subjects by disease status. Hyperparameter optimization was performed using a grid search to identify the optimal number of trees (ntree), and 150 was chosen as the optimal ntree value based on the mean misclassification, sensitivity, and specificity across the LOOCV iterations (Supplemental Figure 2). We then employed an iterative random forest approach (iRF) to select metabolites that would produce a model that would maximize predictive power with a minimal set of metabolites. This was done by generating a model using all 125 metabolites (RF125) and then iteratively eliminating the metabolite with the lowest mean Gini score across the LOOCV procedure until only a single metabolite remained. 2) The second model included twelve metabolites, representing the top 10% of metabolites selected using iRF approach (iRF12). 3) The out of bag error was then used to select the optimal number of metabolites that would produce the best performing model, and this model optimized at four metabolites (iRF4). 4) We also employed a classification and regression tree method (CART) to generate a binary decision tree to classify disease status based on metabolite abundance using the R package, rpart (18). The 12 selected metabolites from iRF12 were used as input into the CART model, which was built using a LOOCV procedure for the 99 subjects in the training set. The CART model optimized at 4 metabolites (minsplit=20, cp=0.01). LOOCV was used to calculate sensitivity, specificity, balanced accuracy, misclassification, positive predictive value (PPV), and negative predictive value (NPV) for each of the four models. Each model was then evaluated for accuracy and overfitting using the withheld test cohort of 11 subjects (4 healthy, 3 cirrhosis, 4 HCC).
Results
Out of the 110 participants (43 healthy, 30 cirrhosis, 37 HCC), a total of 125 metabolites were identified from obtained saliva samples (Figure 1). There were some significant demographic differences between the groups, which were used as covariates to adjust for potential bias in the metabolite associations. Individuals in the HCC group were on older than individuals in the cirrhosis and healthy groups (P < .05). In addition, there were significantly more males in the HCC group than in the cirrhosis group (P < .05). Lastly, current smoking status was significantly higher in patients with HCC than those with cirrhosis (P < .05) (Supplemental Tables 3-5).
Figure 1:

Workflow diagram for data collection, processing, analysis and generation of predictive models for disease state classification using metabolite relative abundance.
Metabolite Associations
Four metabolites—acetophenone, octadecanol, lauric acid, 3-hydroxybutyric acid—were significantly different between two or more groups (FDR P < .2) (Figure 2A,B, Table 2). Acetophenone was significantly different in all three pair-wise comparisons: compared to healthy individuals, it was significantly decreased in patients with cirrhosis and significantly decreased further in patients with HCC. Octadecanol was also decreased in both patients with HCC and patients with cirrhosis in comparison to healthy control subjects (Figure 2A,B, Table 2). Additionally, lauric acid, 3-hydroxybutyric acid, threonic acid, glycerol-alpha-phosphate, butylamine and alpha-tocopherol were decreased in patients with HCC compared to healthy control subjects (Figure 2A,B, Table 2). Associations for all metabolites with each disease status are provided in Supplementary Tables 6-8.
Figure 2: Eight metabolites differ between patient cohorts.
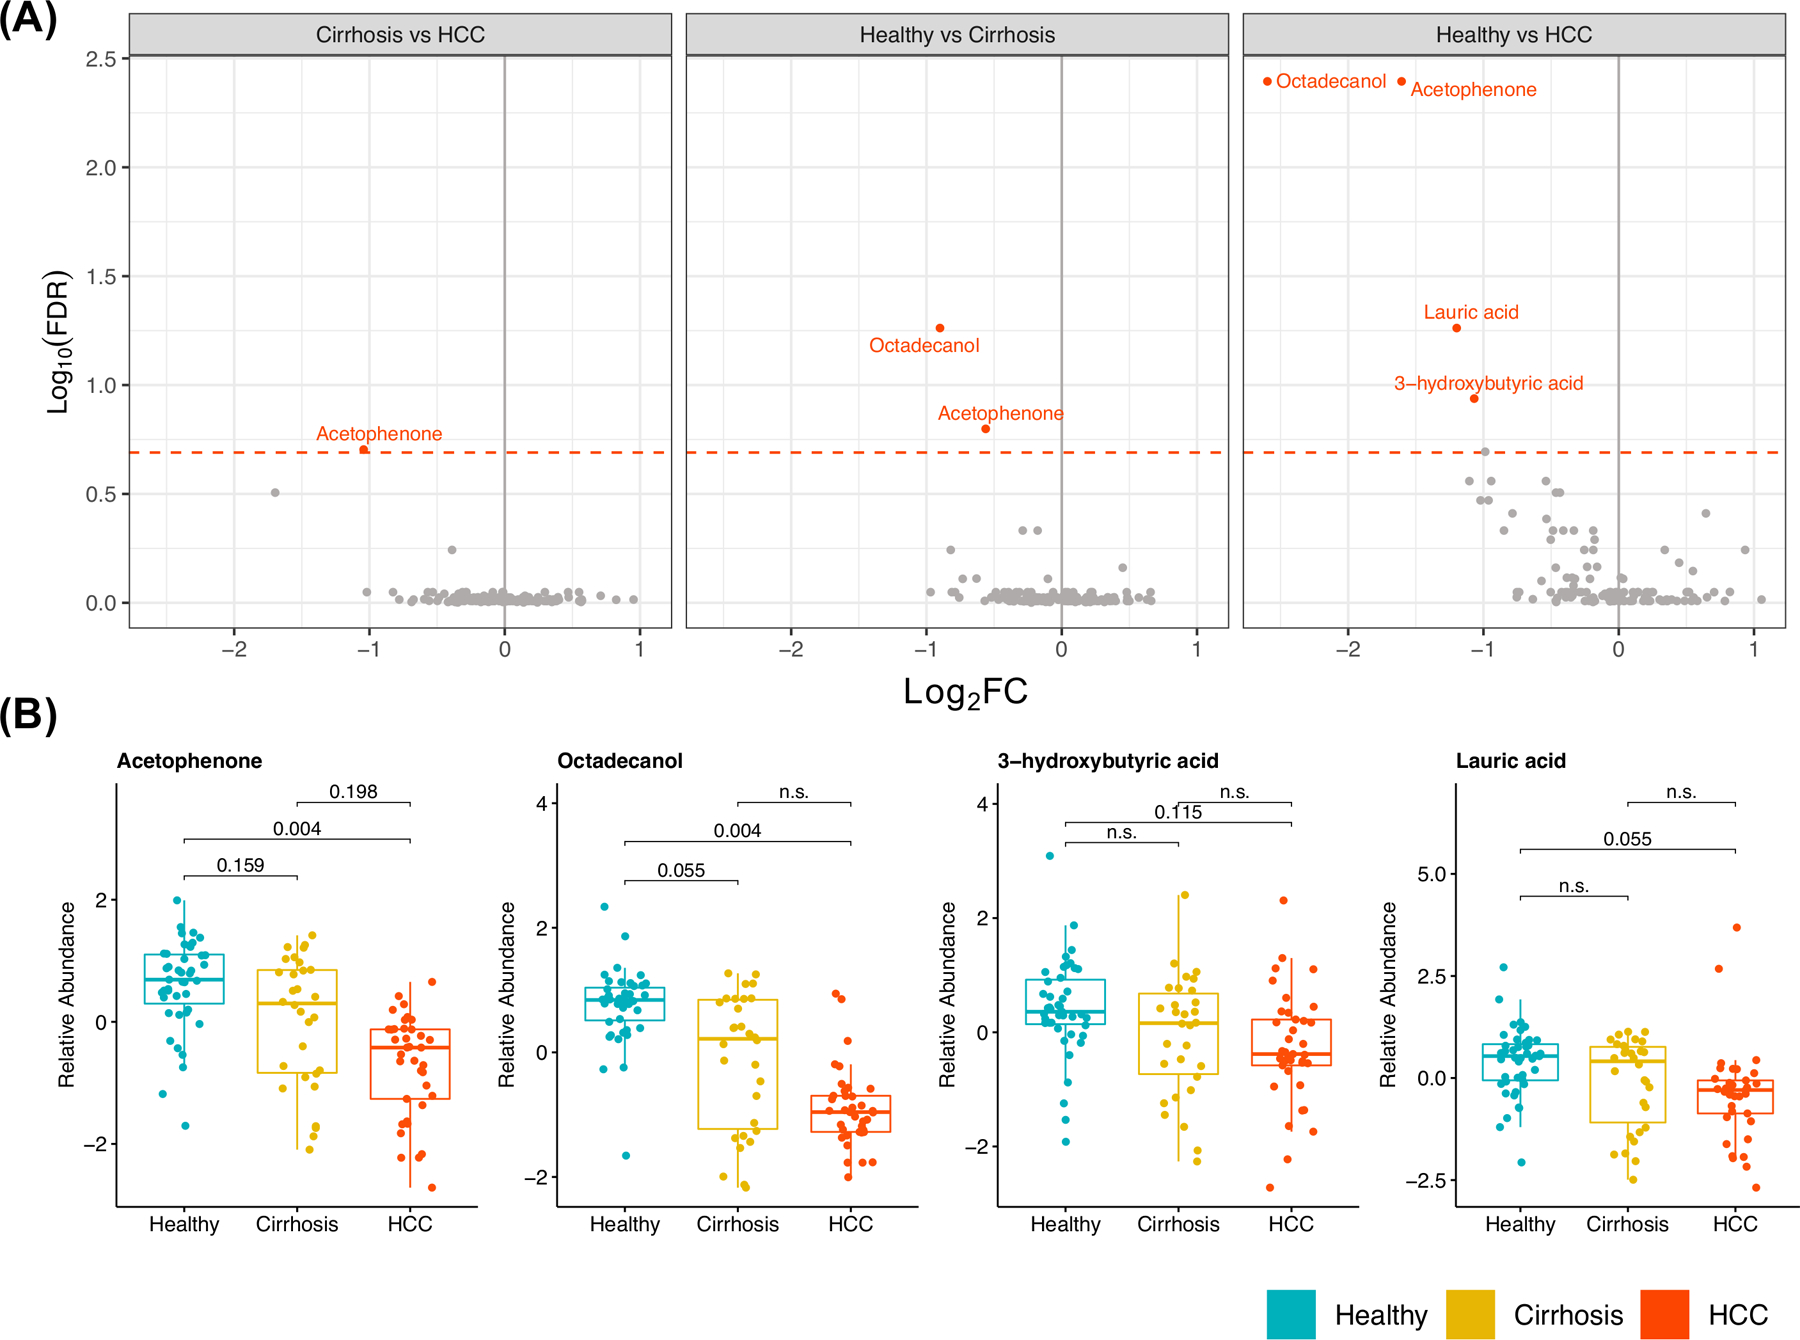
a) Volcano plot depicting false discovery rate (FDR) and Log2 Fold Change (Log2 FC) derived for all metabolites in pair-wise comparisons of disease status, adjusted for differences in age and sex. Metabolites with an FDR P<.2 (dotted red line) are highlighted. b) Box plots displaying distribution of relative abundance stratified by disease status for significantly differing metabolites in at least one comparison (FDR P < .2, adjusted for age and sex).
Table 2:
Significant disease status associations with metabolite abundance
| Group1 (Reference) | Group2 | Metabolite | Coefficient (SE) | P Value | FDR P |
|---|---|---|---|---|---|
| Cirrhosis | HCC | Acetophenone | −1.124 (0.387) | .004 | .198 |
| Healthy | Cirrhosis | Acetophenone | −1.026 (0.34) | .003 | .159 |
| Healthy | Cirrhosis | Octadecanol | −1.498 (0.431) | <.001 | .055 |
| Healthy | HCC | 3-hydroxybutyric acid | −1.299 (0.41) | .002 | .115 |
| Healthy | HCC | Acetophenone | −2.289 (0.531) | <.001 | .004 |
| Healthy | HCC | Lauric acid | −1.062 (0.309) | <.001 | .055 |
| Healthy | HCC | Octadecanol | −3.656 (0.861) | <.001 | .004 |
Metabolite selection using iterative random forest (iRF) and Decision Tree (DT) approaches
Three RF models were considered based on their mean training LOOCV out of bag (OOB) error rates. The initial model, incorporating all 125 metabolites (RF125) had a mean LOOCV OOB error rate of 35.6% and the range of Gini Scores, demonstrating metabolite importance, across LOOCV iterations for the 125 metabolites is shown in Figure 3A,B. A subsequent model, iRF12, included the top 10% of metabolites (n=12) selected using the iterative RF approach (Fig. 3A) (19), and had a mean LOOCV OOB error of 19.7% (Figure 3A,C). iRF4 was the model with the lowest global mean misclassification (15.3%) which utilized the following four metabolites—octadecanol, acetophenone, 1-monopalmitin and 1-monostearin (Figure 3A,D). A decision tree classification model was developed with the 12 metabolites selected for iRF12 (Figure 3D). The pruned decision tree selected four metabolites—octadecanol, 1-monopalmatin, 1-monostearin, and 4-hydroxybutyric acid—and had a LOOCV OOB error rate of 12.7% of the subjects (Figure 4).
Figure 3: Random Forest model predicts disease status from metabolite abundance.
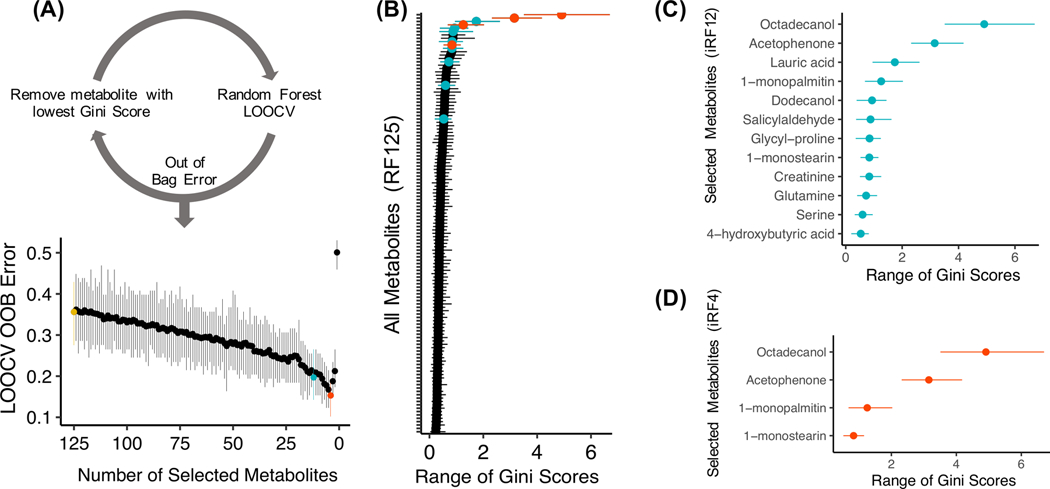
a) An iterative random forest (iRF) approach was used, whereby RF models were generated after iteratively removing the metabolite with the lowest mean Gini score within a leave-one-out cross-validation (LOOCV) framework. The range (min, mean, max) of OOB error across the models is displayed. The model including 125 metabolites is shown in red (RF125), the model including 12 metabolites is shown in blue (iRF12) and the model including 4 metabolites is shown in red (iRF4). b) The range of Gini scores (minimum, mean, maximum) across all metabolites in model RF125. Red coloring indicates the selected metabolites for the iRF models. c) The range of Gini scores of metabolites included in the iRF8. d) The range of Gini scores of metabolites included in iRF4.
Figure 4: Classification of disease status predicted by decision tree model.
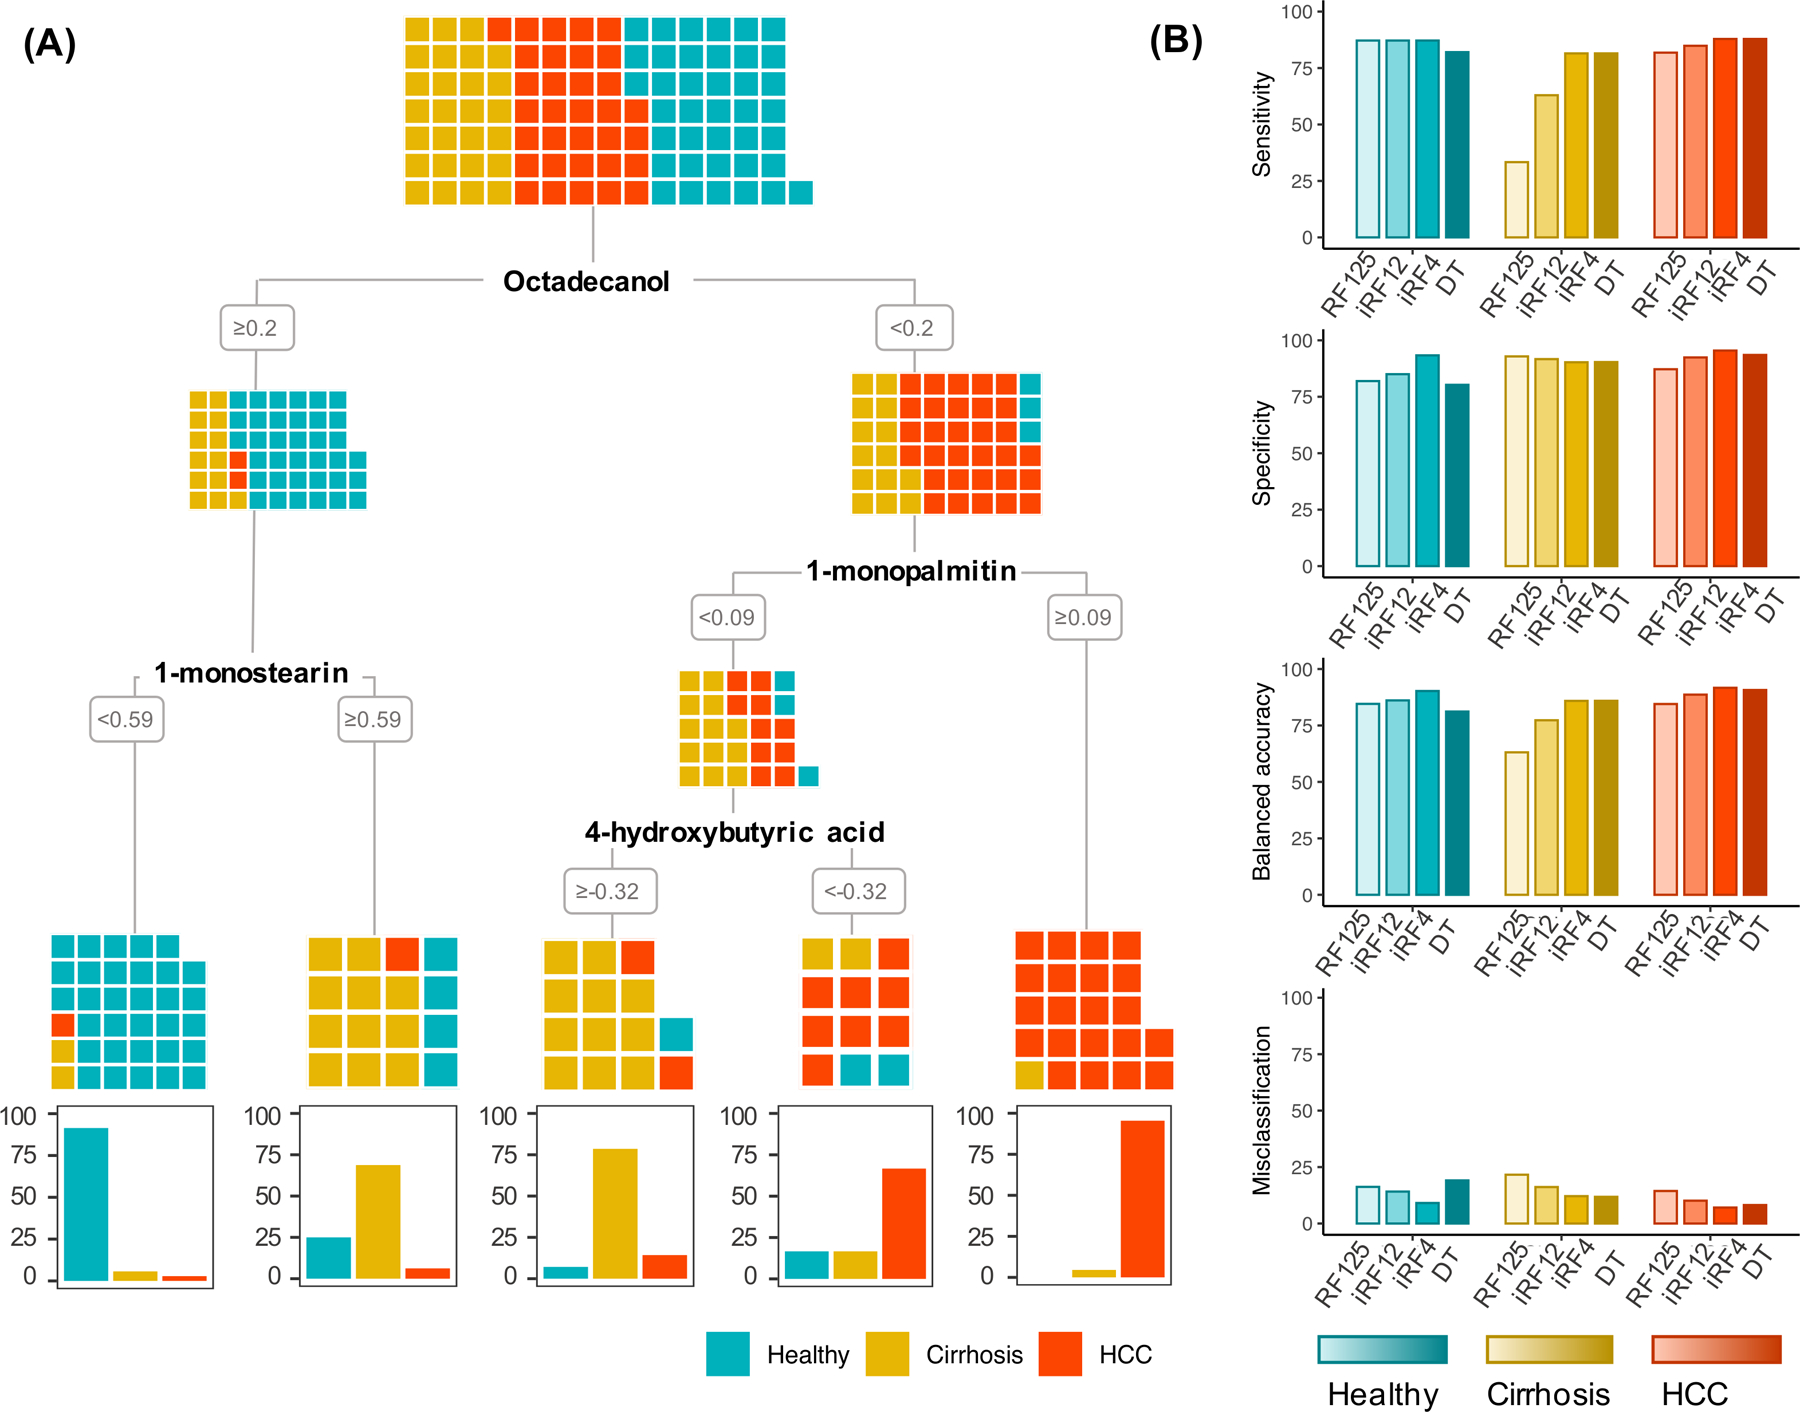
a) A decision tree model based on selected metabolites from the iterative random forest (iRF12) approach optimized with a classification accuracy of 86%. Colored squares indicate the disease status of each individual by disease status at each branch of the decision tree. b) Comparison of accuracy metrics from RF with all metabolites (RF125), iRFs with selected metabolites (iRF12, iRF4), and the decision tree models (DT) using leave-one-out cross-validation.
Comparison of Model Performance
RF125 correctly classified 65/99 (66%) patients in the training cohort and 9/11 (82%) patients in the test cohort, misclassifying two individuals with cirrhosis (Supplementary Table 9). iRF12 correctly classified 82/99 (83%) patients in the training cohort and 10/11(91%) of patients in the test cohort, misclassifying one individual with cirrhosis (Supplementary Table 9). iRF4 correctly classified 85/99 (86%) patients in the training cohort and 9/11(82%) of patients in the test cohort, misclassifying two individuals with HCC (Supplementary Table 9). The decision tree model correctly classified 83/99 (84%) patients in the training cohort and 8/11 (73%) patients in the test cohort (Figure 4A). In the training set, 16 of the 99 individuals in the training set were misclassified (7 healthy individuals, 5 individuals with cirrhosis, 4 individuals with HCC). Notably, misclassifications did not appear to be due to differences in BCLC stage or Child-Pugh class (Supplementary Figures 4-5). In the test set, two healthy individuals and one individual with HCC were misclassified (Supplementary Table 9). Overall, misclassified patients across the training and test cohorts showed a range of cirrhosis etiologies, Child-Pugh classes, and BCLC stages (Supplementary Table 9), indicating that the misclassifications were not due to early or minimal disease. All models produced similar accuracy metrics in the training and test cohorts indicating minimal model overfitting. We also compared the performance metrics (i.e., sensitivity, specificity, balanced accuracy, misclassification, NPV, PPV) derived from the LOOCV of the training set across the four models for each disease status. Upon taking the mean of each metric among healthy, cirrhosis, and HCC, iRF4 outperformed other models in all metrics (Table 3).
Table 3:
Accuracy metrics for predicting disease status
| Disease | Model | Sensitivity | Specificity | Balanced accuracy | Misclassification | PPV1 | NPV2 |
|---|---|---|---|---|---|---|---|
| Healthy | iRF125 | 87.2 | 81.9 | 84.6 | 16.2 | 30.6 | 53.1 |
| HCC | 81.8 | 87.2 | 84.5 | 14.4 | 24.3 | 61.3 | |
| Cirrhosis | 33.3 | 92.9 | 63.1 | 21.6 | 8.1 | 70.3 | |
| Average | 67.4 | 87.3 | 77.4 | 17.4 | 21 | 61.6 | |
| Healthy | iRF12 | 87.2 | 85 | 86.1 | 14.1 | 34.3 | 51.5 |
| HCC | 84.8 | 92.4 | 88.6 | 10.1 | 28.3 | 61.6 | |
| Cirrhosis | 63 | 91.7 | 77.3 | 16.2 | 17.2 | 66.7 | |
| Average | 78.3 | 89.7 | 84 | 13.5 | 26.6 | 59.9 | |
| Healthy | iRF4 | 87.2 | 93.3 | 90.3 | 9.1 | 34.3 | 56.6 |
| HCC | 87.9 | 95.4 | 91.7 | 7.1 | 29.3 | 63.6 | |
| Cirrhosis | 81.5 | 90.3 | 85.9 | 12.1 | 22.2 | 65.7 | |
| Average | 85.5 | 93 | 89.3 | 9.4 | 28.6 | 62 | |
| Healthy | Decision Tree | 82 | 80.3 | 81.2 | 19.1 | 29.1 | 51.8 |
| HCC | 87.9 | 93.5 | 90.7 | 8.2 | 26.4 | 65.4 | |
| Cirrhosis | 81.5 | 90.4 | 85.9 | 11.8 | 20 | 68.2 | |
| Average | 83.8 | 88.1 | 85.9 | 13 | 25.2 | 61.8 |
PPV=positive predictive value;
NPV=negative predictive value
Healthy Subjects
For healthy subjects, specificity (93.3%), balanced accuracy (90.3%), PPV (34.3%), and NPV (56.6%) were highest, and misclassification (9.1%) was lowest, in model iRF4 (Figure 4B, Table 3). Sensitivity was 87.2% across models RF125, iRF12 and iRF4.
Cirrhosis
For patients with cirrhosis, balanced accuracy (85.9%) was highest and misclassification was lowest (11.8%) in the DT model. PPV (22.2%) was highest in model iRF4 and NPV was highest (70.3% in model iRF125). Sensitivity was highest in both the iRF4 and Decision Tree models (81.5%) (Figure 4B, Table 3).
HCC
For patients with HCC, specificity (95.5%), balanced accuracy (91.7%), and PPV (29.3%) were highest, and misclassification (7.1%) was lowest, in the iRF4 model. NPV (65.5%) was highest in DT model and sensitivity (87.9%) was highest in both iRF4 and DT models (Fig. 4B, Table 3).
Discussion
The incidence of HCC continues to increase, due in large part to the prevalence of cirrhosis from hepatitis B, hepatitis C, alcoholic liver disease, and the rapidly increasing incidence of NASH and NAFLD (4)(5)(6). Prognoses for patients with HCC decline rapidly from the onset of disease, underscoring the need for inexpensive and accessible testing for individuals at high risk, such as those with cirrhosis (8). Ultrasound, or ultrasound plus serum biomarker AFP, are the current gold standard for screening patients for HCC. However, the sensitivity of AFP plus ultrasound is only 62%, resulting in too many missed cases (10). Saliva is an enticing biofluid for biomarker discovery because collection is noninvasive and samples can be stabilized at room temperature for extended periods of time (20). To our knowledge, this analysis represents the first investigation of salivary metabolites in patients with HCC. We identified metabolites in saliva that differed significantly in abundance among disease states and we used machine-learning to discover combinations of metabolites with predictive power to accurately classify patients with HCC, patients with cirrhosis, and healthy individuals that were effective for detecting HCC in patients with a wide range of BCLC stages and Child-Pugh classes.
We identified four individual metabolites that were significantly decreased in patients with HCC compared to healthy control subjects (FDR P < .20). Of these, octadecanol and acetophenone were the only metabolites that were also significant in comparisons of healthy patients and those with cirrhosis. Octadecanol, a fatty alcohol found in plasmalogen lipids, was significantly decreased in patients with cirrhosis [FC:−0.91 , FDR P =.046] and those with HCC [FC:−2.6 , FDR P = .004] compared to healthy individuals. Accumulation of octadecanol is known to occur in individuals who harbor mutations in ALDH3A2, the gene that encodes fatty aldehyde dehydrogenase (FALDH). Interestingly, CTNNB1 is mutated in ~20–40% of HCCs and encodes the β-catenin protein, which has been shown to regulate ALDH3A2 (21). Additional research is needed to determine if levels of octadecanol differ among individuals in our cohort due to genetic variation in these genes(22). Acetophenone, an alkyl-phenyl ketone, was significantly decreased with disease progression in all three pairwise comparisons—decreased in individuals with cirrhosis compared to healthy subjects [FC:−0.58 , FDR P = 0.137], decreased in HCC compared to healthy subjects [FC:−1.65 , FDR P = .004], and also decreased in those with HCC compared to cirrhosis [FC:−1.08 , FDR P = .175] (Fig. 2b). Interestingly, acetophenone has also been shown to be significantly downregulated in the exhaled breath of patients with cirrhotic and non-cirrhotic NAFLD compared to healthy individuals (23). Acetophenone is naturally found in many types of plants, and is used as a flavor additive in numerous products, including chewing gum and cigarettes, among others (24). Although there were significantly more individuals with HCC who reported being current smokers compared to individuals with cirrhosis (P=.03)(Supplementary Table 3), we did not observe a significant association between acetophenone and smoking status (P=.96) (data not shown). Additionally, we identified decreased levels of 3-hydroxybutyric acid in patients with HCC (Fig. 2b), and abnormal concentrations of 3-hydroxybutyric acid have been linked with metabolic disorders such as diabetes and obesity, which are risk factors for chronic liver diseases and HCC (25)(26)(27).
By leveraging combinations of multiple metabolites, we were able to discriminate between healthy individuals, those with cirrhosis, and those with HCC with high accuracy (Fig. 4). We interrogated four different tree-based machine-learning models to identify the panel of metabolites with the best predictive power. The four models, RF125, iRF12, iRF4 and DT displayed cross-validated sensitivities for detecting HCC of 81.8%, 84.9%, 87.9%, 87.9% and specificities of 87.2%, 92.4%, 95.5%, 93.5%, respectively. Although, we were unable to compare AFP levels in our real-world clinical cohort because the standard surveillance for HCC in patients with cirrhosis may or may not include AFP and is not indicated in otherwise healthy patients, it is notable that all models displayed better sensitivities and specificities across LOOCV than those reported by a meta-analysis of AFP (20–100ng/ml) (61%, 86%) and AFP plus ultrasound (62%, 88%) (10). When the models were validated on the withheld test cohort, DT correctly classified 73% of the patients, compared to 84% during the cross-validation training procedure, suggesting that it may have been moderately overfitted to the training cohort. However, RF models are known to be robust to overfitting (28), and RF125 and iRF12 both correctly classified 91% of the withheld test subjects. This indicated that RF models were robust to overfitting and the most likely to have high predictive accuracy. We hypothesized that patients that were misclassified may have been those with early-stage cirrhosis or HCC. However, salivary metabolites appear to be effective at classifying individuals with minimal or early-stage disease with no discernable patterns related to the detection of cirrhosis or HCC based on Child-Pugh class or BCLC staging (Supplementary Figures 4-5). A single patient with HCC with BCLC stage 0 and 13/15 patients with BCLC stage A were classified correctly (Supplementary Table 5). Furthermore, salivary metabolites were effective at classifying patients with early-stage cirrhosis (Child-Pugh class A) (Supplementary Table 4). Classification accuracies in the test cohort also supported the ability of the model to accurately classify individuals with early-stage disease (Supplementary Table 9). In addition to saliva samples being easier to obtain compared to ultrasound or serum AFP, these results support the notion that salivary metabolites show promise for detecting early-stage HCC, with evidence for improved sensitivity and specificity over current clinical tests. However, additional prospective studies will be needed to validate these initial findings.
Several metabolites were not significantly different between the disease cohorts, but were determined to be, in combination with other metabolites, informative for distinguishing groups in the machine-learning models. iRF12 included glycyl-proline, which is a dipeptide cleavage product of glycyl-proline dipeptidyl aminopeptidase (GPDA). Interestingly, GPDA has been shown to be elevated in the serum of patients with HCC, and has also been proposed as a serum biomarker for detection of HCC (29). Two amino acids included in iRF12, serine and glutamine, have been previously reported to be altered in several studies of serum, urine and liver biopsies of patients with cirrhosis or HCC. Serine levels are altered in patients with cirrhosis compared to healthy individuals (serum) (30)(31), patients with HCC compared to healthy individuals (urine) (32), and serine levels differ between individuals with cirrhosis and those with HCC (serum) (33). Glutamine levels differed between healthy individuals and those with cirrhosis (serum, liver tissue) (34)(35), between healthy individuals with those with HCC (serum, liver tissue) (35)(36)(37), and between individuals with HCC and those with cirrhosis (serum, liver tissue) (36)(38)(37). The enzyme responsible for making glutamine, glutamine synthetase, has been identified as a potential biomarker of early HCC in proteomic analyses and has been shown to promote cell migration by mediating epithelial-mesenchymal transition (39). Creatinine was selected as a feature in the iRF12 model and creatinine levels have been previously associated with survival among patients with HCC (40)(41). Furthermore, 1H NMR identified altered levels of creatinine in urine of patients with HCC (42) and serum of patients with cirrhosis (34).
4-hydroxybutyric acid, a metabolite of acetoacetate, which is produced by β-Hydroxy β-methylglutaryl-CoA (HMG-CoA) in the liver and is a precursor of gamma aminobutyric acid (GABA), was included in both iRF12 and DT models. Notably, 4-hydroxybutyric acid is sometimes prescribed to treat alcohol addiction and narcolepsy; however, based on medical records, none of the patients in our cohort have been prescribed this drug. Levels of 4-hydroxybutyric acid have also been shown to differ based on biological sex (43), however, the levels were not significantly different in our dataset (P=.48) (Fig. S3a-c).
Dodecanol, salicylaldehyde, 1-monopalmatin, 1-monostearin, selected as features in iRF12, have been linked to metabolic disorders. Altered levels of dodecanol and 1-monostearin have been found in the breast milk of women with obesity (44) and plasma levels of dodecanol and salicylaldehyde change in the serum of women with obesity after exercise (45). Additionally, 1-monopalmatin and 1-monostearin (included in models iRF12, iRF4 and DT), have also been identified as in serum as biomarkers of diabetes (46)(47) and obesity (47)(48). However, this is the first study to propose that 1-monostearin and 1-monopalmitin may, in combination with other metabolites, serve as potential salivary biomarkers of HCC. Because 1-monostearin and 1-monopalmitin, and other potential metabolites may be dysregulated in numerous diseases, an approach that leverages information from multiple metabolites may lead to improved predictive accuracies compared to relying on a single biomarker. Additional work will be needed to validate the specificity of our model in predicting HCC among these other diseases and disorders.
Strengths of this study include having a well characterized, real-world cohort of individuals with and without evidence of chronic liver disease as control groups. This helps to ensure that the metabolites dysregulated in HCC are not confounded by the presence or absence of existing liver disease in our cohort of patients with HCC. In addition, the inclusion of a test cohort helps to validate that the models are indeed able to predict individuals in each disease class and are not subject to model overfitting. The use of untargeted metabolomics provided an unbiased evaluation of the metabolome rather than being restricted, based on a priori knowledge, to investigate targeted metabolites in certain metabolic pathways. As with any study, there were important limitations to the study design. Although we were able to assess classification accuracy using our test cohort, it was too small to reliably calculate sensitivity, specificity and other accuracy metrics. Our healthy control cohort had no documented chronic liver disease, however, liver diseases such as NAFLD/NASH are commonly underdiagnosed and we cannot rule out this cohort at our healthy control cohort did not have underlying liver disease. Cirrhosis etiology varied among patients in the cohort (Supplementary Tables 1-2), and the sample size was too small to determine if the model was more or less effective at detecting individuals based on certain etiologies of cirrhosis. We also limited our study to classifying healthy individuals, those with cirrhosis and those with HCC, but do not know if these models would also be able to discriminate among other liver pathologies or metabolic syndromes.
To our knowledge, this is the first study to demonstrate the predictive capacity of salivary metabolites to discriminate patients with HCC from those with cirrhosis and healthy individuals. Our model outperformed previously reported diagnostic measures of current clinical HCC biomarkers using a less expensive, less invasive sampling method. Additional studies are underway to validate these findings in an independent cohort and to determine if these metabolites are associated with patient outcomes. Additionally, combining salivary metabolites with other non-invasive biospecimens, such as breath (14) or serum (49) may further increase the ability to screen patients for HCC. Given the rapidly increasing incidence of HCC and the importance of early detection in this disease, leveraging advances in machine-learning with metabolomics profiles obtained from non-invasive biospecimens, such as saliva, may lead to new biomarker signatures capable of detecting HCC and prioritizing patients for more invasive diagnostic procedures.
Supplementary Material
Acknowledgments
Financial Support: This work was supported by in part by National Institutes of Health grants R01 DK120679 (J.M.B.), P50 AA024333 (J.M.B., D.S.A.), P01 HL147823 (J.M.B.), the VeloSano Foundation, and a Cleveland Clinic Research Center of Excellence Award.
Abbreviations
- HCC
Hepatocellular Carcinoma
- AFP
Alpha-fetoprotein
- FDR P
False discovery rate adjusted P value
- BCLC
Barcelona Clinic Liver Cancer Staging
- PCA
Principal component analysis
- LOOCV
Leave one out cross validation
- RF
Random forest
- iRF
Iterative random forest
- DT
Decision tree
- CART
Classification and regression trees
- PPV
Positive predictive value
- NPV
Negative predictive value
Footnotes
Competing Interests
D.M.R. has an equity stake in Interpares Biomedicine, LLC. D.M.R., F.A., D.S.A hold intellectual property related to the detection of hepatocellular carcinoma.
Ethics and Consent:
Written informed consent was provided by all participants, the study conformed to the ethical guidelines of the 1975 Declaration of Helsinki, and was approved by the Cleveland Clinic IRB (IRB #10–347)
Code Availability
The analysis pipeline and R scripts used to perform all statistical analyses is available at https://github.com/rotroff-lab/HCC_Saliva_Metabolomics
References
- 1.Siegel RL, Miller KD, Jemal A. Cancer statistics, 2020. CA Cancer J Clin. United States; 2020;70:7–30. [DOI] [PubMed] [Google Scholar]
- 2.Petrick JL, Kelly SP, Altekruse SF, McGlynn KA, Rosenberg PS. Future of Hepatocellular Carcinoma Incidence in the United States Forecast Through 2030. J Clin Oncol Off J Am Soc Clin Oncol 2016;34:1787–94. [DOI] [PMC free article] [PubMed] [Google Scholar]
- 3.Forner A, Reig M, Bruix J. Hepatocellular carcinoma. Lancet Lond Engl. England; 2018;391:1301–14. [DOI] [PubMed] [Google Scholar]
- 4.Roerecke M, Vafaei A, Hasan OSM, Chrystoja BR, Cruz M, Lee R, et al. Alcohol Consumption and Risk of Liver Cirrhosis: A Systematic Review and Meta-Analysis. Am J Gastroenterol 2019;114:1574–86. [DOI] [PMC free article] [PubMed] [Google Scholar]
- 5.Sun C-A, Wu D-M, Lin C-C, Lu S-N, You S-L, Wang L-Y, et al. Incidence and cofactors of hepatitis C virus-related hepatocellular carcinoma: a prospective study of 12,008 men in Taiwan. Am J Epidemiol. United States; 2003;157:674–82. [DOI] [PubMed] [Google Scholar]
- 6.White DL, Kanwal F, El-Serag HB. Association between nonalcoholic fatty liver disease and risk for hepatocellular cancer, based on systematic review. Clin Gastroenterol Hepatol Off Clin Pract J Am Gastroenterol Assoc 2012;10:1342–1359.e2. [DOI] [PMC free article] [PubMed] [Google Scholar]
- 7.Younossi ZM, Stepanova M, Afendy M, Fang Y, Younossi Y, Mir H, et al. Changes in the prevalence of the most common causes of chronic liver diseases in the United States from 1988 to 2008. Clin Gastroenterol Hepatol Off Clin Pract J Am Gastroenterol Assoc. United States; 2011;9:524–530.e1; quiz e60. [DOI] [PubMed] [Google Scholar]
- 8.Marrero JA, Kulik LM, Sirlin CB, Zhu AX, Finn RS, Abecassis MM, et al. Diagnosis, Staging, and Management of Hepatocellular Carcinoma: 2018 Practice Guidance by the American Association for the Study of Liver Diseases. Hepatol Baltim Md. United States; 2018;68:723–50. [DOI] [PubMed] [Google Scholar]
- 9.Singal AG, Pillai A, Tiro J. Early detection, curative treatment, and survival rates for hepatocellular carcinoma surveillance in patients with cirrhosis: a meta-analysis. PLoS Med 2014;11:e1001624. [DOI] [PMC free article] [PubMed] [Google Scholar]
- 10.Zhang J, Chen G, Zhang P, Zhang J, Li X, Gan D, et al. The threshold of alpha-fetoprotein (AFP) for the diagnosis of hepatocellular carcinoma: A systematic review and meta-analysis. PloS One 2020;15:e0228857. [DOI] [PMC free article] [PubMed] [Google Scholar]
- 11.Wishart DS. Emerging applications of metabolomics in drug discovery and precision medicine. Nat Rev Drug Discov. England; 2016;15:473–84. [DOI] [PubMed] [Google Scholar]
- 12.Long NP, Nghi TD, Kang YP, Anh NH, Kim HM, Park SK, et al. Toward a Standardized Strategy of Clinical Metabolomics for the Advancement of Precision Medicine. Metabolites 2020;10. [DOI] [PMC free article] [PubMed] [Google Scholar]
- 13.Liu X-N, Cui D-N, Li Y-F, Liu Y-H, Liu G, Liu L. Multiple “Omics” data-based biomarker screening for hepatocellular carcinoma diagnosis. World J Gastroenterol 2019;25:4199–212. [DOI] [PMC free article] [PubMed] [Google Scholar]
- 14.Miller-Atkins G, Acevedo-Moreno L-A, Grove D, Dweik RA, Tonelli AR, Brown JM, et al. Breath Metabolomics Provides an Accurate and Noninvasive Approach for Screening Cirrhosis, Primary, and Secondary Liver Tumors. Hepatol Commun 2020;4:1041–55. [DOI] [PMC free article] [PubMed] [Google Scholar]
- 15.Gardner A, Carpenter G, So P-W. Salivary Metabolomics: From Diagnostic Biomarker Discovery to Investigating Biological Function. Metabolites 2020;10. [DOI] [PMC free article] [PubMed] [Google Scholar]
- 16.R: A language and environment for statistical computing Vienna, Austria: R Foundation for Statistical Computing; 2017. [Google Scholar]
- 17.Breiman Leo. Random forests. Machine Learning 2001;45:5–32. [Google Scholar]
- 18.Therneau Terry, Atkinson Beth. Recursive Partitioning and Regression Trees [Internet] 2019. Available from: https://CRAN.R-project.org/package=rpart [Google Scholar]
- 19.Yuan Chunhui, Yang Haitao. Research on K-Value Selection Method of K-Means Clustering Algorithm. J 2019;2:226–35. [Google Scholar]
- 20.Nunes AP, Oliveira IO, Santos BR, Millech C, Silva LP, González DA, et al. Quality of DNA extracted from saliva samples collected with the Oragene™ DNA self-collection kit. BMC Med Res Methodol 2012;12:65. [DOI] [PMC free article] [PubMed] [Google Scholar]
- 21.Liu S, Yeh T-H, Singh VP, Shiva S, Krauland L, Li H, et al. β-catenin is essential for ethanol metabolism and protection against alcohol-mediated liver steatosis in mice. Hepatol Baltim Md 2012;55:931–40. [DOI] [PMC free article] [PubMed] [Google Scholar]
- 22.Keller MA, Zander U, Fuchs JE, Kreutz C, Watschinger K, Mueller T, et al. A gatekeeper helix determines the substrate specificity of Sjögren-Larsson Syndrome enzyme fatty aldehyde dehydrogenase. Nat Commun 2014;5:4439. [DOI] [PMC free article] [PubMed] [Google Scholar]
- 23.Sinha R, Lockman KA, Homer NZM, Bower E, Brinkman P, Knobel HH, et al. Volatomic analysis identifies compounds that can stratify non-alcoholic fatty liver disease. JHEP Rep Innov Hepatol 2020;2:100137. [DOI] [PMC free article] [PubMed] [Google Scholar]
- 24.National Center for Biotechnology Information. PubChem Compound Summary for CID 7410, Acetophenone [Internet] 2020[cited 2020 Nov 10]. Available from: https://pubchem.ncbi.nlm.nih.gov/compound/Acetophenone.
- 25.Sheikh-Ali M, Karon BS, Basu A, Kudva YC, Muller LA, Xu J, et al. Can serum beta-hydroxybutyrate be used to diagnose diabetic ketoacidosis? Diabetes Care. United States; 2008;31:643–7. [DOI] [PubMed] [Google Scholar]
- 26.Vice E, Privette JD, Hickner RC, Barakat HA. Ketone body metabolism in lean and obese women. Metabolism. United States; 2005;54:1542–5. [DOI] [PubMed] [Google Scholar]
- 27.Caldwell SH, Crespo DM, Kang HS, Al-Osaimi AMS. Obesity and hepatocellular carcinoma. Gastroenterology. United States; 2004;127:S97–103. [DOI] [PubMed] [Google Scholar]
- 28.Liaw Andy, Wiener Matthew. Classification and Regresion by randomForest. R News 2002;2:18–22. [Google Scholar]
- 29.Ni R-Z, Huang J-F, Xiao M-B, Li M, Meng X-Y. Glycylproline dipeptidyl aminopeptidase isoenzyme in diagnosis of primary hepatocellular carcinoma. World J Gastroenterol 2003;9:710–3. [DOI] [PMC free article] [PubMed] [Google Scholar]
- 30.Xue R, Dong L, Wu H, Liu T, Wang J, Shen X. Gas chromatography/mass spectrometry screening of serum metabolomic biomarkers in hepatitis B virus infected cirrhosis patients. Clin Chem Lab Med. Germany; 2009;47:305–10. [DOI] [PubMed] [Google Scholar]
- 31.Gong Z-G, Zhao W, Zhang J, Wu X, Hu J, Yin G-C, et al. Metabolomics and eicosanoid analysis identified serum biomarkers for distinguishing hepatocellular carcinoma from hepatitis B virus-related cirrhosis. Oncotarget 2017;8:63890–900. [DOI] [PMC free article] [PubMed] [Google Scholar]
- 32.Chen T, Xie G, Wang X, Fan J, Qiu Y, Zheng X, et al. Serum and urine metabolite profiling reveals potential biomarkers of human hepatocellular carcinoma. Mol Cell Proteomics MCP 2011;10:M110.004945. [DOI] [PMC free article] [PubMed] [Google Scholar]
- 33.Fitian AI, Nelson DR, Liu C, Xu Y, Ararat M, Cabrera R. Integrated metabolomic profiling of hepatocellular carcinoma in hepatitis C cirrhosis through GC/MS and UPLC/MS-MS. Liver Int Off J Int Assoc Study Liver 2014;34:1428–44. [DOI] [PMC free article] [PubMed] [Google Scholar]
- 34.Qi S-W, Tu Z-G, Peng W-J, Wang L-X, Ou-Yang X, Cai A-J, et al. 1H NMR-based serum metabolic profiling in compensated and decompensated cirrhosis. World J Gastroenterol 2012;18:285–90. [DOI] [PMC free article] [PubMed] [Google Scholar]
- 35.Gao H, Lu Q, Liu X, Cong H, Zhao L, Wang H, et al. Application of 1H NMR-based metabonomics in the study of metabolic profiling of human hepatocellular carcinoma and liver cirrhosis. Cancer Sci. England; 2009;100:782–5. [DOI] [PMC free article] [PubMed] [Google Scholar]
- 36.Yang Y, Li C, Nie X, Feng X, Chen W, Yue Y, et al. Metabonomic studies of human hepatocellular carcinoma using high-resolution magic-angle spinning 1H NMR spectroscopy in conjunction with multivariate data analysis. J Proteome Res. United States; 2007;6:2605–14. [DOI] [PubMed] [Google Scholar]
- 37.Nahon P, Amathieu R, Triba MN, Bouchemal N, Nault J-C, Ziol M, et al. Identification of serum proton NMR metabolomic fingerprints associated with hepatocellular carcinoma in patients with alcoholic cirrhosis. Clin Cancer Res Off J Am Assoc Cancer Res. United States; 2012;18:6714–22. [DOI] [PubMed] [Google Scholar]
- 38.Gao R, Cheng J, Fan C, Shi X, Cao Y, Sun B, et al. Serum Metabolomics to Identify the Liver Disease-Specific Biomarkers for the Progression of Hepatitis to Hepatocellular Carcinoma. Sci Rep 2015;5:18175. [DOI] [PMC free article] [PubMed] [Google Scholar]
- 39.Liu P, Lu D, Al-Ameri A, Wei X, Ling S, Li J, et al. Glutamine synthetase promotes tumor invasion in hepatocellular carcinoma through mediating epithelial-mesenchymal transition. Hepatol Res Off J Jpn Soc Hepatol. Netherlands; 2020;50:246–57. [DOI] [PubMed] [Google Scholar]
- 40.Tamai Y, Iwasa M, Kawasaki Y, Yoshizawa N, Ogura S, Sugimoto R, et al. Ratio between estimated glomerular filtration rates of creatinine and cystatin C predicts overall survival in patients with hepatocellular carcinoma. Hepatol Res Off J Jpn Soc Hepatol. Netherlands; 2019;49:153–63. [DOI] [PubMed] [Google Scholar]
- 41.Liu P-H, Hsu C-Y, Hsia C-Y, Lee Y-H, Su C-W, Huang Y-H, et al. Prognosis of hepatocellular carcinoma: Assessment of eleven staging systems. J Hepatol. Netherlands; 2016;64:601–8. [DOI] [PubMed] [Google Scholar]
- 42.Shariff MIF, Kim JU, Ladep NG, Crossey MME, Koomson LK, Zabron A, et al. Urinary Metabotyping of Hepatocellular Carcinoma in a UK Cohort Using Proton Nuclear Magnetic Resonance Spectroscopy. J Clin Exp Hepatol 2016;6:186–94. [DOI] [PMC free article] [PubMed] [Google Scholar]
- 43.Vaiano F, Serpelloni G, Furlanetto S, Palumbo D, Mari F, Fioravanti A, et al. Determination of endogenous concentration of γ-hydroxybutyric acid (GHB) in hair through an ad hoc GC-MS analysis: A study on a wide population and influence of gender and age. J Pharm Biomed Anal. England; 2016;118:161–6. [DOI] [PubMed] [Google Scholar]
- 44.Saben JL, Sims CR, Piccolo BD, Andres A. Maternal adiposity alters the human milk metabolome: associations between nonglucose monosaccharides and infant adiposity. Am J Clin Nutr. United States; 2020;112:1228–39. [DOI] [PubMed] [Google Scholar]
- 45.Grapov D, Fiehn O, Campbell C, Chandler CJ, Burnett DJ, Souza EC, et al. Exercise plasma metabolomics and xenometabolomics in obese, sedentary, insulin-resistant women: impact of a fitness and weight loss intervention. Am J Physiol Endocrinol Metab 2019;317:E999–1014. [DOI] [PMC free article] [PubMed] [Google Scholar]
- 46.Hameed A, Mojsak P, Buczynska A, Suleria HAR, Kretowski A, Ciborowski M. Altered Metabolome of Lipids and Amino Acids Species: A Source of Early Signature Biomarkers of T2DM. J Clin Med 2020;9. [DOI] [PMC free article] [PubMed] [Google Scholar]
- 47.Park S, Sadanala KC, Kim E-K. A Metabolomic Approach to Understanding the Metabolic Link between Obesity and Diabetes. Mol Cells 2015;38:587–96. [DOI] [PMC free article] [PubMed] [Google Scholar]
- 48.Butte NF, Liu Y, Zakeri IF, Mohney RP, Mehta N, Voruganti VS, et al. Global metabolomic profiling targeting childhood obesity in the Hispanic population. Am J Clin Nutr 2015;102:256–67. [DOI] [PMC free article] [PubMed] [Google Scholar]
- 49.Lu Y, Huang C, Gao L, Xu Y-J, Chia SE, Chen S, et al. Identification of serum biomarkers associated with hepatitis B virus-related hepatocellular carcinoma and liver cirrhosis using mass-spectrometry-based metabolomics. Metabolomics 2015;11:1526–38. [Google Scholar]
Associated Data
This section collects any data citations, data availability statements, or supplementary materials included in this article.