

Abstract
Objective:
Guidelines for repair of bicuspid aortic valve (BAV)-associated ascending thoracic aortic aneurysms (aTAA) have been changing, most recently to the same criteria as tricuspid aortic valve (TAV)-aTAA. Rupture/dissection occurs when wall stress exceeds wall strength. Recent studies suggest similar strength of BAV vs. TAV-aTAA; thus, comparative wall stress may better predict dissection in BAV vs. TAV-aTAA. Our aim was to determine whether BAV-aTAA had higher wall stresses than their TAV counterparts.
Methods:
BAV- and TAV-aTAA patients (BAV=17, TAV=19) >4.5cm underwent ECG-gated computed tomography angiography. Patient-specific 3D geometry was reconstructed and loaded to systemic pressure after accounting for pre-stress geometry. Finite element analyses were performed using LS-DYNA solver with user-defined fiber-embedded material model to determine aTAA wall stress.
Results:
BAV-aTAA 99th-percentile longitudinal stresses were 280kPa vs. 242kPa (p=0.028) for TAV-aTAA in systole. These stresses did not correlate to diameter for BAV-aTAA (r=−0.004) but had better correlation to TAV-aTAA diameter (r=0.677). Longitudinal stresses on sinotubular junction (STJ) were significantly higher in BAV-aTAA than TAV-aTAA (405kPa vs. 329kPa, p=0.023). BAV-aTAA 99-percentile circumferential stresses were 548kPa vs. 462kPa (p=0.033) for TAV-aTAA, which also did not correlate to BAV-aTAA diameter (r=0.007).
Conclusions:
Circumferential and longitudinal stresses were greater in BAV- than TAV-aTAA and were more pronounced in the STJ. Peak wall stress did not correlate with BAV-aTAA diameter, suggesting diameter alone in this population may be a poor predictor of dissection risk. Our results highlight the need for patient-specific aneurysm wall stress analysis for accurate dissection risk prediction.
Introduction
Bicuspid aortic valve (BAV) is the most common congenital aortic valve defect occurring in 0.5% to 2% of the general population. However, BAV patients account for up to 15% of those presenting with aortic dissection or rupture1. Rupture and/or dissection of ascending thoracic aortic aneurysm (aTAA) is a highly lethal condition with a 1%/hour mortality rate2. To avoid complications of aortic dissection/rupture, American College of Cardiology (ACC)/American Heart Association (AHA) have developed guidelines2–5 for elective repair of aTAA, which include consideration of BAV vs tricuspid aortic valve (TAV) phenotype. Previously, these guidelines recommended earlier repair of BAV-aTAA at sizes smaller than that recommended for TAV-aTAA, i.e. >4.5cm vs 5.5cm respectively2. Recently, these guidelines3 changed. Operative intervention for BAV-aTAA is now ≥5.5cm for asymptomatic patients and ≥5.0cm for patients with family history of aortic dissection or aortic growth rate ≥0.5cm/year. Concomitant repair is recommended for BAV-aTAA >4.5cm, when undergoing surgical aortic valve replacement (SAVR). These guidelines reflect a continually evolving understanding of the biomechanics of aortic dissection.
Aortic wall has complicated microstructure of collagen and elastin within its three layers of intima, media, and adventitia and has the ability to respond to pathophysiologic conditions by remodeling. Dissection/rupture is simply a material failure of the aortic wall and occurs biomechanically when wall stress exceeds wall strength. Studies6–8 have suggested that BAV-aTAA tensile strength is equivalent or higher than that of TAV-aTAA. We and others from the International Registry for Aortic Dissection (IRAD)9,10 have also demonstrated that dissection can occur in a significant proportion of patients with aTAA sizes less than the recommended guidelines. As such, optimal treatment for both BAV- and TAV-aTAA patients may require elective repair at smaller aTAA sizes in a patient-specific fashion to preclude dissection/rupture using clinical and biomechanical risk factors. The question remains whether BAV remains a clinical risk factor for dissection from a biomechanics perspective. If BAV has similar or greater wall strength than TAV-aTAA, then comparative wall stress should provide information regarding relative dissection risk of BAV vs TAV.
Wall stress unfortunately cannot be directly measured; however, stress can be determined computationally. Finite element analysis (FEA) represents a validated technique in computational modeling to investigate mechanical stress in physiologic systems, where stress would otherwise be impossible to measure in vivo. FEA has been widely used to quantify wall stress in arteries11,12. The aim of this study was to compare aTAA wall stress between BAV and TAV patients using FEA.
Materials and Methods
We performed a retrospective analysis of aTAA patients from our surgical clinic database at San Francisco Veterans Affairs Medical Center (SFVAMC). Inclusion criterion was >4.5cm aTAA based on ECG-gated computed tomography angiography (CTA). Exclusion criteria were those with poor image quality resolution or motion artifact on imaging. Patients with previous SAVR or only aortic root dilatation were excluded. There were 36 (BAV=17, TAV=19) patients with aTAA >4.5cm and suitable CTA for biomechanical evaluation. BAV sub-phenotypes were not differentiated. No patients had a family history of dissection or connective tissue disorder but one patient in each group (BAV and TAV) had a family history of aortic aneurysm. This study was approved by Committee on Human Research at University of California San Francisco Medical Center and Institutional Review Board at SFVAMC. Table 1 summarizes patient clinical profiles. De-identified images were used to reconstruct 3D geometry of the aortic root, ascending aorta, and portion of descending thoracic aorta.
Table 1.
Clinical data of BAV vs. TAV aTAA patients.
| BAV (n =17) | TAV (n=19) | P | |||
|---|---|---|---|---|---|
| Aneurysm diameter (cm) | 5.08 (4.90-5.30) | 5.00 (4.84-5.70) | 0.515 | ||
| Age | 64 (61-67) | 68 (65-75) | 0.133 | ||
|
| |||||
| no. | % | no. | % | ||
|
| |||||
| Aortic stenosis | |||||
| None | 5 | 29.4 | 14 | 73.7 | 0.392 |
| Mild | 2 | 11.8 | 2 | 10.5 | |
| Moderate | 1 | 5.9 | 0 | 0 | |
| Severe | 9 | 52.9 | 3 | 15.8 | |
| Aortic insufficiency | |||||
| None | 6 | 35.3 | 5 | 26.3 | 0.392 |
| Mild | 8 | 47.1 | 9 | 47.4 | |
| Moderate | 3 | 17.7 | 2 | 10.5 | |
| Severe | 0 | 0 | 3 | 15.8 | |
Age and diameter are presented as median (25%-75% IQR).
Development of Finite Element (FE) Model
FE model for each patient was developed. First, CT scan images were exported as Digital Imaging and Communications in Medicine (DICOM) files and imported into MeVisLab, open source surface reconstruction software (http://www.mevislab.de/home/about-mevislab) for image segmentation. Next, smooth three-dimensional surface was constructed and imported into LS-DYNA (LSTC Inc., Livermore, CA), commercially available FE software package. LS-DYNA was used for pressure loading simulations and data analysis.
Zero-pressure geometry
CT images used to reconstruct patient-specific 3D aTAA geometry represented geometry under in vivo physiologic blood pressure conditions and was therefore considered pre-stressed. FE simulations based on these geometries would load from 0mmHg to physiologic blood pressure and thus add stress to already pre-stressed geometry. We and others have demonstrated the importance of accounting for this pre-stress to accurately determine in vivo wall stress13. Here, we used modified update-Lagrangian method to calculate pre-stress14. In this framework FE geometry is virtually fixed in space while pre-stress deformation matrix is obtained through an iterative process. Figure 1a shows representative aTAA FE mesh.
Figure 1.
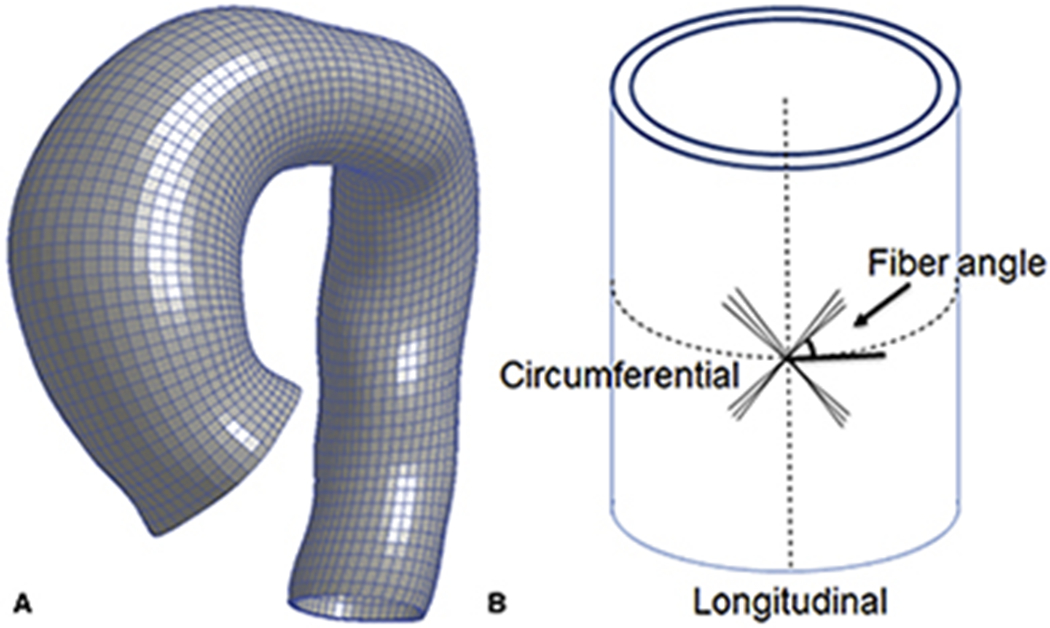
a. Representative mesh for FE simulation of aTAA. 1b. Sketch of fiber angle dispersion with respect to circumferential direction.
Collagen-Embedded Hyperelastic Material Model
ATAA wall was modeled as incompressible hyperelastic material, comprised of non-collagen matrix reinforced with dispersed collagen fibers. Total strain energy density function for aTAA was derived from the composite of both strain energy density function of ground matrix and that of collagen fibers as:
| (1) |
where is isochoric part of the right Cauchy-Green deformation tensor C and J is Jacobian of the deformation gradient. Ψ(J ) enforces the incompressibility of aortic tissue. Ground matrix was assumed to be isotropic and to have neoHookean-like strain energy density function:
| (2) |
where is the first invariant of and a is a material constant.
We assumed two collagen fibers distributed symmetrically along the circumferential direction (figure 1b) with dispersed collage fibers15:
| (3) |
where is an invariant that reflects the impact of each fiber family deformation on strain energy function15 as shown in figure 1b; k1 an k2 are material parameters determined by mechanical testing of the material16 (Table 2).
Table 2.
Material Parameters of BAV and TAV aTAAs.
| Material parameters | k1 | k2 | Fiber angle (rad) |
|---|---|---|---|
| Bicuspid | 66.73 | 17.16 | 0.60 |
| Tricuspid | 84.70 | 9.85 | 0.78 |
Finite Element Simulation
FE simulations were performed using LS-DYNA with user defined material subroutine as described in Eqn 1. Reconstructed aTAA wall surface from annulus to descending thoracic aorta was modeled using three-dimensional brick elements with average element size of ~1.5mm. All translational motion at the proximal annulus and distal descending thoracic aorta were fixed with rotational freedom. Simulation was performed by applying physiologic arterial pressure loading conditions to aTAA inner lumen. Models were first pre-stressed to diastolic pressure (80mmHg). Internal pressure was then ramped up from 80mmHg to systolic pressure (120mmHg) over 100ms duration, followed by decrease to diastolic pressure over another 100ms period. One cardiac cycle of 800ms duration was then applied. Cardiac cycle was composed of 300ms ramp upwards to maximum systolic pressure, followed by 500ms ramp downwards to minimum diastolic pressure. Material properties for respective BAV vs TAV-aTAA were used based on our previous biaxial testing16.
Statistical analysis
The 99th-percentile wall stress as previously described17 was used for statistical analysis. 99th-percentile wall stress has been demonstrated to be more reproducible than peak wall stress because it avoids non-physiologic peak wall stresses that can occur from inhomogeneities in the FE mesh. References to peak wall stresses will hereafter be represented by 99th-percentile wall stress for simplicity. Continuous measurements of aneurysm size, patient age, and wall stress were presented as median and (25%-75%) interquartile range. Categorical measurements are presented as numbers and percentages. Since the data were not normally distributed, continuous and categorical variables were compared between BAV and TAV patients using Mann-Whitney U-test and Kruskal-Wallis test, respectively18. Spearman rank correlation coefficients were used to determine relationship between aneurysm diameter and wall stress. P-value <0.05 was considered statistically significant. Statistical analyses were performed using R(R 3.4.0 http://www.r-project.org).
Results
Patient Demographics
BAV and TAV-aTAA patients were similar ages (64 vs. 68, p=0.1277), had similar aneurysm sizes (5.08 vs. 5, p=0.5152), and had similar incidence of aortic valve disease (p=0.3916) (Table 1).
BAV-ATAA Wall Stress
BAV-aTAA 99th-percentile longitudinal stresses17 were 280kPa (236-307kPa) at systolic pressure. There was a trend for highest longitudinal stress to be located on aTAA greater curvature (figure 2a). BAV-aTAA 99th-percentile circumferential stresses were 548kPa (483-595kPa) at systolic pressure. Regions of greatest circumferential stress were located on aTAA lesser curvature (figure 2b). These figures also demonstrate that greatest wall stresses did not localize to the plane of maximum aTAA diameter.
Figure 2.
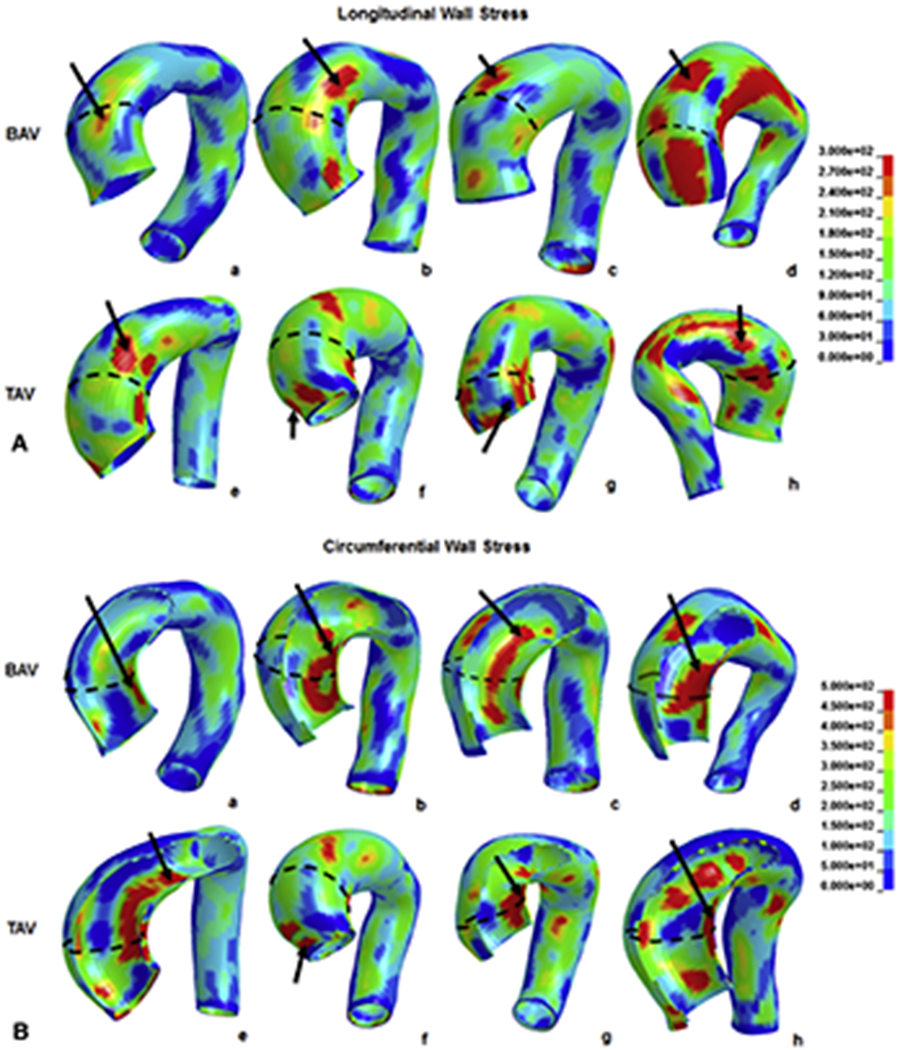
a. Typical wall stress distribution on BAV (a-d) and TAV-aTAA (f-i) along longitudinal direction. 2b. Typical wall stress distribution on BAV (a-d) and TAV-aTAA (f-i) along circumferential direction.
TAV-ATAA Wall Stress
TAV-aTAA 99th-percentile longitudinal stresses were 242kPa (189-267kPa) at systolic pressure. No differences were found between greater and lesser curvature regions (figure 2a). Peak longitudinal stresses were greater in BAV- than TAV-aTAA (p=0.0275). TAV-aTAA 99th-percentile circumferential stresses were 462kPa (357-536kPa) at systolic pressure. Similar to BAV-aTAA, regions of highest circumferential stress were located on aTAA lesser curvature (figure 2b). Similarly, peak circumferential stresses were greater in BAV- than TAV-aTAA (p=0.033).
ATAA Wall Stress Correlation with Diameter
Maximum aortic diameter and 99th-percentile wall stress was correlated in a linear relationship. For BAV-aTAA, maximum aortic diameter showed no correlation with circumferential or longitudinal 99th-percentile wall stress (r=0.0074 and r=−0.0037, respectively) (figure 3), while TAV-aTAA showed better correlation. Correlation between maximum diameter and TAV-aTAA peak wall stress was r=0.7110 for circumferential and r=0.6766 for longitudinal direction. BAV- and TAV-aTAA 99th-percentile stresses in circumferential and longitudinal directions in systole are shown (figure 4a).
Figure 3.
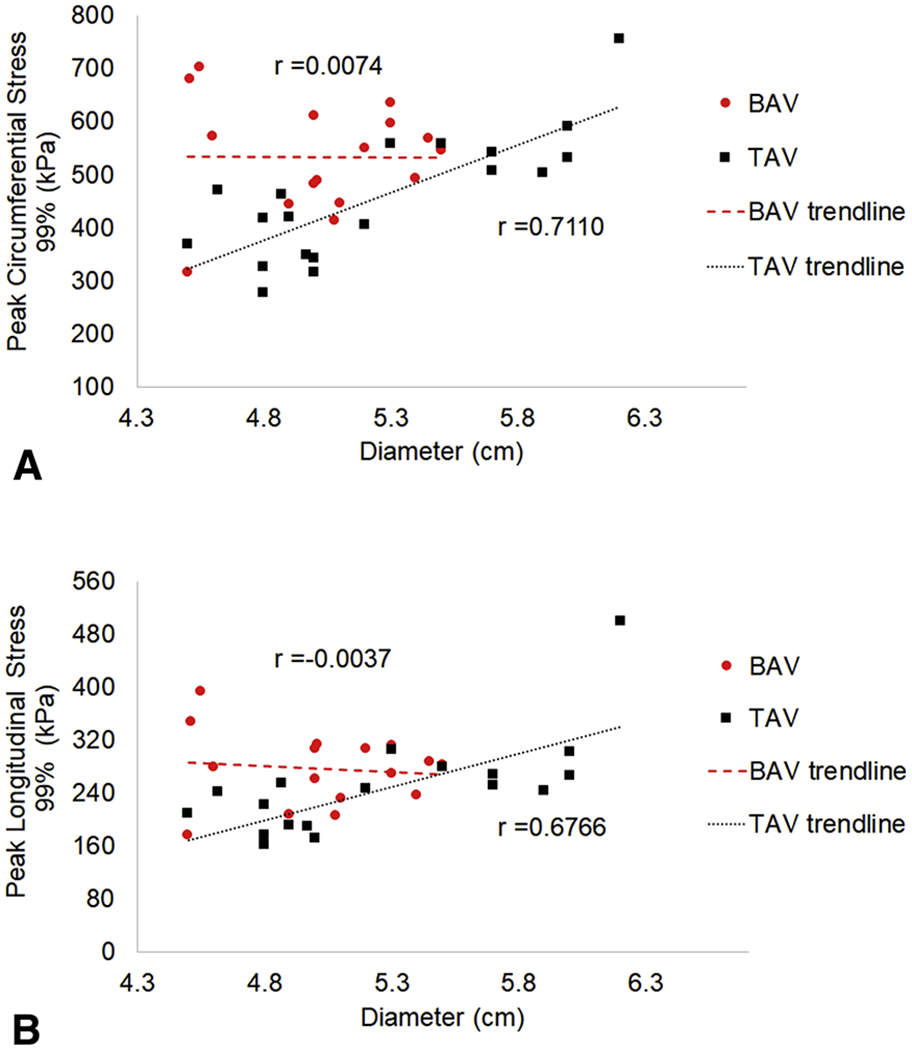
a. Relationship between 99-percentile circumferential stress and aTAA maximum diameter for BAV (circles) and TAV (squares). 3b. Relationship between 99-percentile longitudinal stress and aTAA maximum diameter. Correlation between stress and diameter with r is shown as dashed line for BAV and dotted line for TAV.
Figure 4.
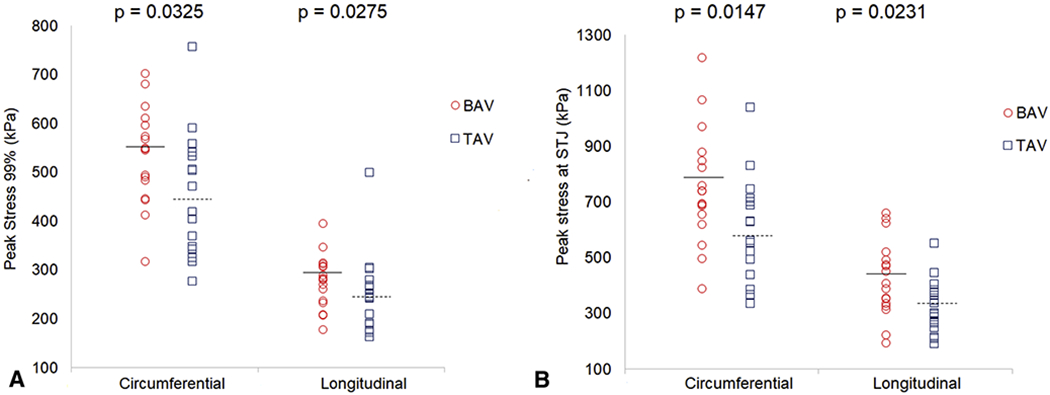
Peak wall stress and median values in a) ascending aorta and b) STJ of BAV vs. TAV-aTAA at systolic pressure with median values in BAV- (solid line) vs. TAV-aTAA (dashed line) in systole.
Wall Stress of Sinotubular Junction
Since the sinotubular junction (STJ) is one well-recognized region for initial entry tear for acute type A dissection, we analyzed STJ subregion from above aortic valve leaflet commissures to 1cm distal to STJ. Circumferentially, STJ peak wall stresses for BAV-aTAA were 739kPa (654-846kPa) at systolic pressure (figure 4b), while those for TAV-aTAA were 560kPa (498-692kPa, p=0.015). Longitudinally, STJ peak wall stresses for BAV-aTAA were 405kPa (335-489kPa) at systolic pressure compared to those for TAV-aTAA of 329kPa (266-377kPa, p=0.023). Correlation between maximum aneurysm diameter and STJ peak stress in circumferential direction was weaker for BAV-aTAA (r=0.416) than for TAV-aTAA (r= 0.600), which was also weak. Similarly, correlation between maximum aneurysm diameter and STJ peak stress in longitudinal direction was much weaker for BAV-aTAA (r= 0.162) than TAV-aTAA (r= 0.541), which also had poor correlation.
STJ greater versus lesser curvature regions were also compared (Table 3). Peak circumferential stresses in BAV-aTAA were significantly larger in the lesser compared to greater curvature of STJ, and peak longitudinal stresses trended toward higher stresses in greater than lesser curvature. On the other hand, peak wall stresses were not significantly different between greater and lesser curvature of STJ for TAV-aTAAs in either circumferential or longitudinal directions. Comparing BAV and TAV-aTAAs in greater and lesser curvature STJ subregions, peak circumferential stresses of BAV-aTAAs were significantly greater than that for TAV-aTAAs in both the greater and lesser curvature STJ subregions. In contrast, in the longitudinal direction, no significant differences were found between wall stresses of BAV and TAV-aTAAs in greater or lesser curvature STJ subregions.
Table 3.
Comparison of Wall Stress in Greater and Lesser Curvature Regions of STJ.
| STJ | BAV | TAV | p value |
|---|---|---|---|
| Circumferential - Greater Curvature | 545(496-612) | 432(378-568) | 0.038 |
| Circumferential - Lesser Curvature | 739(600-863) | 521(450-662) | 0.008 |
| p value | 0.005 | 0.085 | |
| STJ | BAV | TAV | p value |
|
| |||
| Longitudinal - Greater Curvature | 405(249-489) | 299(229-368) | 0.076 |
| Longitudinal - Lesser Curvature | 275(247-331) | 264(217-331) | 0.490 |
| p value | 0.068 | 0.358 | |
Stress values are presented as median (IQR 25%-75%).
Discussion
Aortic size and wall stress
ACC/AHA guidelines for aTAA elective repair have varied over the years primarily for BAV-aTAA, which decreased from ≥5.0cm in 20064 to <5cm in 20102, then increased most recently in 20145 and 20163 to ≥5.5cm which now matches guidelines for TAV-aTAA of ≥5.5cm unless family history of dissection or growth rate ≥0.5mm/year is present. However, none of these guidelines reflect level A evidence, suggesting better clinical and biomechanical evidence is required than size alone for BAV vs TAV treatment options.
ATAA size with addition of growth rate and symptoms has served as the basis for timing of elective surgical aTAA repair to avoid the risks of dissection/rupture. However, we and IRAD have shown acute type A dissection with aortic sizes smaller than the recommended guidelines10,19. A biomechanical study also demonstrated that maximum aortic diameter failed to predict rupture/dissection especially for small sized aTAAs20. BAV patients were shown to be more subject to dissection at smaller size compared to TAV-aTAA patients19, while other studies suggested very low incidence of BAV-aTAA dissection1,21. While current criteria for BAV-aTAA include size ≥5.5cm, high-volume aortic centers recommended early ascending aortic replacement22 to reduce the risk of preventable type A dissection for aTAA >5.0cm. Given the challenges of using size criteria for surgical aTAA repair and conflicting data regarding risks of dissection with BAV vs TAV phenotype, wall stress can provide patient-specific information regarding risk of dissection and can potentially optimize timing of operative intervention.
In this study, we demonstrated greater peak wall stresses in BAV-aTAA circumferentially than TAV-aTAA in systole. There were no significant differences in longitudinal stresses between BAV and TAV-aTAA patients in systole. However, when we examined the STJ, one subregion for intimal tears in type A dissection, there were significantly greater wall stresses in BAV vs TAV-aTAA patients in both circumferential and longitudinal directions. These data suggest that BAV may be at more risk of dissection than TAV-aTAA in that region. We also found that neither circumferential nor longitudinal peak wall stresses correlated with BAV-aTAA maximum diameter. Taken together, these results suggest that diameter may not be a good criterion for evaluation of dissection risk for BAV-aTAAs and that patient-specific wall stresses may improve risk stratification. Similarly, while STJ circumferential and longitudinal peak wall stresses showed better correlation with maximum aTAA diameter for TAV-aTAA than BAV-aTAA, overall correlation of wall stress and diameter was still weak. As such wall stress can be considered an independent factor for dissection than aTAA diameter. Our results also showed that BAV-aTAA of smaller size can have proportionally larger wall stress, suggesting an increased dissection risk when using traditional size criteria. On the other hand, wall stress did not increase with increased diameter for BAV-aTAA patients. Overall, our results suggest the need for patient-specific evaluation of dissection risk based upon wall stress. Wall stress is a patient-specific factor driven primarily by patient-specific geometry. Notably, we found the location of greatest wall stress was not found in the plane of maximum aortic diameter. Greatest wall stress occurred by large deformation of a specific area. Thus, our results emphasized the importance of patient-specific wall stress determination to independently evaluate the risk of type A dissection for BAV and TAV-aTAA.
Compared to previous work on aTAA wall stress, our results have some similarity to those from Nathan’s group23. They showed mean 99th-percentile von Mises wall stress in BAV was greater than in TAV group (540kPa vs 500kPa) although without statistical significance which contrasts with our results. They examined von Mises stress while we studied circumferential vs longitudinal stress. They did not take into account pre-stress geometry which we did. Our results showed von Mises stress of 555kPa for BAV-aTAAs and 450kPa for TAV-aTAAs with larger aTAA diameters in our study cohort than in their study (5.05cm vs 4.0cm for BAV, respectively and 5.25 vs 4.1cm for TAV, respectively). Another simulation study of wall stress analysis24 showed similar overall peak systolic wall stresses for BAV and TAV-aTAA (average maximum systolic stress 484kPa vs 471kPA, respectively) for average aTAA maximum diameter of 5.1cm for BAV and 5.0cm for TAV. In that study, they found that aortic size index was suitable for identifying the lowest risk patients for rupture, but unsuitable for distinguishing patients at moderate vs. high risk. They suggested that BAV-aTAA carried higher dissection risk than TAV-aTAA despite similar rupture pressures. Our study had similar mean aTAA diameters for BAV and larger diameters for TAV-aTAA than theirs as well as greater wall stresses based upon our patient-specific geometries. We also highlighted that wall stresses in BAV-aTAA could be significantly greater in smaller BAV-aTAA concerning for increased risk of rupture not captured by current guidelines
Dissection and wall strength
Aortic dissection reflects mechanical failure of the aortic wall which no longer remains intact at physiologic blood pressure to contain the body’s blood circulation. Aortic dissection occurs when aortic wall stress exceeds wall strength of the intima layer. Previous work6 demonstrated greater aTAA wall strength along the circumferential compared to longitudinal direction. These results suggest that the initial failure and intimal tear would begin transversely and propagate along the circumferential spiral10. Transverse tears often occur in acute type A dissection where the initial tear is situated within the first few centimeters of ascending aorta25. When we analyzed the STJ subregion, peak stress along longitudinal direction was greater than that for overall ascending aorta for both BAV (405KPa vs 280KPa, respectively) and TAV (329KPa vs 242KPa, respectively), supporting that location for initiating tears. Lower STJ wall stress was seen along greater than lesser curvature for BAV-aTAA in the circumferential direction. However, there was a trend toward higher stress in the STJ greater curvature in BAV than TAV-aTAA along the longitudinal direction, which requires larger patient population for further study25.
If patient-specific peak wall stresses remain far below mean tensile strength at physiologic and hypertensive blood pressures, then the risk of dissection should remain low and the aTAA not likely to rupture. Given recent data on failure strength of both BAV- and TAV-aTAAs, patient-specific wall stress analyses can assist clinically in determining timing for elective surgical aTAA repair to prevent risk of dissection, by examining <5.5cm aTAA with peak stresses of concern that approach the tensile strength.
Conflicting data has been reported regarding BAV vs TAV wall strength. Gleason et al.26 showed greater wall tensile strength of BAV vs TAV-aTAA in both circumferential and longitudinal directions7 despite uniform collagen distribution in both. Gasser et al.7 showed that BAV-aTAA wall strength was two times greater than TAV-aTAA with identical collagen orientation. BAV had greater collagen stiffness but equivalent elastin stiffness as TAV-aTAA to account for the overall greater wall strength. In contrast, Sun et al.27 demonstrated that failure mechanics between BAV and TAV-aTAA were equivalent, BAV was stiffer than TAV-aTAA, had less elastin, and was thinner. Histologically, studies28 have demonstrated accumulation of mucoid material, elastin fragmentation, and change of smooth muscle cell orientation in BAV-aTAA compared with TAV-aTAA. Highly aligned elastin and collagen fibers and reduced immature collagen were observed in BAV-aTAA compared to TAV-aTAA26. Clearly, additional work in the field of strength mechanics between BAV and TAV-aTAA will be required; however, to date, none have suggested weaker BAV compared to TAV-aTAA wall strength. As such, patient-specific wall stress plays an important role in distinguishing risk of dissection for BAV vs TAV-aTAAs.
Influence of Wall Shear Stress
Wall stress by FEA in this study represents the stress due to blood pressure on aTAA wall. Wall shear stress by blood flow, on the other hand, is orders of magnitude smaller than wall stress29 and represents the stress seen by endothelial cells of intimal layer based upon blood flow. One postulate for BAV-aTAA formation is hydrodynamic, based on abnormal flow pattern through BAV leading to helical flow patterns and BAV-aTAA eccentric morphology29,30. Wall shear stress from abnormal blood flow was hypothesized to predispose to aneurysm development, while hemodynamics and wall stress acted synergistically to initiate the intimal defect by inducing disruption of aortic wall layers whose biomechanical differences could magnify those effects.
Study Limitations
One study limitation was inability to use patient-specific material properties, which may potentially influence results. Determination of in vivo patient-specific material properties requires measurement of in vivo aortic wall motion with costly and time consuming magnetic resonance imaging with cine displacement encoded imaging with stimulated echoes31 (DENSE) and was therefore outside the scope of this study. However, we did use separate material properties for calculating in vivo stress for BAV and TAV-aTAA, respectively, which were obtained from mechanical stretch testing to determine averaged material properties for BAV and TAV-aTAAs, respectively16. Our group is presently quantifying differences in calculated stresses with use of averaged versus patient-specific material properties in small subset of surgical aneurysm patients to determine the impact of material properties on wall stresses. Another limitation was that aTAA regions were assumed to be homogeneous for each patient. However, there is again conflicting evidence regarding the differences in wall thickness between BAV and TAV-aTAA, with one study which showed BAV-aTAA was thinner32, while another study showed BAV-aTAA had equivalent thickness as TAV-aTAA. Further information of localized thickness with advances in imaging technique would improve the risk evaluation for dissection. Boundary conditions were fixed for rigid body motion with rotational freedom of the aortic annulus proximally and descending thoracic aorta distally. Anatomically, the ligamentum arteriosum provides restraint which can impact stress results and has particular impact in entry tears for type B aortic dissection. In this study we did not determine the insertion point of the ligamentum but did include the descending thoracic aorta with a fixed distal end to minimize errors from applying boundary conditions too proximally in the arch. Our model did not include the left ventricle and thus fixation at the annulus was the most appropriate boundary condition for the current model. Additional factors not modeled that may impact wall stress analysis included passive support from structures in the mediastinum such as the pulmonary artery and were beyond the scope of the present work. Lastly, heterogeneity in stenosis vs regurgitation among our BAV vs TAV population can impact wall shear stresses between the two groups. However, wall shear stress is orders of magnitude less than wall stress based upon blood pressure29. Wall shear stress caused by blood flow along the intima and affecting endothelial cell lining was beyond the scope of current study but may help understanding of growth and remodeling of BAV-aTAA based on flow eccentricities in the future. Our study population was limited to males due to the veteran population and requires further study in women. Future studies will be performed which examine the influence of valve disease, stenosis vs regurgitation, in combination with valve phenotype, BAV vs TAV, and size on wall stress in aTAAs but will require a much larger study population for statistical analyses.
Conclusions
We determined patient-specific wall stresses on aTAA patients with bicuspid aortic valve vs. tricuspid aortic valve. Correlation between peak wall stress and aneurysm diameter was found to be very weak especially for BAV-aTAAs, thus highlighting the need for patient-specific aneurysm wall stress analysis to evaluate aortic dissection risk and optimize timing of operative intervention.
Supplementary Material
Video 1. Longitudinal stress of BAV-aTAA with systemic pressure loading.
Central Message:
Wall stress was not correlated with BAV-aTAA diameter and would be an important consideration for optimizing timing of surgical intervention for BAV and likely TAV patients with <5.5cm aTAA.
Perspective Statement:
We demonstrated that both circumferential and longitudinal stresses were greater in BAV vs TAV-aTAA. Peak wall stresses did not correlate with BAV-aTAA diameter and weakly correlated with TAV-aTAA diameter, suggesting that diameter alone is a poor predictor of aTAA dissection risk and patient-specific aTAA wall stresses should be considered.
Acknowledgements
The study was funded by the National Institutes of Health, R01HL119857-01A1.
Abbreviations and Acronyms
- BAV
bicuspid aortic valve
- TAV
tricuspid aortic valve
- aTAA
ascending thoracic aortic aneurysm
- SAVR
surgical aortic valve replacement
- STJ
sinotubular junction
- CT
computed tomography
- CTA
computed tomography angiography
- FE
finite element
- FEA
finite element analyses
- cm
centimeter
- kPa
kilopascal
- SFVAMC
San Francisco Veterans Affairs Medical Center
- ACC
American College of Cardiology
- AHA
American Heart Association
Footnotes
Presented at Western Thoracic Surgical Association 2017, Colorado Springs, Colorado, June 24, 2017.
The authors have no conflicts of interest.
References
- 1.Davies RR, Kaple RK, Mandapati D, et al. Natural history of ascending aortic aneurysms in the setting of an unreplaced bicuspid aortic valve. Ann Thorac Surg. 2007;83(4):1338–1344. [DOI] [PubMed] [Google Scholar]
- 2.Hiratzka LF, Bakris GL, Beckman JA, et al. 2010 ACCF/AHA/AATS/ACR/ASA/SCA/SCAI/SIR/STS/SVM Guidelines for the Diagnosis and Management of Patients With Thoracic Aortic Disease. J Am Coll Cardiol. 2010;55(14):e27–e129. doi: 10.1016/j.jacc.2010.02.015 [DOI] [PubMed] [Google Scholar]
- 3.Hiratzka LF, Creager MA, Isselbacher EM, et al. Surgery for Aortic Dilatation in Patients With Bicuspid Aortic Valves: A Statement of Clarification From the American College of Cardiology/American Heart Association Task Force on Clinical Practice Guidelines. J Am Coll Cardiol. 2016;67(6):724–731. doi: 10.1016/j.jacc.2015.11.006 [DOI] [PubMed] [Google Scholar]
- 4.Bonow RO, Carabello BA, Chatterjee K, et al. ACC/AHA 2006 guidelines for the management of patients with valvular heart disease: a report of the American College of Cardiology/American Heart Association Task Force on Practice Guidelines (writing Committee to Revise the 1998 guidelines for the management of patients with valvular heart disease) developed in collaboration with the Society of Cardiovascular Anesthesiologists endorsed by the Society for Cardiovascular Angiography and Interventions and the Society of Thoracic Surgeons. J Am Coll Cardiol. 2006;48(3):e1–e148. [DOI] [PubMed] [Google Scholar]
- 5.Nishimura RA, Otto CM, Bonow RO, et al. 2014 AHA/ACC Guideline for the Management of Patients With Valvular Heart Disease: a report of the American College of Cardiology/American Heart Association Task Force on Practice Guidelines. Circulation. 2014;129(23):e521–643. doi: 10.1161/CIR.0000000000000031 [DOI] [PubMed] [Google Scholar]
- 6.Pichamuthu JE, Phillippi JA, Cleary DA, et al. Differential tensile strength and collagen composition in ascending aortic aneurysms by aortic valve phenotype. Ann Thorac Surg. 2013;96(6):2147–2154. [DOI] [PMC free article] [PubMed] [Google Scholar]
- 7.Forsell C, Björck HM, Eriksson P, Franco-Cereceda A, Gasser TC. Biomechanical Properties of the Thoracic Aneurysmal Wall: Differences Between Bicuspid Aortic Valve and Tricuspid Aortic Valve Patients. Ann Thorac Surg. 2014;98(1):65–71. doi: 10.1016/j.athoracsur.2014.04.042 [DOI] [PubMed] [Google Scholar]
- 8.Pham T, Martin C, Elefteriades J, Sun W. Biomechanical characterization of ascending aortic aneurysm with concomitant bicuspid aortic valve and bovine aortic arch. Acta Biomater. 2013;9(8):7927–7936. doi: 10.1016/j.actbio.2013.04.021 [DOI] [PMC free article] [PubMed] [Google Scholar]
- 9.Di Eusanio M, Trimarchi S, Patel HJ, et al. Clinical presentation, management, and short-term outcome of patients with type A acute dissection complicated by mesenteric malperfusion: observations from the International Registry of Acute Aortic Dissection. J Thorac Cardiovasc Surg. 2013;145(2):385–390. [DOI] [PubMed] [Google Scholar]
- 10.Jaussaud N, Chitsaz S, Meadows A, et al. Acute type A aortic dissection intimal tears by 64-slice computed tomography: a role for endovascular stent-grafting? J Cardiovasc Surg Torino. 2013;54(3):373–381 [PubMed] [Google Scholar]
- 11.Natsume K, Shiiya N, Takehara Y, et al. Characterizing saccular aortic arch aneurysms from the geometry-flow dynamics relationship. J Thorac Cardiovasc Surg. 2017;153(6): 1413–1420.e1. doi: 10.1016/j.jtcvs.2016.11.032 [DOI] [PubMed] [Google Scholar]
- 12.Wang Z, Wood NB, Xu XY. A viscoelastic fluid–structure interaction model for carotid arteries under pulsatile flow. Int J Numer Methods Biomed Eng. 2015;31(5):n/a–n/a. doi: 10.1002/cnm.2709 [DOI] [PubMed] [Google Scholar]
- 13.Wisneski AD, Mookhoek A, Chitsaz S, et al. Patient-specific finite element analysis of ascending thoracic aortic aneurysm. J Heart Valve Dis. 2014;23(6):765. [PMC free article] [PubMed] [Google Scholar]
- 14.Gee MW, Förster C, Wall WA. A computational strategy for prestressing patient-specific biomechanical problems under finite deformation. Int J Numer Methods Biomed Eng. 2010;26(1):52–72. doi: 10.1002/cnm.1236 [DOI] [Google Scholar]
- 15.Gasser TC, Ogden RW, Holzapfel GA. Hyperelastic modelling of arterial layers with distributed collagen fibre orientations. JR Soc Interface. 2006;3(6):15–35. doi: 10.1098/rsif.2005.0073 [DOI] [PMC free article] [PubMed] [Google Scholar]
- 16.Azadani AN, Chitsaz S, Mannion A, et al. Biomechanical properties of human ascending thoracic aortic aneurysms. Ann Thorac Surg. 2013;96(1):50–58. doi: 10.1016/j.athoracsur.2013.03.094 [DOI] [PubMed] [Google Scholar]
- 17.Speelman L, Bosboom EMH, Schurink GWH, et al. Patient-Specific AAA Wall Stress Analysis: 99-Percentile Versus Peak Stress. Eur J Vasc Endovasc Surg. 2008;36(6):668–676. doi: 10.1016/j.ejvs.2008.09.007 [DOI] [PubMed] [Google Scholar]
- 18.Linhartová K, Beránek V, Sefrna F, Hanisová I, Sterbáková G, Pesková M. Aortic stenosis severity is not a risk factor for poststenotic dilatation of the ascending aorta. Circ J. 2007;71(1):84–88. [DOI] [PubMed] [Google Scholar]
- 19.Fedak PW, Verma S, David TE, Leask RL, Weisel RD, Butany J. Clinical and pathophysiological implications of a bicuspid aortic valve. Circulation. 2002;106(8):900–904. [DOI] [PubMed] [Google Scholar]
- 20.McGloughlin TM, Doyle BJ. New Approaches to Abdominal Aortic Aneurysm Rupture Risk Assessment. Arterioscler Thromb Vasc Biol. 2010;30(9):1687–1694. [DOI] [PubMed] [Google Scholar]
- 21.Michelena HI, Khanna AD, Mahoney D, et al. Incidence of aortic complications in patients with bicuspid aortic valves. Jama. 2011;306(10): 1104–1112. [DOI] [PubMed] [Google Scholar]
- 22.Wojnarski CM, Svensson LG, Roselli EE, et al. Aortic Dissection in Patients With Bicuspid Aortic Valve–Associated Aneurysms. Ann Thorac Surg. 2015;100(5):1666–1674. doi: 10.1016/j.athoracsur.2015.04.126 [DOI] [PMC free article] [PubMed] [Google Scholar]
- 23.Nathan DP, Xu C, Plappert T, et al. Increased ascending aortic wall stress in patients with bicuspid aortic valves. Ann Thorac Surg. 2011;92(4): 1384–1389. [DOI] [PMC free article] [PubMed] [Google Scholar]
- 24.Martin C, Sun W, Elefteriades J. Patient-specific finite element analysis of ascending aorta aneurysms. Am J Physiol-Heart Circ Physiol. 2015;308(10):H1306–H1316. [DOI] [PMC free article] [PubMed] [Google Scholar]
- 25.Ge L, Tseng EE. Invited commentary. Ann Thorac Surg. 2013;96(6):2154. doi: 10.1016/j.athoracsur.2013.07.087 [DOI] [PubMed] [Google Scholar]
- 26.Phillippi JA, Green BR, Eskay MA, et al. Mechanism of aortic medial matrix remodeling is distinct in patients with bicuspid aortic valve. J Thorac Cardiovasc Surg. 2014;147(3):1056–1064. [DOI] [PMC free article] [PubMed] [Google Scholar]
- 27.Pham T, Martin C, Elefteriades J, Sun W. Biomechanical characterization of ascending aortic aneurysm with concomitant bicuspid aortic valve and bovine aortic arch. Acta Biomater. 2013;9(8):7927–7936. [DOI] [PMC free article] [PubMed] [Google Scholar]
- 28.de Sa M, Moshkovitz Y, Butany J, David TE. Histologic abnormalities of the ascending aorta and pulmonary trunk in patients with bicuspid aortic valve disease: Clinical relevance to the ross procedure. J Thorac Cardiovasc Surg. 1999;118(4):588–596. doi: 10.1016/S0022-5223(99)70002-4 [DOI] [PubMed] [Google Scholar]
- 29.Pasta S, Rinaudo A, Luca A, et al. Difference in hemodynamic and wall stress of ascending thoracic aortic aneurysms with bicuspid and tricuspid aortic valve. J Biomech. 2013;46(10): 1729–1738. [DOI] [PMC free article] [PubMed] [Google Scholar]
- 30.Verma S, Siu SC. Aortic dilatation in patients with bicuspid aortic valve. N Engl J Med. 2014;370(20): 1920–1929. [DOI] [PubMed] [Google Scholar]
- 31.Krishnan K, Ge L, Haraldsson H, et al. Ascending thoracic aortic aneurysm wall stress analysis using patient-specific finite element modeling of in vivo magnetic resonance imaging. Interact Cardiovasc Thorac Surg. 2015;21(4):471–480. doi: 10.1093/icvts/ivv186 [DOI] [PMC free article] [PubMed] [Google Scholar]
- 32.Choudhury N, Bouchot O, Rouleau L, et al. Local mechanical and structural properties of healthy and diseased human ascending aorta tissue. Cardiovasc Pathol. 2009;18(2):83–91 [DOI] [PubMed] [Google Scholar]
Associated Data
This section collects any data citations, data availability statements, or supplementary materials included in this article.
Supplementary Materials
Video 1. Longitudinal stress of BAV-aTAA with systemic pressure loading.