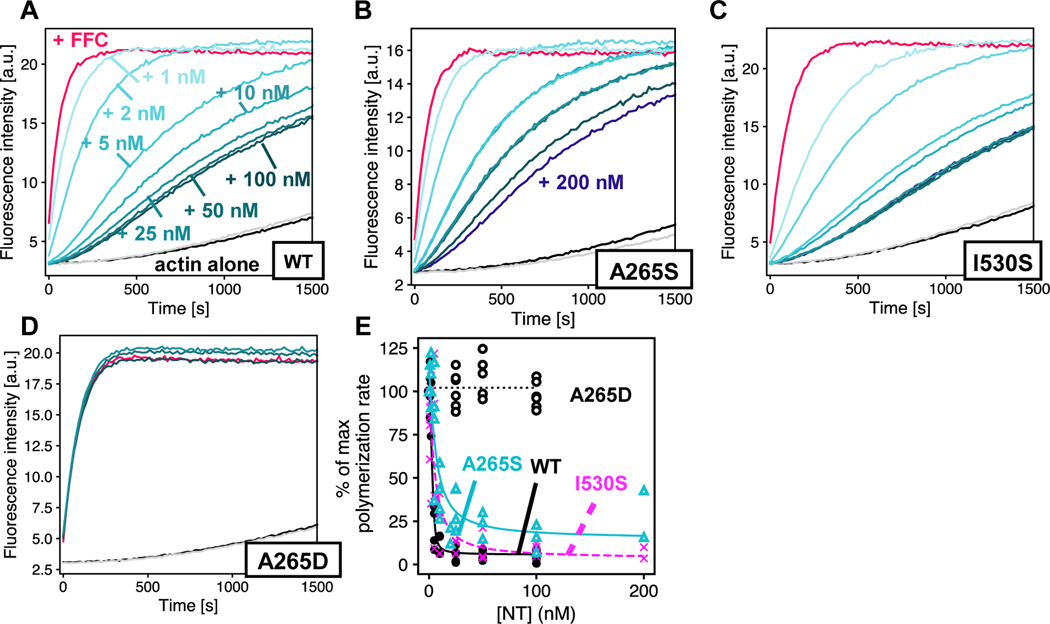
Figure 5. Auto inhibition by DIAPH1-NT mutants.
Pyrene-actin assembly assays were carried out with 2 μM actin (5% pyrene-labeled), ± 5 nM of WT-FFC, titrated with either (A) WT; (B) A265S; (C) I530S; or (D) A265D DIAPH1-NT. Concentrations of NT are indicated in (A), and the color scheme is the same in panels (B-E), with actin plus 200 nM NT and no FFC in gray. (F) Inhibition curves were calculated from the slopes of raw pyrene traces at 100 s and fit with a quadratic binding model that assumes 1:1 binding between dimers. Note that panel (A) in Figures 4 & 5 is the same plot and is shown twice to facilitate comparison with mutants. A replicate of this experiment with completely different protein preparations is shown in Figure S3.

